
 Open Access Article
 This Open Access Article is licensed under a
 Creative Commons Attribution 3.0 Unported Licence
Capacity fading mechanism of tin phosphide anodes in sodium-ion batteries†
Ronnie
Mogensen
,
Julia
Maibach
 ,
Andrew J.
Naylor
and
Reza
Younesi
*
,
Andrew J.
Naylor
and
Reza
Younesi
*
Department of Chemistry-Ångström Laboratory, Uppsala University, Box 538, SE-75121 Uppsala, Sweden. E-mail: reza.younesi@kemi.uu.se
First published on 29th June 2018
Abstract
Tin phosphide (Sn4P3) is here investigated as an anode material in half-cell, symmetrical, and full-cell sodium-ion batteries. Results from the half-cells using two different electrolyte salts of sodium bis(fluorosulfonyl)imide (NaFSI) or sodium hexafluorophosphate (NaPF6) show that NaFSI provides improved capacity retention but results from symmetrical cells disclose no advantage for either salt. The impact of high and low desodiation cut-off potentials is studied and the results show a drastic increase in capacity retention when using the desodiation cut-off potential of 1.2 V as compared to 2.5 V. This effect is clear for both NaFSI and NaPF6 salts in a 1![[thin space (1/6-em)]](https://www.rsc.org/images/entities/char_2009.gif) :1 binary mixture of ethylene carbonate and diethylene carbonate with 10 vol% fluoroethylene carbonate. Hard X-ray photoelectron spectroscopy (HAXPES) results revealed that the thickness of the solid electrolyte interphase (SEI) changed during cycling and that SEI was stripped from tin particles when tin phosphide was charged to 2.5 V with NaPF6 based electrolyte.
:1 binary mixture of ethylene carbonate and diethylene carbonate with 10 vol% fluoroethylene carbonate. Hard X-ray photoelectron spectroscopy (HAXPES) results revealed that the thickness of the solid electrolyte interphase (SEI) changed during cycling and that SEI was stripped from tin particles when tin phosphide was charged to 2.5 V with NaPF6 based electrolyte.
Introduction
Sodium-ion batteries have once again become a hot topic after a distinct slowdown in research after the breakthrough of lithium-ion batteries. The quick increase in battery use in recent years has given rise to some concern that it will not be possible to satisfy all of the applications calling for batteries with raw materials at a reasonable cost and supply security.1 However, lithium-ion batteries are not the only option available for energy storage. The high specific energy and good energy efficiency of lithium-ion batteries make them attractive compared to other battery technologies but there is plenty of room for diversification in battery chemistries. Other battery types can match or outperform lithium-ion batteries in other areas2 such as stationary and price sensitive applications where cost per kW h and environmental sustainability are more important. With this being said the battery cost is lowered by higher specific energy density and longer lifetime in most applications as this minimizes material use and replacement costs.3,4 The renewed interest in sodium-ion batteries is not only a result of their good mix of performance and abundance of raw materials but also their similarity to lithium-ion batteries that allows for the use of a lot of the lessons learned from the extensive research in the lithium-ion battery field. However, on the anode side of sodium-ion batteries there are some differences as compared to lithium-ion batteries where graphite has been used as a reliable anode with good lifetime performance.5 Graphite does not provide any practical capacity in sodium-ion batteries1 and hard carbon is instead the emerging standard anode material for sodium-ion batteries. Hard carbon displays capacities of about 300 mA h g−1, available in two distinct segments one with sloping voltage profile and one plateau at a potential close to that of plating of sodium metal.6 While the capacity and overall energy density of hard carbon is acceptable, there are issues such as the risk of sodium plating at high rates as well as the initial coulombic efficiency that is lower than that of graphite and often in the range of 70–80%.6 There are a lot of alternatives such as conversion anodes and a plethora of other insertion anodes than hard-carbon, but alloying anodes are some of the most promising alternatives. Alloying anodes in both lithium and sodium-ion batteries are well known in literature, partly because of their great promise and partly because of the difficulty to obtain acceptable endurance during cycling. Sodium forms alloys with many different metals such as gallium, bismuth, antimony, and lead but tin stands out in terms of suitable potential, capacity and of course price. Due to the challenge of excessive volume expansion and particle agglomeration a lot of work has been directed towards systems where the active material is situated within a buffer that keeps the particles from aggregating and lessens volume expansion at the cost of capacity.7–10Tin phosphide (Sn4P3) is one of these electrode materials, which irreversibly converts to elemental tin nanocrystals surrounded by elemental phosphorous during the first sodiation and this enables better capacity retention during cycling than pure tin metal.11–17 Even though tin phosphide shows great promise with a good capacity and suitable potential, it suffers from rapid capacity fading that is common to most if not all high capacity allying anodes for sodium-ion batteries. Previous works by different groups have shown clear difference in life time while varying parameters such as electrolyte salt and cut-off potentials in tin alloy systems.18–22 This system is therefore also sensitive to the potential that is utilized as the higher cut-off potential during desodiation as shown by other authors for both the lithium and sodium systems.18,19
It is known that capacity fading in alloying anodes can occur through several mechanisms such as particle isolation and agglomeration.18,23,24 In addition, one major issue is the stability and performance of the solid electrolyte interphase (SEI) which forms as a passivation coating on the particle surface via electrolyte decomposition during the first sodiation. The SEI should ideally adapt to the changing size of the particles during cycling. When the SEI fails to adapt to size changes, the result is formation of cracks in the SEI and thus exposure of reactive surfaces and consequently formation of new SEI resulting in further electrolyte consumption. In this work, the capacity fading of tin phosphide anodes in sodium-ion batteries is investigated. Hard X-ray photoelectron spectroscopy (HAXPES) was used to characterize composition and thickness of the SEI on tin phosphide anodes and how these properties are affected by the choice of cycling voltage window and sodium salt.
Experimental
Tin phosphide
In a typical procedure, 1.6 g of tin powder (Aldrich ≥99%) and 313 mg red phosphorus (Alfa Aesar 325 mesh 98.9%) was added into a steel ball mill vessel and sealed under argon. The vessel was ball milled for one hour in an SPEX 8000 M MiXER/MILL using two 20 mm stainless steel balls weighing 30 grams each. The product was recovered in ambient conditions and the yield was 1.7 g Sn4P3.Prussian blue
Prussian blue powder was synthesized by as briefly described: Na4Fe(CN)6 (SIGMA-ALDRICH ≥99%) was dissolved in a saturated sodium chloride solution to obtain a 4 mM concentration whereupon 37% HCl was added to obtain a 0.12 M HCl concentration and the resulting solution was kept at 80° C overnight resulting in a blue precipitate that was filtered and washed with water and ethanol before drying.Powder characterisation
In order to characterize the pristine electrode powders after synthesis XRD was performed on both the pristine tin phosphide and Prussian blue powder. The XRD measurements were performed on a Stoe & Cie GmbH Stadi X-ray powder diffractometer equipped with a Ge monochromator (Cu Kα1) using transmission mode. The detector a Mythen 1k Si strip detector operated in a sweeping mode with a resolution of 0.015° 2θ. BET surface area measurements were performed on the pristine Sn4P3 powder using a Micromeritics ASAP 2020 system. The nitrogen absorption isotherms were collected after degassing of the sample at 80 °C for 1 h followed by 120 °C for 4 h. Determination of particle size was performed on both tin phosphide and Prussian blue using a Zeiss 1550 SEM and measurements were done on as synthesized powders.Electrochemical tests
Tin phosphide electrodes were prepared by mixing the tin phosphide powder with Super P additive carbon (Erachem) and sodium carboxymethylcellulose (NaCMC) (Sigma-Aldrich) binder in proportion of 80 wt% Sn4P3, 10 wt% Super P and 10 wt% Na-CMC. The water-based slurry was cast onto copper foil and 13 mm circular electrodes were punched out before drying the electrodes for 12 h at 120 °C under vacuum. The active material mass loading varied between 1.4–2 mg per electrode. Metallic sodium counter electrodes were prepared by hydraulic pressing of sodium pieces into a thin layer of sodium on aluminium foil substrates. The sodium coated aluminium foil was punched into 14 mm disks before use. All handling of metallic sodium was done in argon gloveboxes. Prussian blue electrodes were prepared by ball milling the pristine powder together with C65 carbon (C-NERGY) and sodium alginate (A2033 SIGMA) in wt% ratio of 87:10:3 in water. The resulting slurry was coated on carbon coated aluminium foil and 13 mm disk electrodes were punched out before drying the electrodes at 120 °C under vacuum for 11 hours.
Electrolytes were prepared in an argon glove box by mixing ethylene carbonate (EC) and diethyl carbonate (DEC) (both BASF) in a 1:1 ratio by volume into a stock solution. To the prepared stock solution sodium salts amounting to a 1 M concentration was added to obtain sodium bis(fluorosulfonyl)imide (NaFSI, Solvionic) and sodium hexafluorophosphate (NaPF6, Fluorochem) electrolytes. After the addition of salts to the stock solutions, fluoroethylene carbonate (FEC, Aldrich 99%) was added to obtain a 10 vol% content of FEC additive.
Half-cells for galvanostatic cycling and cyclic voltammetry were assembled in pouch cells using 50 μL electrolyte and 20 mm diameter disks of Whatman glass fiber separators while the cells assembled for HAXPES analysis used solupor separators. Galvanostatic cycling was performed between the cut-off potentials of 0.01 V to 1.2 or 2.5 V, respectively using a current density of 50 mA g−1. Cyclic voltammetry (CV) was performed between 0.01–2.5 V vs. Na+/Na using a scan speed of 1 mV s−1.
Symmetrical cells were prepared by pre-cycling tin phosphide electrodes in half-cells at 50 mA g−1. One of the two electrodes was sodiated and disassembled and the other was sodiated and desodiated before assembly. Pre-cycling was performed in accordance with the routine for galvanostatic half-cells tests. During assembly 50 μL fresh electrolyte was added to the symmetrical cell as well as a pristine separator. Capacities are calculated from active mass of the sodiated electrode. Cycling of the symmetrical cells was performed between −1.25 V & 1.25 V. Full-cells were constructed by combining an uncycled tin phosphide electrode with an oversized Prussian blue electrode containing 8.6 mg active material making the cell anode limited. Cycling was performed between 1 V and 3.7 V at 50 mA g−1 & 11.6 mA g−1 calculated from the active mass of Sn4P3 and Prussian blue respectively.
HAXPES
HAXPES analysis was performed using the HIKE instrument (KMC-1 beamline) at the synchrotron facility BESSY II at Helmholtz-Zentrum Berlin. The sample measurements were performed using photon energies of 2005 eV and 6015 eV. All sample handling was performed in argon atmosphere to avoiding exposing the samples to atmospheric conditions. Prior to analysis the samples were removed from the pouch cells and washed by dripping 2 ml DMC slowly over the removed electrode. Samples were disassembled in our laboratory and transported to the synchrotron sealed under vacuum. The spectra presented in this work were all calibrated in binding energy against the C–C peak at 283.6 in the C 1s spectra, for samples with no visible C–C peak a secondary peak in the C 1s spectra was used.Results and discussion
Electrochemistry
In order to determine the appropriate high cut-off potentials (i.e. desodiation potential), CV test was performed on the tin phosphide electrodes using two different electrolytes; one consisting of 10 vol% FEC in EC:DEC (1:1) with 1 M NaFSI salt and the second identical but with 1 M NaPF6 salt. As can be seen in cyclic voltammograms in Fig. 1 only minor differences in currents and evolution of peak shape occur in the different electrolytes. In the first scan, a reduction peak at 0.2 V originates from the conversion of Sn4P3 to metallic tin and elemental phosphorus. In the reverse scan in the voltammogram the first oxidation peak starts at 0.45 V and can be ascribed to both phosphorous and tin but the peak probably starts with oxidation of tin 0.45 V and while also including oxidation of phosphorous at 0.65 V and above. As the cyclic voltammetry proceeds in scan 3 & 25 a cathodic peak at 0.3 V becomes more and more pronounced and this is attributed to desodiation of fully sodiated Na15Sn4 phase of tin.8,11,26 The rising current for each scan is attributed to a progressively higher conversion of tin phosphide to tin and phosphorous. The pronounced process for conversion of the material in cyclic voltammetry is likely caused by the very different particles sizes that results from the ball mill synthesis. SEM images of the pristine Sn4P3 powder (Fig. S1†) along with the low surface area of 0.96 m2 g−1 obtained from BET measurements (Fig. S2†) indicate that large particles exists in the as synthesized powder. A diffraction pattern of the pristine powder and cyclic voltammetry data containing additional cycles can be found in the ESI (Fig. S3 & S4†). For the galvanostatic cycling the conversion is completed during the first sodiation due to the much longer time at low potentials caused by the low current of 50 mA g−1 that was used.
 | ||
| Fig. 1 Cyclic voltammogram of Sn4P3vs. sodium metal using electrolytes of 1 M NaFSI (left) or NaPF6 (right) dissolved in EC:DEC (1:1) and 10 vol% FEC additive. Scan was performed between 0.01 V–2.5 V at 1 mV s−1 scan rate. | ||
The CV results show that the relevant electrochemical reactions take place below 1 V, and therefore, the low desodiation cut-off potential for experiments was set to 1.2 V as this should be sufficient to cycle the tin phosphide fully, while 2.5 V was used as the high desodiation cut-off potential to investigate the impact of the higher charging potential.
As can be seen in Fig. 2 the half-cells cycled with reduced 1.2 V cut-off potential show increased capacity retention as compared to the cell with the higher cut-off potential of 2.5 V for both NaFSI and NaPF6 even though the overall stability seems better for NaFSI salt. The behaviour of capacity increase and loss from galvanostatic cycling exhibits the same trend for high & low cut-off potential cells but the progression of the trend is significantly faster for the higher cut of potential. This shows that the sudden capacity fade is present in both cells with different salts, but it is slightly delayed when using NaFSI.
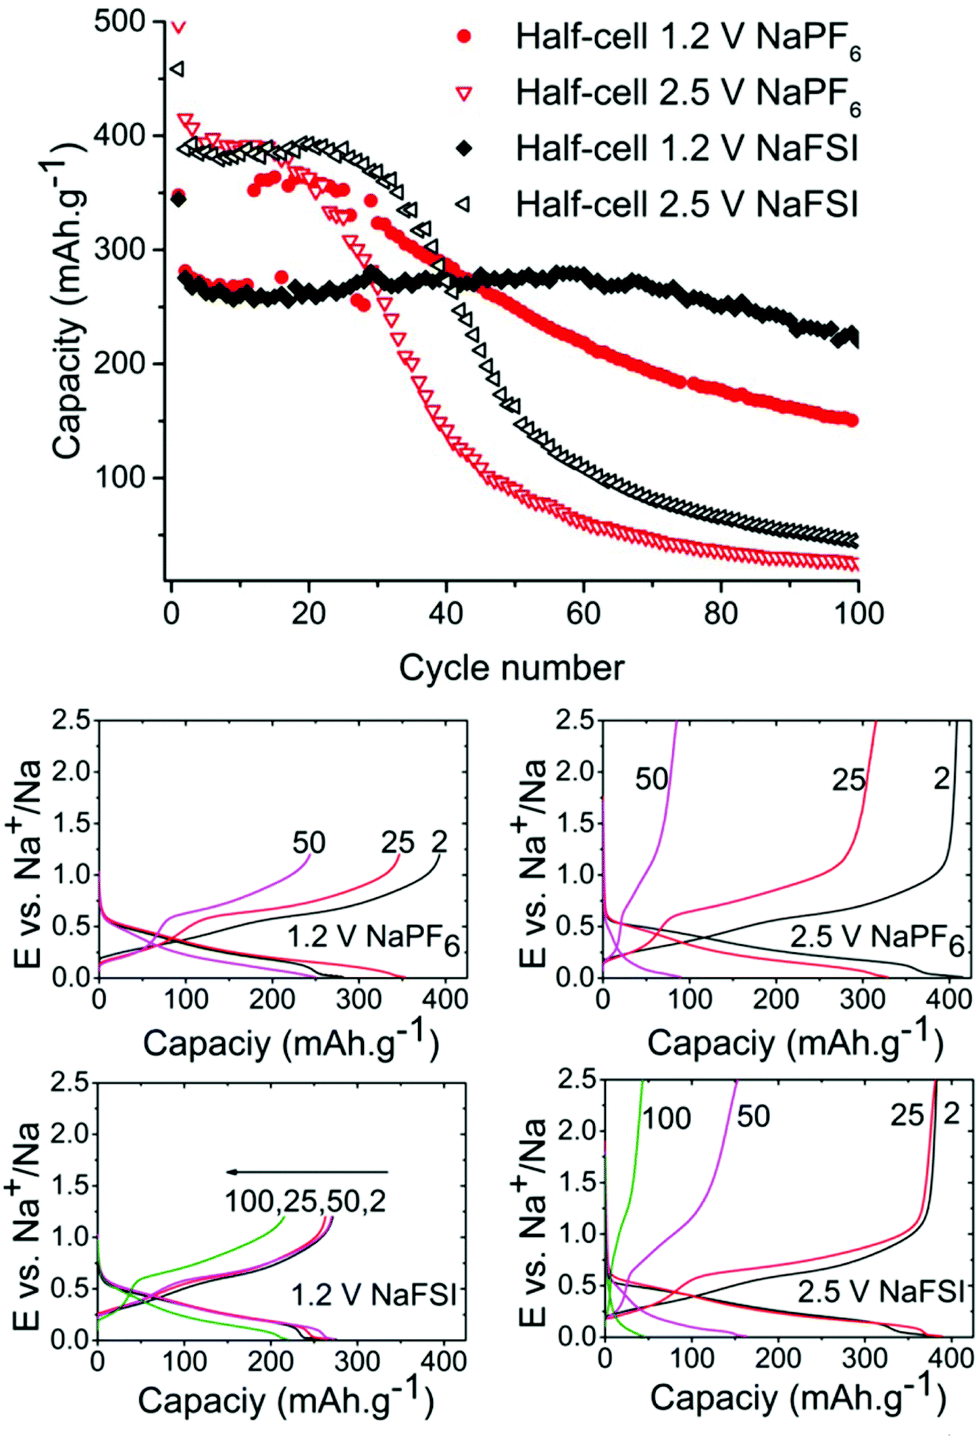 | ||
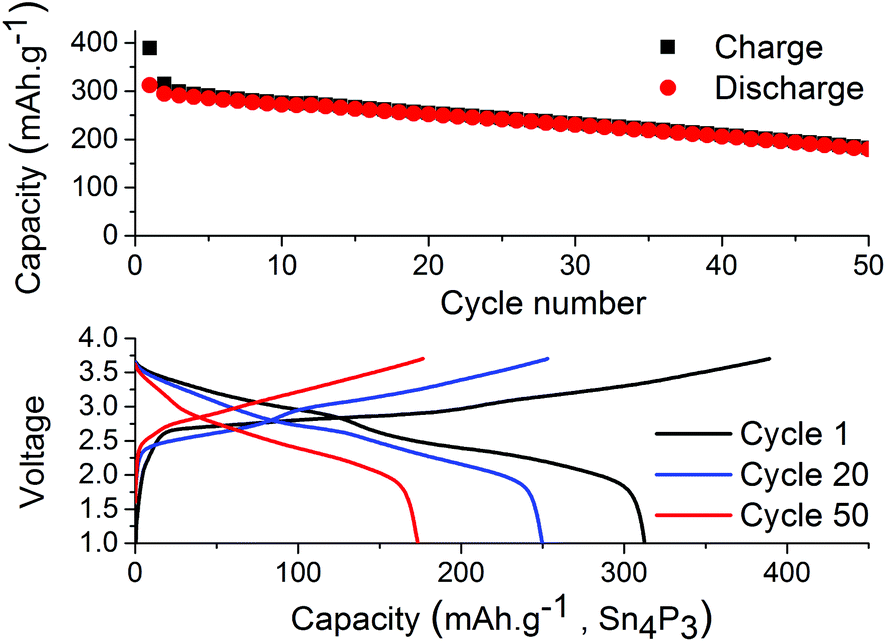
| Fig. 2 Discharge capacity from galvanostatic cycling of tin phosphide at 50 mA g−1 in half cells with NaFSI (black) & NaPF6 (red) with upper cut-off potential set to 1.2 V and 2.5 V (top). Voltage profiles for same cells at selected cycles (bottom). | ||
One hypothesis for the sharp capacity decline was electrolyte depletion since cells that were cycled for extended amounts of time appeared to be dry when opened. To investigate if the capacity drop could be attributed to electrolyte being depleted in side reactions, a cell that had undergone severe capacity fading was opened and the electrode washed with DMC and then reinserted into a new pouch cell with fresh electrolyte. However, this cell failed to regain any significant capacity showing that electrolyte depletion is not the main cause of fading. Having confirmed this, we directed our efforts to investigations of the SEI layer.
In order to determine the stability of the SEI in each electrolyte, cells were relaxed/paused at low potential of 10 mV vs. Na+/Na i.e. in a fully sodiated state (Fig. 3). Prolonged relaxation/pause is a useful technique that we have previously employed to reveal instability of SEI due to dissolution of its components.27 First, tin phosphide electrodes were cycled galvanostatically for 10 cycles to stabilize the cell and upon completion of the 10th sodiation the cell was put into a 100 hours relaxation per pause. When the pause completed, additional cycles were performed and the discrepancy of the charge capacity before and after the pause is compared to ascertain whether the SEI is continuously formed while consuming sodium from the electrode in the process. The results show that the capacity fading during the storage for the cell with NaPF6 is small; 14.5 mA h g−1 for the cell cycled to 1.2 V cut-off and 16 mA h g−1 for the cell cycled 2.5 V cut-off potential.
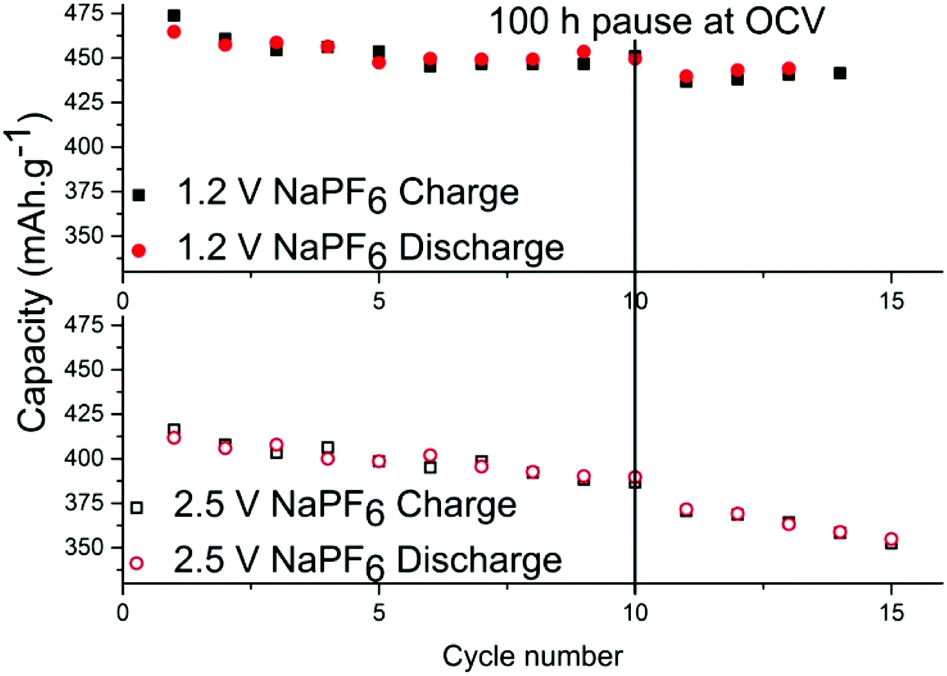 | ||
| Fig. 3 Discharge and charge capacities in tin-phosphide half-cells using NaPF6 before and after 100 h pause/relaxation. Top figure shows the results for the cell with 1.2 V high cut-off potential, and the bottom figure displays for the cell with 2.5 V high cut-off potential. | ||
However, it is clear that the SEI is only partially passivating the electrode as this corresponds to roughly 3% capacity loss in 100 hours. The same test was performed using NaFSI cycled at both cut-off potentials but the effect was so small in both cases that it is within capacity variation (Fig. S5†). While there has been much effort put into increasing the electrochemical stability at low potentials, this work like several other sources19–22 show that charging to high potentials is probably more detrimental for the cell than the discharge to low potentials.
Symmetrical and full-cells were assembled to exclude any influence of sodium metal counter electrode on the results.28,29 These cell types do not only mitigate the risk of cross-talk but also keep a better accountancy of the sodium reserve within the cell. The symmetrical cells (Fig. 4) were cycled in a 2.5 V window from −1.25 V to 1.25 V at a current density of 50 mA g−1 with respect to the electrode with the lowest mass loading. Interestingly, the results from cycling do not show any significant difference in capacity fading between the two salts although it can be noted that the symmetrical cell containing NaPF6 outperforms its high cut-off half-cell equivalent in terms of capacity retention. The results from symmetrical cells show that the apparent stability when cycling is conducted with NaFSI salt is only present when there is a significant excess of sodium (shown in Fig. 2) as the NaFSI salt appears to give no advantage in cycling with restricted amounts of sodium available. It also indicates that the Sn4P3 cells consume the sodium reserve during cycling in both NaFSI & NaPF6 based electrolytes, thus suppressing the beneficial effect of NaFSI as the rapid depletion of the available sodium mitigates the effect that is apparent in half-cells.
 | ||
| Fig. 4 Discharge capacity for symmetrical-cells with NaPF6 salt (red) and NaFSI salt (blue) over 50 galvanostatic cycles. Electrodes were cycled between −1.25 V and 1.25 V in pouch cells. | ||
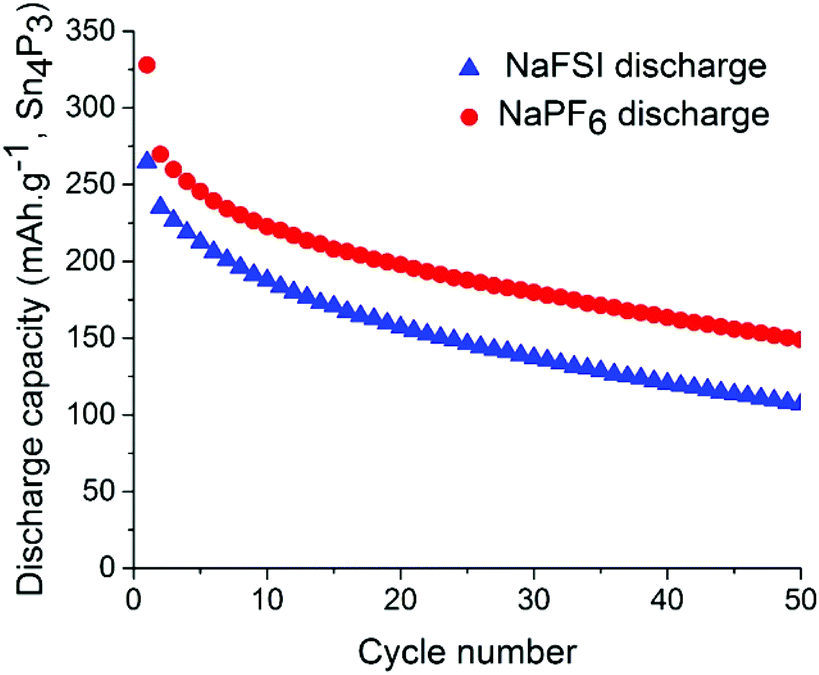
The results from full-cell shown in Fig. 5 show that the capacity fade is less than what is seen in the symmetrical cells but the sodium available in the cell is greater as well. Regarding the cathode used we provide XRD, SEM and cycling data from half-cell in the ESI in Fig. S6, S7 and S8.† Both the symmetrical cells and the full cell show a steady capacity fade but no sign of the abrupt capacity decline is visible within 50 cycles for the symmetrical cells.
 | ||
| Fig. 5 Galvanostatic cycling of tin phosphide vs. Prussian Blue using electrolyte of 1 M NaPF6 dissolved in EC:DEC (1:1) with 10 vol% FEC. The cell utilized an oversized cathode and capacity is based on the active material in the anode. | ||
HAXPES
In order to investigate if any difference in the composition of SEI and its stability results from modifying the cut-off potentials, the surface layer on tin phosphide electrodes in half-cells with NaPF6 based electrolyte were analysed using HAXPES (note that we have previously studied the composition of SEI on tin phosphide electrodes in NaFSI based electrolytes25). In Fig. 6 HAXPES spectra of cycled tin phosphide electrodes measured with photon energy of 2005 eV are compared with pristine and soaked electrodes. The desodiated samples are shown in red for the high desodiation potential of 2.5 V and in black for 1.2 V at the bottom of the figure. The corresponding measurements using 6015 eV photon energy can be found in Fig. S9 in the ESI.† In the C 1s we see changes in the relative intensities between the different SEI and electrode components. While the C–C from the carbon black can be observed at 283.6 eV for the pristine, soaked and desodiated samples, it cannot be observed in the sodiated case. This indicates that in the fully sodiated case, the SEI is so thick that it blocks the substrate signal. However, the substrate signal reappears during desodiation indicating that at least parts of the SEI is stripped off during charge. A closer look at the C 1s spectra shows that a peak attributed to –CO3 and/or C–F species appears at 290 eV during sodiation and this peak loses intensity compared to other carbon compounds when the electrode is desodiated.30,31 The results from F 1s measurements show quite clear differences between the high and low cut-off potential samples. The F 1s spectra show that after sodiation a peak from inorganic fluorides compounds appears at 685 eV. Interestingly it seems that the relative composition of fluorine containing species changes to contain more fluoride assigned to C–F and fluorophosphates when sample is charged to 2.5 V while no such effect occurs for samples charged to 1.2 V.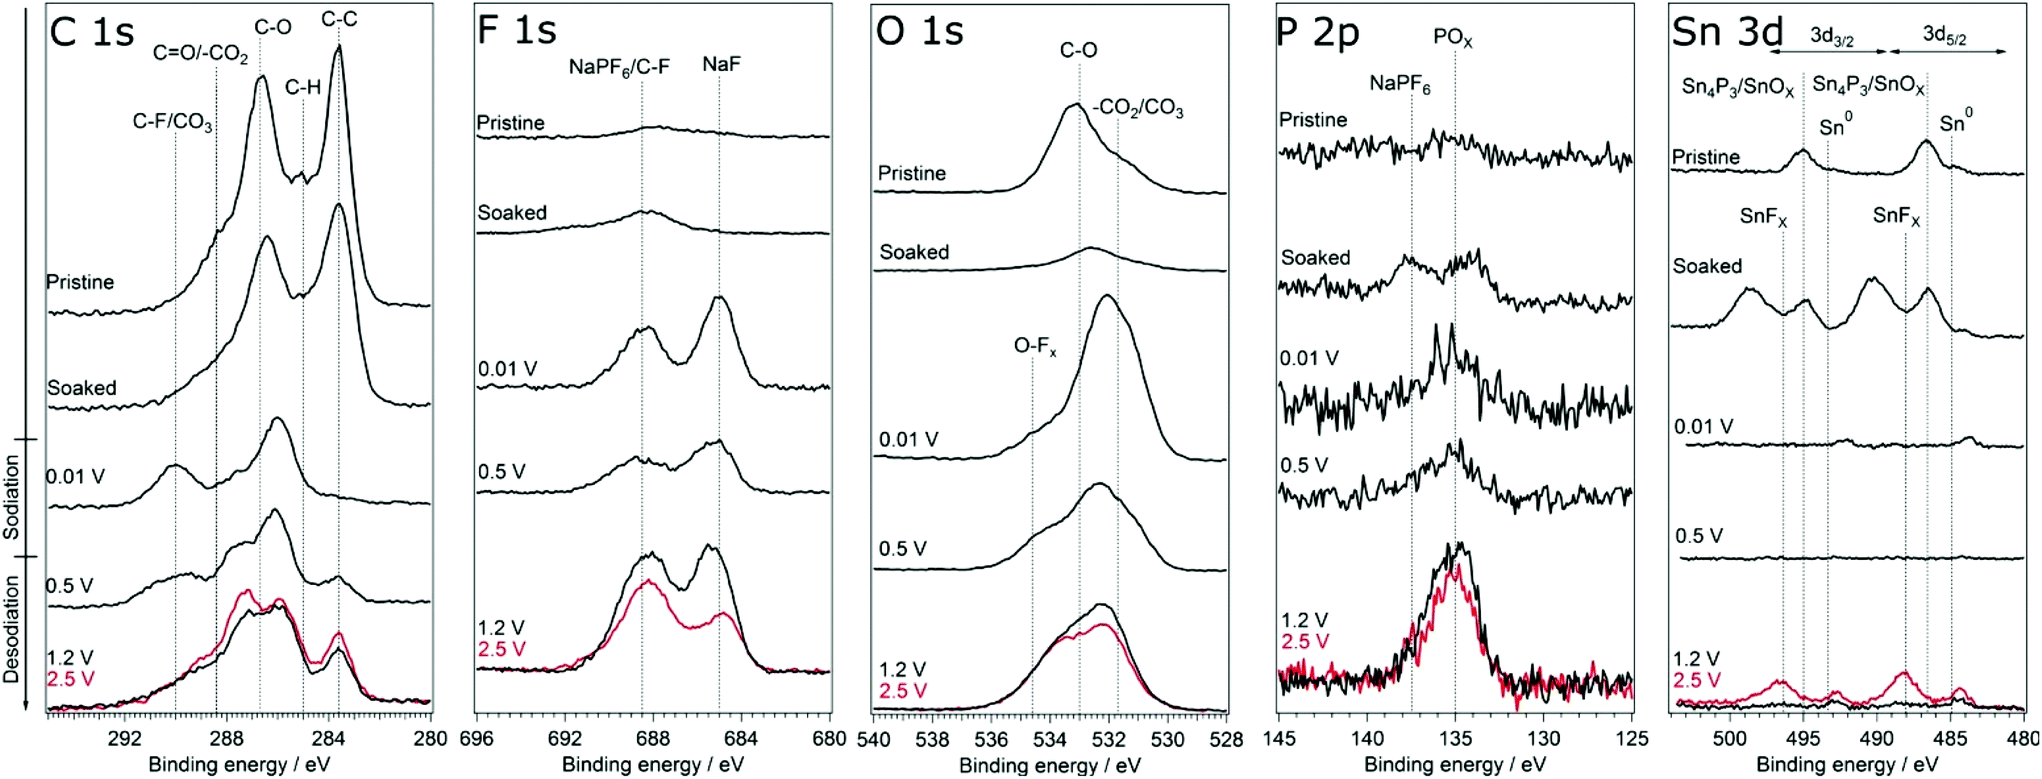 | ||
| Fig. 6 HAXPES spectra of Sn4P3 electrodes from cells with the NaPF6 based electrolyte. The spectra were measured using photon energy of 2005 eV. The samples charged to 2.5 V is shown in red. | ||
The O 1s spectra display that the composition of the SEI shifts from organic components in the CMC binder that is detectable in the pristine state to more carbonate/carboxylate species after the first sodiation where more SEI has formed. While it seems that the sample cycled with the lower charge cut-off potential has more carbonate/carboxylate species, the difference is quite small. The P 2p spectra shows almost no difference between the samples desodiated to different potentials, however, the Sn 3d spectra show a significant difference between the samples cycled with 1.2 V or 2.5 V upper cut-off potential. In case of the lower cut-off potential of 1.2 V, the intensity of Sn 3d is very low in the desodiated state. After desodiation to 2.5 V, the Sn 3d signal is much more pronounced indicating a thinner surface layer. The exact reason for the large difference in the Sn 3d intensities as compared to the corresponding C 1s spectra is unknown. However, it seems that the surface layer formed directly on the tin particles is more sensitive to higher charge voltages and dissolves or decomposes more readily.
To further elucidate the correlation between the SEI properties and capacity retention, we have plotted results from the high and low charge potential samples from this work and our previous HAXPES studies of Sn4P3 cycled in NaFSI electrolyte25 in Fig. 7. The closest resemblance is between the electrodes cycled in NaFSI desodiated to 2.5 V and NaPF6 that were desodiated to 1.2 V. The NaPF6 electrode charged to 2.5 V seems to have its SEI striped off so that the tin oxide visible in the pristine sample is either reformed or visible once again.
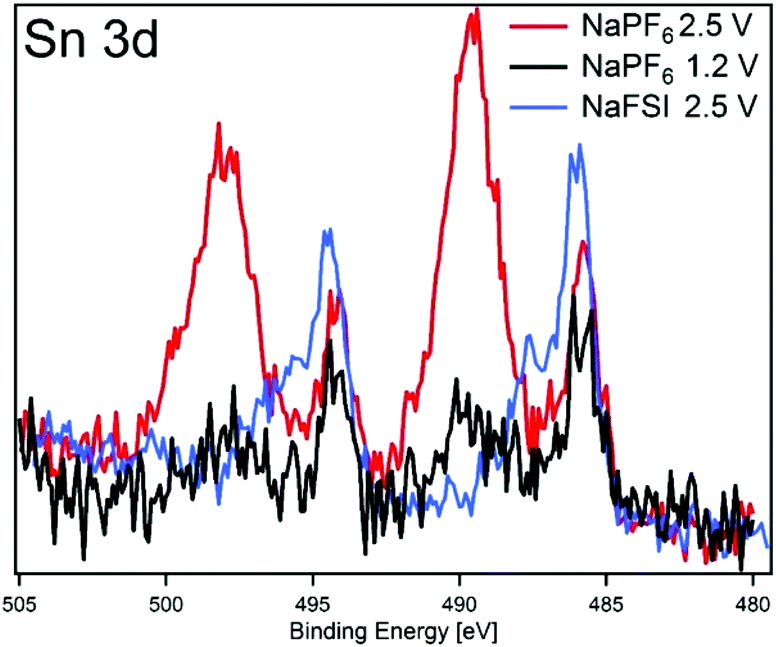 | ||
| Fig. 7 HAXPES spectra of Sn 3d orbital using photon energy of 2005 eV for: NaPF6 charged to 1.2 V (black) and 2.5 V (red) and NaFSI charged to 2.5 V (note NaFSI sample electrolyte contained 5 vol% FEC). | ||
Overall the results show that there are no drastic differences in SEI composition between the two different cycling regimes (i.e. cut-off potentials) as are apparent from the similarity of the C 1s, O 1s, and P 2p. The distinct improvement provided by the use of NaFSI over NaPF6 in half-cells points to the electrolyte as being a significant factor in capacity fading and our hypothesis is that the SEI formed around tin crystals can delay agglomeration of tin particles to some extent. This agglomeration has been previously suggested by other authors18 as a possible cause of capacity fading. The insufficient electrochemical stability of the SEI at high voltages as seen in this and previous works25 could mean that the cleaning of metal surfaces increases the likelihood of the particles to fuse together. When the capacity fading is compared between all different types of cells (Fig. 8) it can be observed that only cells cycled to 2.5 V in half-cells experience the sudden capacity drop within 50 cycles. After 50 cycles, only the voltage restricted half-cell containing NaFSI displays somewhat stable capacity retention. Fig. S10 in the ESI† shows that the capacity drop does not coincide with the accumulated discharge capacity as cells cycled in NaFSI electrolyte with 1.2 V cut-off potential delivers accumulated discharge capacity in parity with all other cell types within 50 cycles.
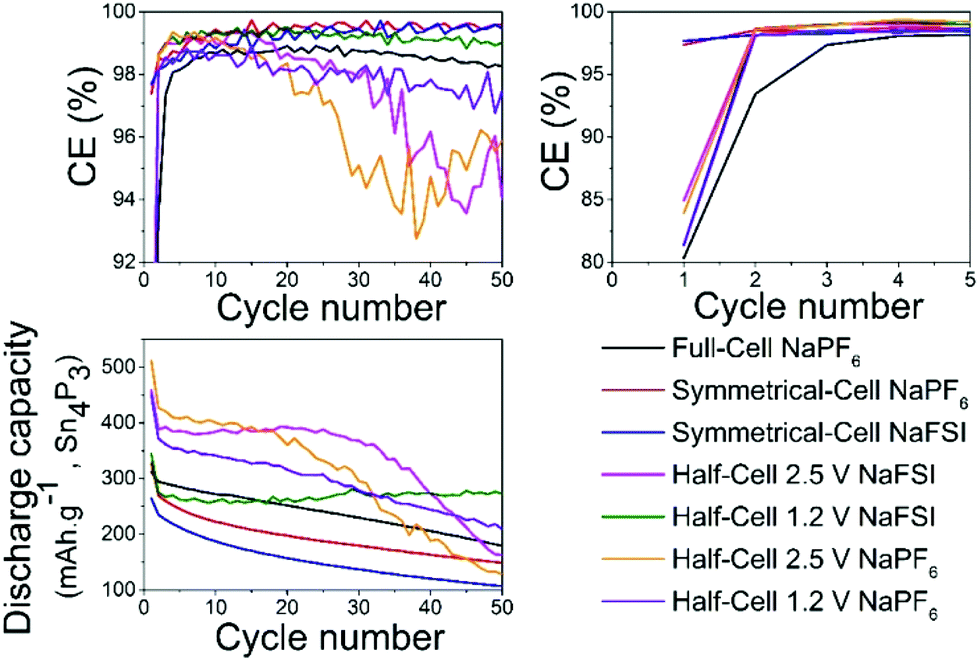 | ||
| Fig. 8 Plot shows comparisons of coulombic efficiency (top) and discharge capacity (bottom) for different salts in all the different cell types cycled between different potentials. | ||
Conclusions
The capacity retention for tin phosphide is improved by setting the desodiation potential to 1.2 V as compared to 2.5 V. The capacity retention is also better using electrolyte salt of 1 M NaFSI compared to 1 M NaPF6. Even though the half-cells cycled with low cut-off potential in 1 M NaFSI show quite good initial stability this effect seems to be lacking when the sodium reserve is restricted. HAXPES results show that NaFSI is more effective than NaPF6 in passivating the tin surface when the electrodes are desodiated at 2.5 V potential and that the SEI on tin phosphide electrodes in cells with NaPF6 is stripped from the tin particles if the desodiation potential is too high. In the cells containing NaPF6 as electrolyte salt, the tin particles appear to be more exposed and this would be disadvantageous if the aim is to inhibit agglomeration of tin particles as one potential cause of capacity fading. The more stable surface film on the tin particles and thus reduced likelihood for agglomeration could be part of the explanation for the better performance of NaFSI in long term half-cell cycling. The work performed here and by other authors shows that carbonate-based solvents in combination with either salt are not fully functional for this system but with the new results presented herein they can perhaps be improved.Conflicts of interest
There are no conflicts to declare.Acknowledgements
We are grateful to Swedish Strategic Research Program STandUp for Energy for financial support. We thank the Helmholtz-Zentrum Berlin (HZB) for the allocation of synchrotron radiation beam time.References
- M. D. Slater, D. Kim, E. Lee and C. S. Johnson, Adv. Funct. Mater., 2013, 23, 947–958 CrossRef.
- H. Chen, T. N. Cong, W. Yang, C. Tan, Y. Li and Y. Ding, Prog. Nat. Sci., 2009, 19, 291–312 CrossRef.
- G. Patry, A. Romagny, S. Martinet and D. Froelich, Energy Sci. Eng., 2015, 3, 71–82 CrossRef.
- J. McDowall, Power Eng. Soc. Summer Meet., 2001, 1, 452–455 Search PubMed.
- R. Yazami and P. Touzain, J. Power Sources, 1983, 9, 365–371 CrossRef.
- E. Irisarri, A. Ponrouch and M. R. Palacin, J. Electrochem. Soc., 2015, 162, A2476–A2482 CrossRef.
- W.-J. Zhang, J. Power Sources, 2011, 196, 13–24 CrossRef.
- J. Qian, Y. Xiong, Y. Cao, X. Ai and H. Yang, Nano Lett., 2014, 14, 1865–1869 CrossRef PubMed.
- X. Xie, D. Su, S. Chen, J. Zhang, S. Dou and G. Wang, Chem. – Asian J., 2014, 9, 1611–1617 CrossRef PubMed.
- X. Xiuqiang, C. Shuangqiang, S. Bing, W. Chengyin and W. Guoxiu, ChemSusChem, 2015, 8, 2948–2955 CrossRef PubMed.
- H. Usui, Y. Domi, K. Fujiwara, M. Shimizu, T. Yamamoto, T. Nohira, R. Hagiwara and H. Sakaguchi, ACS Energy Lett., 2017, 2, 1139–1143 CrossRef.
- Z. Li, J. Ding and D. Mitlin, Acc. Chem. Res., 2015, 48, 1657–1665 CrossRef PubMed.
- Y. Kim, Y. Kim, A. Choi, S. Woo, D. Mok, N.-S. Choi, Y. S. Jung, J. H. Ryu, S. M. Oh and K. T. Lee, Adv. Mater., 2014, 26, 4139–4144 CrossRef PubMed.
- H.-S. Shin, K.-N. Jung, Y. N. Jo, M.-S. Park, H. Kim and J.-W. Lee, Sci. Rep., 2016, 6, 26195 CrossRef PubMed.
- W. Li, S.-L. Chou, J.-Z. Wang, J. H. Kim, H.-K. Liu and S.-X. Dou, Adv. Mater., 2014, 26, 4037–4042 CrossRef PubMed.
- J. Liu, P. Kopold, C. Wu, P. A. van Aken, J. Maier and Y. Yu, Energy Environ. Sci., 2015, 8, 3531–3538 RSC.
- Y. Xu, B. Peng and F. M. Mulder, Adv. Energy Mater., 2018, 8, 1701847 CrossRef.
- W. Wang, J. Zhang, D. Y. W. Yu and Q. Li, J. Power Sources, 2017, 364, 420–425 CrossRef.
- Y.-U. Kim, C. K. Lee, H.-J. Sohn and T. Kang, J. Electrochem. Soc., 2004, 151, A933 CrossRef.
- J. Yang, Y. Takeda, N. Imanishi and O. Yamamoto, J. Electrochem. Soc., 1999, 146, 4009–4013 CrossRef.
- I. A. Courtney, J. Electrochem. Soc., 1997, 144, 2943 CrossRef.
- O. Mao, R. A. Dunlap and J. R. Dahn, J. Electrochem. Soc., 1999, 146, 405–413 CrossRef.
- J.-H. Kim, G.-J. Jeong, Y.-W. Kim, H.-J. Sohn, C. W. Park and C. K. Lee, J. Electrochem. Soc., 2003, 150, A1544 CrossRef.
- R. Retoux, T. Brousse and D. Schleich, J. Electrochem. Soc., 1999, 146, 2472–2476 CrossRef.
- R. Mogensen, J. Maibach, W. R. Brant, D. Brandell and R. Younesi, Electrochim. Acta, 2017, 245, 696–704 CrossRef.
- S. Liu, H. Zhang, L. Xu, L. Ma and X. Chen, J. Power Sources, 2016, 304, 346–353 CrossRef.
- R. Mogensen, D. Brandell and R. Younesi, ACS Energy Lett., 2016, 1, 1173–1178 CrossRef.
- L. Schafzahl, I. Hanzu, M. Wilkening and S. A. Freunberger, ChemSusChem, 2017, 10, 401–408 CrossRef PubMed.
- E. Björklund, D. Brandell, M. Hahlin, K. Edström and R. Younesi, J. Electrochem. Soc., 2017, 164, A3054–A3059 CrossRef.
- B. Philippe, M. Valvo, F. Lindgren, H. Rensmo and K. Edström, Chem. Mater., 2014, 26, 5028–5041 CrossRef.
- S. Doubaji, B. Philippe, I. Saadoune, M. Gorgoi, T. Gustafsson, A. Solhy, M. Valvo, H. Rensmo and K. Edström, ChemSusChem, 2016, 9, 97–108 CrossRef PubMed.
Footnote |
| † Electronic supplementary information (ESI) available. See DOI: 10.1039/c8dt01068d |
| This journal is © The Royal Society of Chemistry 2018 |