
 Open Access Article
 This Open Access Article is licensed under a
 Creative Commons Attribution 3.0 Unported Licence
Sr5Os3O13: a mixed valence osmium(V,VI) layered perovskite variant exhibiting temperature dependent charge distribution†
Shrikant A.
Mohitkar
a,
Jürgen
Nuss
 b,
Henning A.
Höppe
c,
Claudia
Felser
a and
Martin
Jansen
*ab
b,
Henning A.
Höppe
c,
Claudia
Felser
a and
Martin
Jansen
*ab
aMax-Planck-Institut für Chemische Physik fester Stoffe, Nöthnitzer Straße 40, 01187 Dresden, Germany. E-mail: M.Jansen@fkf.mpg.de; Fax: +49 711 689 1502; Tel: +49 711 689 1501
bMax-Planck-Institut für Festkörperforschung, Heisenbergstr. 1, 70569 Stuttgart, Germany
cInstitut für Physik, Universität Augsburg, Universitätsstr. 1, D-86159 Augsburg, Germany
First published on 26th March 2018
Abstract
New Sr5Os3O13, as synthesized from binary constituents, exhibits several uncommon features. Its crystal structure is dominated by quasi-2D poly-oxoanions that correspond to unprecedented cutouts of the perovskite type of structure, where corner sharing (OsO6) octahedra aggregate to form terraced slabs. The Os5+/Os6+ mixed valence oxide displays a particular charge ordering scheme. One osmium atom (Os1) per formula unit is in the valence state of 5+ in the whole temperature range studied, while the two remaining sites (Os2A and Os2B) show full charge disorder at high temperatures, resulting in an average charge of 5.5+. The latter, however, apparently undergo a process of continuous charge ordering at cooling. Full charge order appears to be established concomitantly with a phase transition to an antiferromagnetically ordered state at T(Néel) = 170 K. This kind of temperature dependent continuous charge ordering is reflected by structural changes with temperature as well as by changes in paramagnetic response above T(Néel). Disentangling the intimate interplay between magnetic and charge ordering degrees of freedom will require applying sophisticated spectroscopy and (neutron) diffraction techniques.
Introduction
Sr2RuO4 and Sr2IrO4, adopting the K2NiF4 type of structure, continue to be in the focus of solid state research as they represent prototypic systems displaying particular electronic structures giving rise to unconventional superconductivity in the ruthenate1 or to a Mott insulating state in the strong spin–orbit interaction limit with a J = ½ ground state in the iridate.2 Against this background, it has been perceived as quite disturbing that the corresponding osmates have remained elusive. Sr2OsO4 and Ba2OsO4 are horizontal or vertical extrapolations in the periodic table of the respective ruthenates and iridates, and thus offer promising prospects for developing similar (exotic) electronic phases.Alkaline earth oxido-osmates with osmium in octahedral coordination reported so far exhibit poly-oxoanions with various degrees of condensation of the primary OsO6 building units from monomeric (Ca3LiOsO6, Ba11Os4O24, and Sr11Os4O24),3–5 through chain-like Sr2OsO5![[thin space (1/6-em)]](https://www.rsc.org/images/entities/char_2009.gif) 6 to strands Sr7Os4O196 and finally 3D (perovskites: CaOsO3, SrOsO3, and BaOsO3; weberites: Ca2Os2O7 and Sr2Os2O7−x).7–9 So far, no 2D layered alkaline earth oxido-osmates have been encountered.
6 to strands Sr7Os4O196 and finally 3D (perovskites: CaOsO3, SrOsO3, and BaOsO3; weberites: Ca2Os2O7 and Sr2Os2O7−x).7–9 So far, no 2D layered alkaline earth oxido-osmates have been encountered.
Herein, we report on a first example of a 2D oxido-osmate anion, which, however, does not correspond to the planar tetragonal arrangement as found for the K2NiF4 type of structure, and further layered perovskite derivatives. Instead, strongly corrugated, less dense slabs are encountered. The title compound shows mixed valency with respect to osmium. Based on valence sums, calculated according to the bond length/bond strength concept,10 and calculations of the partial MAPLE values (MAPLE = Madelung Part of Lattice Energy),11–13 we suggest an assignment of oxidation states 5+ and 6+ to the respective Wyckoff sites. Crystal structure refinements on data collected at different temperatures have revealed a singular feature, namely, that the charge distribution varies continuously with temperature. This behavior is reflected by magnetic susceptibility, as well.
Experimental
Synthesis and crystal growth
Sr5Os3O13 was synthesized as a polycrystalline powder by reacting stoichiometric amounts of SrO2, SrO and OsO2 at 1273 K in an evacuated sealed quartz ampoule. SrO2 (Sigma Aldrich, 99%) and SrO (Sigma Aldrich, 99%) were used as received. Purchased OsO2 (Alfa Aesar, 83% Os) was further oxidized by heating it at 723 K in an evacuated sealed quartz ampoule in the presence of, however, not in contact with, a stoichiometric amount of PbO2, to get highly pure OsO2. A typical synthesis batch consisted of a mixture of SrO2 (196 mg), SrO (248 mg) and OsO2 (547 mg). These oxides were ground thoroughly inside a glovebox and pressed into a pellet that was placed in a corundum container and finally sealed in an evacuated quartz ampoule of approximately 2 cm diameter and 15 cm length. Single phase polycrystalline Sr5Os3O13 was obtained after 12 h of heating at 1273 K. The heating and cooling rates were kept at 100 K h−1, throughout.Single crystals of Sr5Os3O13 were obtained from the same starting materials, while applying a substantially different procedure. A physical mixture of SrO2 and SrO was placed in a corundum crucible, and OsO2 in a separate one; both these crucibles were put on the top of each other in a quartz ampoule, which was subsequently evacuated and sealed. Using the same heating treatment as for the pellet (see above), high quality crystals were grown in the crucible containing the strontium oxides. Slow gas phase transport of osmium oxide was accomplished via in situ formed volatile OsO4. The reaction products were harvested and handled in a glove box. The black blocks of Sr5Os3O13 obtained from the crystal growth experiment were collected and washed with ethanol several times.
Powder X-ray diffraction and X-ray single crystal structure determination
Laboratory powder X-ray diffraction (PXRD) (Fig. 1) studies at RT were performed using a HUBER G670 imaging plate Guinier camera with Cu-Kα1 radiation (λ = 1.5406 Å), covering a 2θ range of 5–85 degrees. Rietveld refinements were carried out with the program TOPAS-4.2.0.2 (AXS).14 The refined parameters were scale factor, zero point of θ, sample displacement (mm), background as a Chebychev polynomial of 20th degree and 1/x function, crystallite sizes, micro-strains, cell constants, atomic coordinates and thermal parameters; for more details, see the ESI (Tables SI-1 and SI-2†). | ||
| Fig. 1 A PXRD pattern of Sr5Os3O13 (cell 2, see Table 1) at RT (blue spheres: observed; red spheres: fit from Rietveld refinement; gray line: difference curve; lower black bars: positions of Bragg peaks). | ||
Crystals of Sr5Os3O13, suitable for single-crystal X-ray diffraction, were selected and mounted on a thin glass fiber. Diffraction data were collected at 295, 200, 100 and 50 K using a Bruker SMART APEX-II CCD X-ray diffractometer (Bruker AXS, Karlsruhe, Germany), equipped with an N-Helix low-temperature device (Oxford Cryosystems, United Kingdom).15 The high temperature measurement at 500 K was performed on another crystal using a SMART APEX-I diffractometer (Bruker AXS, Karlsruhe, Germany) with a Cryostream700Plus cooling device (Oxford Cryosystems, Oxford, United Kingdom, 80–500 K). Both diffractometers used Mo-Kα radiation. The reflection intensities were integrated with the SAINT subprogram in the Bruker Suite software package,16 and a multi-scan absorption correction was applied using SADABS.17 The crystal structures of Sr5Os3O13, at different temperatures, were solved by direct methods and refined by full-matrix least-squares fitting using the SHELXTL software package.18,19 The crystal data, and details of data collections and refinements are given in Table 1. Table 2 shows atomic coordinates and isotropic displacement parameters obtained for the intensity data collected at 500 and 295 K. Further details of the crystal-structure investigations, performed at 500, 295, 200, 100, and 50 K, may be obtained from the Fachinformationzentrum Karlsruhe, D-76344 Eggenstein-Leopoldshafen, Germany, on quoting the depository numbers CSD 434110 to CSD 434114 (http://www.fiz-karlsruhe.de).
| Temperature/K | 500 | 295 | 100 | 50 |
|---|---|---|---|---|
| Cell 1 | Cell 2 | Cell 2 | Cell 2 | |
| Formula weight | 1216.70 | |||
| Space group (no.), Z | Pbam (55), 2 | Pnma (62), 4 | Pnma (62), 4 | Pnma (62), 4 |
| Lattice parameters/Å | a = 14.2368(12) | 14.1814(3) | 14.1517(7) | 14.1437(12) |
| b = 7.0982(6) | 11.0263(2) | 10.9812(5) | 10.9744(9) | |
| c = 5.5369(5) | 7.0844(2) | 7.0891(3) | 7.0935(6) | |
| V/Å3 | 559.54(8) | 1107.78(4) | 1101.67(9) | 1101.04(16) |
| ρ xray/g cm3 | 7.222 | 7.295 | 7.336 | 7.340 |
| Crystal size/mm3 | 0.04 × 0.03 × 0.02 | 0.12 × 0.06 × 0.05 | 0.12 × 0.06 × 0.05 | 0.12 × 0.06 × 0.05 |
| Diffractometer | SMART APEX I | SMART APEX II, Bruker AXS | ||
| X-ray radiation, λ/Å | 0.71073 | |||
| Absorption correction | Multi-scan, SADABS | |||
| 2θ range/° | 5.72 ≤ 2θ ≤ 70.50 | 5.74 ≤ 2θ ≤ 72.82 | 5.75 ≤ 2θ ≤ 72.84 | 5.76 ≤ 2θ ≤ 72.88 |
| Index range | −22 ≤ h ≤ 23, | −23 ≤ h ≤ 23, | −23 ≤ h ≤ 23, | −9 ≤ h ≤ 23, |
| −11 ≤ k ≤ 11, | −18 ≤ k ≤ 18, | −18 ≤ k ≤ 18, | −16 ≤ k ≤ 17, | |
| −8 ≤ l ≤ 8 | −11 ≤ l ≤ 11 | −11 ≤ l ≤ 11 | −10 ≤ l ≤ 11 | |
| Reflections collected | 8553 | 20596 |
20431 |
6808 |
| Data, Rint | 1328, 0.033 | 2811, 0.039 | 2796, 0.036 | 2653, 0.025 |
| No. of parameters | 62 | 110 | 110 | 110 |
| Transmision: tmin, tmax | 0.041, 0.110 | 0.003, 0.020 | 0.003, 0.020 | 0.004, 0.021 |
| R 1 [F2 > 2σ(F2)] | 0.048 | 0.052 | 0.048 | 0.060 |
| wR(F2) | 0.022 | 0.024 | 0.023 | 0.026 |
| Extinction coefficient | 0.00073(10) | 0.00099(4) | 0.00083(3) | 0.00079(4) |
| CSD no. | 434114 | 434113 | 434111 | 434110 |
| Atom | Site | x | y | z | U eq |
|---|---|---|---|---|---|
| Cell 1 | |||||
| Os1 | 2a | 0 | 0 | 0 | 0.01183(7) |
| Os2 | 4h | 0.10918(2) | 0.33251(3) | ½ | 0.01376(6) |
| Sr1 | 2c | 0 | ½ | 0 | 0.0210(1) |
| Sr2 | 4h | 0.12391(5) | −0.17320(9) | ½ | 0.0268(1) |
| Sr3 | 4g | 0.22585(4) | 0.17024(8) | 0 | 0.0192(1) |
| O1 | 2d | 0 | ½ | ½ | 0.0411(20) |
| O2 | 4h | 0.2063(4) | 0.1611(9) | ½ | 0.0428(14) |
| O3 | 4g | 0.1251(3) | −0.1211(6) | 0 | 0.0247(9) |
| O4 | 8i | 0.0391(3) | 0.1771(5) | 0.2504(5) | 0.0339(8) |
| O5 | 8i | 0.1599(3) | 0.4734(6) | 0.2482(5) | 0.0350(9) |
| Cell 2 | |||||
| Os1 | 4a | 0 | 0 | 0 | 0.00916(5) |
| Os2A | 4c | 0.10925(2) | ¼ | 0.33953(3) | 0.00995(5) |
| Os2B | 4c | −0.10899(2) | ¼ | −0.32502(3) | 0.01002(5) |
| Sr1 | 4b | 0 | 0 | ½ | 0.0151(1) |
| Sr2A | 4c | 0.13030(4) | ¼ | −0.17090(8) | 0.0180(1) |
| Sr2B | 4c | −0.11820(4) | ¼ | 0.17622(8) | 0.0167(1) |
| Sr3 | 8d | 0.22612(3) | 0.00550(3) | 0.16978(6) | 0.01331(7) |
| O1 | 4c | −0.0104(3) | ¼ | 0.4809(5) | 0.0197(9) |
| O2A | 4c | 0.2152(3) | ¼ | 0.1810(6) | 0.0187(8) |
| O2B | 4c | −0.1990(4) | ¼ | −0.1397(7) | 0.0262(10) |
| O3 | 8d | 0.1248(2) | −0.0121(3) | −0.1219(5) | 0.0165(6) |
| O4A | 8d | 0.0490(2) | 0.1226(3) | 0.1702(5) | 0.0233(7) |
| O4B | 8d | −0.0295(2) | 0.1243(3) | −0.1844(5) | 0.0224(7) |
| O5A | 8d | 0.1531(2) | 0.1243(3) | 0.4938(5) | 0.0201(6) |
| O5B | 8d | −0.1669(2) | 0.1238(3) | −0.4517(5) | 0.0209(6) |
Determination of the true lattice basis was challenged by sets of extremely weak superstructure reflections. A first routine type data collection resulted in a unit cell with a = 14.1830(5), b = 7.0846(2), and c = 5.54143(2) Å, at room temperature (cell 1). However, the crystal structure refinement (space group Pbam) produces physically unreasonable anisotropic displacement parameters and implausible bond lengths. A second data collection applying longer exposure times indeed revealed commensurate superstructure reflections requiring doubling of the c-axis (new b-axis with setting cell 2 according to the transformation of lattice base vectors as a2, b2, c2 = a1, 2c1, b1; see Table 1). These weak superstructure reflections disappear upon heating, and the diffraction data, obtained at 500 K, can be indexed by using cell 1. The anisotropic displacement parameters obtained from the latter data set are high, but still physically meaningful (see Fig. 2(a)). The transformation of the atomic coordinates from cell 1 into cell 2 corresponds to x2, y2, z2 = x1, ½z1, y1. Due to symmetry reduction, atomic positions referring to cell 1 split accordingly to x, y, z and −x, y, −z (see Table 2, cell 1 and cell 2). The results of respective refinements based on cell 2 (space group Pnma) appear to be much more reliable for the room temperature data (see Fig. 2(b)). Nevertheless, there is still some peculiar anisotropic thermal motion of the oxygen atoms left, which cannot be resolved by further reducing symmetry (space group Pn21a), considering twinning or not. For this reason, and because a pronounced feature in magnetic susceptibility evolves at ∼170 K, further data collections were performed at 200, 100 and 50 K. Careful analyses of the diffraction data revealed a second set of very few and extremely weak additional scattering features, which would require to approximately tri- or quadruplicate the c-axis, with respect to cell 2. Unfortunately, the diffuseness of these reflections did not allow their inclusion in a refinement of a commensurate lattice. Even so, neglecting this diffuse scattering has resulted in a reasonable crystal structure refinement with physically meaningful anisotropic displacement parameters throughout, and no further splitting of atomic sites was observed down to 50 K (see Table 2 and Fig. 2(c)).
 | ||
| Fig. 2 The crystal structure of Sr5Os3O13, left: view along [0 1 0], right: view along [0 0 1], with respect to cell 2. Displacement parameters (75% probability) displayed in different layers correspond to the different temperatures given [(a)–(c)]. Slab (d) shows a respective cutout of an ideal, undistorted perovskite structure. The stacking sequence of differently oriented layers is labeled with A and B. Color code: blue, octahedra (OsO6); red, ellipsoids (O); blue, ellipsoids (Os); green, ellipsoids (Sr); orange sticks, shortest Sr–Sr distances; green sticks, margin of the unit cell 2. | ||
Physical characterization
Thermogravimetric (TGA) analysis of Sr5Os3O13 was carried out on a Netzsch STA 449 C analyzer. The sample (≈20 mg) was placed in a corundum crucible, which was heated and subsequently cooled at a rate of 5 K min−1 in the range of 25–1000 °C under dynamic Argon flow.Magnetization was measured in fields up to μ0H = 7 T using a MPMS-XL7 magnetometer (Quantum Design). The susceptibility of Sr5Os3O13 was slightly dependent on fields, indicating the presence of ferromagnetic impurity. The data were corrected applying the Honda–Owen approach (extrapolation of χ(1/H) to 0). Electrical resistivity was determined on powders pressed in a sapphire die cell with Pt contacts using the van der Pauw method and direct current. Heat capacity was measured by a relaxation method (HC option, PPMS, Quantum Design).
Results and discussion
Synthesis and chemical properties
Black, air-stable microcrystalline powders and single crystals of new Sr5Os3O13 were obtained from stoichiometric amounts of binary reactants by solid-state reactions in an evacuated sealed quartz ampoule. According to the standard oxidation states of Sr2+ and O2−, and the requirement for charge neutrality, the new osmate shows mixed-valency with an average oxidation number of 5.33+ for osmium. According to TGA, the title compound is at least stable up to 800 °C; for the figure of TGA/DTA, see the ESI (Fig. SI-1†).Crystal structure description
The crystal structure of Sr5Os3O13 was determined from single-crystal X-ray diffraction data, collected at 500, 295, 200, 100, and 50 K. A structural phase transition was observed to occur in the temperature range of 295–500 K. Sr5Os3O13 adopts two closely related crystal structures: (1) space group Pnma (no. 62), Pearson code oP84, Z = 4 at room temperature and below, and (2) space group Pbam (no. 55), Pearson code oP42, Z = 2 at 500 K.Osmium is in approximately octahedral coordination by oxygen. The primary building units OsO6 are linked via common vertices, engaging three each from the Os2A and Os2B, and four from the Os1 centered coordination polyhedra, to form plate-like poly-oxoanions of composition Os3O13, extending parallel to (001) (see Fig. 2 and 3). The local connectivity pattern is visualized in Fig. 4. Interestingly, the resulting anionic partial structure corresponds to a slab excised from the perovskite structure; however, in contrast to known perovskite related layered structures, as represented by e.g. Sr2RuO4,20 Sr3Ru2O7,20 and Sr4Rh3O10,21 the poly-anion is not planar, but terraced (see Fig. 2 and 3). The height of the stages equals the length of one OsO6 octahedron. The similarity to the perovskite pattern even comprises the strontium atoms, as is highlighted schematically in Fig. 2(d) and 5. The mutual orientation of the layered Sr5Os3O13 assemblies, however, does not follow the periodicity of the basic perovskite structure; by contrast, adjacent slabs are related by a (0![[1 with combining macron]](https://www.rsc.org/images/entities/char_0031_0304.gif) ) symmetry operation, which follows the descriptive approach of “chemical twinning”.22,23 The composition of the title compound can be easily rationalized considering the connectivity pattern as described: cleaving a regular “Sr3Os3O9” perovskite to generate the linkages of OsO6 octahedra as encountered in the title compound and completing all coordination polyhedra of osmium would leave eight oxygen atoms per formula unit in a non-bridging function. Thus, four (or 8/2) more oxygen atoms are required, while interrupting part of the strontium sublattice entails inserting two more Sr atoms; taken together, this results in a composition of Sr5Os3O13.
) symmetry operation, which follows the descriptive approach of “chemical twinning”.22,23 The composition of the title compound can be easily rationalized considering the connectivity pattern as described: cleaving a regular “Sr3Os3O9” perovskite to generate the linkages of OsO6 octahedra as encountered in the title compound and completing all coordination polyhedra of osmium would leave eight oxygen atoms per formula unit in a non-bridging function. Thus, four (or 8/2) more oxygen atoms are required, while interrupting part of the strontium sublattice entails inserting two more Sr atoms; taken together, this results in a composition of Sr5Os3O13.
 | ||
| Fig. 3 Details of the crystal structure of Sr5Os3O13 at 295 K, showing one octahedral layer along different directions of view. The differently colored polyhedra (yellow, red, and blue) emphasize OsO6 octahedra of different heights (steps of a staircase). Atoms with the same color code as in Fig. 2. | ||
 | ||
| Fig. 4 A cutout of the crystal structure of Sr5Os3O13, emphasizing the connectivity pattern of the OsO6 octahedra. The same color code as in Fig. 3. | ||
 | ||
| Fig. 5 A perspective view of a cutout of an ideal, undistorted perovskite structure, emphasizing the “staircase-like” topology of one Sr5Os3O13 layer; see also Fig. 2(d). | ||
In Fig. 2, we illustrate the structural changes occurring along with charge ordering. The phase transition proceeds diffusionless, and the structural relaxation mainly consists of slight shifts of the oxygen atoms, resulting in combined tilting and breathing motions of the OsO6 octahedra. The slabs labelled (a), (b), and (c) represent the refinement results obtained at 500 K, 295 K, and 50 K, respectively. The amplitudes of anisotropic thermal motion of the oxygen atoms are large at 500 K (cell 1), while the structure “locks in” at lower temperatures ((b) and (c) in Fig. 2). Front and back stacked octahedra are no longer superimposed, meaning that the octahedra are slightly rotated around the b-axis (viewing direction, Fig. 2, left). In addition, they slightly turn out of the a–c plane. The reorientation pattern of the corner-sharing OsO6 octahedra thus corresponds to a two-tilt system with rotations of about ±5° in both directions.
From the overall composition follows that the title compound is mixed-valent with respect to osmium. Formally, two distributions of oxidation states would apply, 2 × Os6+/1 × Os4+ or 2 × Os5+/1 × Os6+, where the latter appears to be more plausible because of the smaller spread of charges. In general, metal oxygen bond lengths would allow for suggesting a charge distribution. However, in the present case, the varying numbers of coordinating oxygen atoms in different structural functions—bridging or terminal—obscure the effect of charge differences among the osmium atoms. Moreover, the ionic radii24 for Os5+ and Os6+ differ by just 0.03 Å for coordination number VI. Still, the average Os–O bond lengths (50 K data), amounting to 1.96, 1.95, and 1.92 Å for Os1, Os2A, and Os2B, respectively, are in the same range as reported in the literature,6–9 and comply with the sum of the ionic radii.24 However, based on atomic distances (Table 3) alone it does not appear possible to assign oxidation states to individual osmium sites.
| Atomic contact | Distance @500 K | Multi. | Distance @295 K | Multi. | Distance @50 K | Multi. | |
|---|---|---|---|---|---|---|---|
| Os1 | –O4A | 1.953(3) | ×4 | 1.940(3) | ×2 | 1.935(4) | ×2 |
| C.N. 6 | –O4B | — | 1.965(3) | ×2 | 1.970(4) | ×2 | |
| –O3 | 1.977(4) | ×2 | 1.974(3) | ×2 | 1.981(4) | ×2 | |
| Os2A | –O5A | 1.862(3) | ×2 | 1.871(3) | ×2 | 1.879(4) | ×2 |
| C.N. 6 | –O2A | 1.841(5) | ×1 | 1.876(4) | ×1 | 1.897(5) | ×1 |
| –O1 | 1.957(1) | ×1 | 1.971(4) | ×1 | 1.984(5) | ×1 | |
| –O4A | 2.030(3) | ×2 | 2.035(3) | ×2 | 2.020(4) | ×2 | |
| Os2B | –O2B | — | 1.831(5) | ×1 | 1.842(5) | ×1 | |
| C.N. 6 | –O5B | — | 1.848(3) | ×2 | 1.835(4) | ×2 | |
| –O1 | — | 1.961(4) | ×1 | 1.961(5) | ×1 | ||
| –O4B | — | 2.021(3) | ×2 | 2.010(4) | ×2 | ||
| Sr1 | –O5A | 2.666(4) | ×4 | 2.567(3) | ×2 | 2.547(4) | ×2 |
| C.N. 12 | –O4B | 2.736(4) | ×4 | 2.674(4) | ×2 | 2.679(4) | ×2 |
| –O5B | — | 2.754(3) | ×2 | 2.741(4) | ×2 | ||
| –O1 | 2.769(1) | ×2 | 2.764(1) | ×2 | 2.754(1) | ×2 | |
| –O4A | — | 2.788(4) | ×2 | 2.807(5) | ×2 | ||
| –O3 | 3.226(4) | ×2 | 3.213(3) | ×2 | 3.200(4) | ×2 | |
| Sr2A | –O4B | 2.701(4) | ×2 | 2.640(3) | ×2 | 2.627(4) | ×2 |
| C.N. 11 | –O2B | 2.647(7) | ×1 | 2.768(5) | ×1 | 2.734(5) | ×1 |
| –O2A | 2.689(7) | ×1 | 2.769(5) | ×1 | 2.810(5) | ×1 | |
| –O5A | 2.915(4) | ×2 | 2.769(4) | ×2 | 2.750(4) | ×2 | |
| –O3 | 2.793(1) | ×2 | 2.912(3) | ×2 | 2.913(4) | ×2 | |
| –O4A | 3.090(4) | ×2 | 3.023(4) | ×2 | 3.024(5) | ×2 | |
| –O1 | 2.915(1) | ×1 | 3.173(5) | ×1 | 3.198(5) | ×1 | |
| Sr2B | –O2B | — | 2.514(5) | ×1 | 2.495(5) | ×1 | |
| C.N. 11 | –O2A | — | 2.570(4) | ×1 | 2.545(5) | ×1 | |
| –O1 | — | 2.645(5) | ×1 | 2.624(5) | ×1 | ||
| –O3 | — | 2.653(3) | ×2 | 2.621(3) | ×2 | ||
| –O4A | — | 2.756(3) | ×2 | 2.761(4) | ×2 | ||
| –O5B | — | 3.060(3) | ×2 | 3.112(4) | ×2 | ||
| –O4B | — | 3.152(4) | ×2 | 3.118(4) | ×2 | ||
| Sr3 | –O3 | 2.517(5) | ×1 | 2.525(3) | ×1 | 2.527(4) | ×1 |
| C.N. 10 | –O5B | 2.547(3) | ×2 | 2.528(3) | ×1 | 2.517(4) | ×1 |
| –O5A | — | 2.557(3) | ×1 | 2.544(4) | ×1 | ||
| –O3 | 2.589(4) | ×1 | 2.589(3) | ×1 | 2.571(4) | ×1 | |
| –O5B | 2.721(4) | ×2 | 2.594(3) | ×1 | 2.590(4) | ×1 | |
| –O2A | 2.783(1) | ×2 | 2.702(1) | ×1 | 2.681(1) | ×1 | |
| –O4A | 2.999(4) | ×2 | 2.825(3) | ×1 | 2.795(4) | ×1 | |
| –O5A | — | 2.839(3) | ×1 | 2.850(4) | ×1 | ||
| –O2B | — | 2.851(1) | ×1 | 2.843(1) | ×1 | ||
| –O4B | — | 3.152(3) | ×1 | 3.163(4) | ×1 | ||
| Angle | Degree @500 K | Multi. | Degree @295 K | Multi. | Degree @50 K | Multi. |
|---|---|---|---|---|---|---|
| Os2A–O1–Os2B | 180 | ×1 | 166.0(3) | ×1 | 164.2(3) | ×1 |
| Os1–O4A–Os2A | 166.7(2) | ×1 | 176.0(2) | ×1 | 177.5(2) | ×1 |
| Os1–O4B–Os2B | — | 157.6(1) | ×1 | 157.3(2) | ×1 |
Calculations based on the MAPLE concept11–13 have proved to be a valuable tool for tracking charge distributions on a semi-quantitative level, and, moreover, for checking structure models for electrostatic reasonability. A structure model of e.g. a ternary oxide is considered as electrostatically consistent if the sum of MAPLE values of the respective binary constituents deviates from the MAPLE value of the ternary by less than 1%. Based on this well-confirmed observation, MAPLE values even for hypothetic binary oxides can be extracted from well characterised, electrostatically consistent compounds. For assessing the title compound, reference values for the hypothetical polymeric oxides “OsO3” and “Os2O5” were obtained according to the equations [MAPLE(“OsO3”) = MAPLE(Na2OsO4) − MAPLE(Na2O)] and [MAPLE(“Os2O5”) = MAPLE(Ca2Os2O7) − 2MAPLE(CaO)] from published experimental data.25–29
The results of our calculations confirm that the structure models are electrostatically consistent within the framework of the MAPLE concept (Table 4). Furthermore, the assignment of charges to atomic positions has been evaluated by considering their partial MAPLE* values and comparing those with typical values found for reference materials. According to examples taken from the literature, Os(IV) ions exhibit average MAPLE values of 2048 kcal mol−1, Os(V) average MAPLE of 2995 kcal mol−1 and Os(VI) ions average MAPLE of 3996 kcal mol−1. The respective charge-independent MAPLE* values (MAPLE* = MAPLE/charge2) average to 118.5 kcal mol−1. Performing MAPLE calculations on the aforementioned scenarios of charge distributions over the three osmium sites indicated a more pronounced differentiation in charges in the sense of enhanced charge ordering below 200 K compared to the structure models refined using the 295 and 500 K data, respectively (Table 4). Taking into account all these factors we conclude that Os1 carries a formal charge of +5 within the full temperature range studied. The atomic parameters resulting from refinements based on intensity data collected at 200, 295 and 500 K reflect an equal charge distribution on osmium sites Os2A, Os2B, and Os2, respectively, where an average charge of +5.5 yields the best charge distribution model. At 50 and 100 K, Os2A and Os2B apparently “disproportionate”, with Os2B approaching +6 and Os2A +5. Even considering the limitations of the MAPLE concept and the slight deficiency in the crystal structure determination, these results suggest assigning an oxidation state of 5+ to Os1 below and above T(Néel), while for Os2A and Os2B 5+/6+ charge disorder prevails above. Below ∼150 K, clear signatures for charge ordering into 6+ for Os2B and 5+ for Os2A have been obtained. The bond valence sums calculated are in correspondence with these assignments, resulting in BVS of 4.97, 5.17 and 5.97 for Os1, Os2B and Os2A, respectively (Table SI-3a, b and c†).
| 50 K | 100 K | 200 K | 295 K | 500 K | |
|---|---|---|---|---|---|
| MAPLE (Sr5Os3O13) | 82901 kJ mol−1 |
82984 kJ mol−1 |
82828 kJ mol−1 |
82669 kJ mol−1 |
82746 kJ mol−1 |
| (Δ = 0.29%) | (Δ = 0.30%) | (Δ = 0.38%) | (Δ = 0.57%) | (Δ = 0.48%) | |
| Os1 | +5 (116.6) | +5 (116.6) | +5 (117.0) | +5 (117.1) | +5 (117.1) |
| Os2A | ≈5 (119.6) | ≈5 (119.8) | +5½ (117.0) | +5½ (117.2) | +5½ (118.6) |
| Os2B | ≈6 (117.3) | ≈6 (117.1) | +5½ (119.6) | +5½ (119.4) | |
| rms dev. (MAPLE*) | 0.8 | 0.9 | 0.8 | 0.7 | 0.5 |
| 5MAPLE(SrO) + MAPLE(“Os2O5”) + MAPLE(“OsO3”) | 83144 kJ mol−1 |
||||
Magnetic and thermal properties
The thermally quite stable title compound, Sr5Os3O13, is a semiconductor displaying a resistivity of about 10 Ωcm under ambient conditions and a significant band gap of approximately Ea = 130 meV as obtained from an Arrhenius type fit of the high temperature regime only. The full range temperature dependence of electronic conductivity can be fairly fitted by applying the variable range hopping model (see Fig. 6). Against this background, it appears adequate to analyse the magnetic properties in terms of basically localized magnetic moments. The χ(T) trace (Fig. 7) shows a pronounced indication for the onset of antiferromagnetic (afm) ordering at T(Néel) = 170 K, which is reflected by a respective feature in the specific heat (Fig. 8), as well. However, the paramagnetic branch of χ(T) above TN shows an atypical behavior. Falling below the expected hyperbolic trend, the paramagnetic response appears to be suppressed, and only above about ∼340 K it approaches values and a track that would allow one to apply the Curie–Weiss law. This observation suggests that on average the contributing local magnetic moments vary with temperature, which would parallel the continuous process of charge ordering as observed via the structural evolution with temperature. For an apparently concomitant evolution of the magnetic ground state with temperature we see three possible explanations: (1) the temperature dependent charge distribution is not restricted to a fixed ratio of Os5+ and Os6+, but may include varying shares of Os4+, (2) the splitting of d states as affected by a ligand field, spin–orbit coupling and Hund's coupling varies with temperature or is in the range of kT, or (3) above T(Néel) a part of the afm coupling initially survives and fades away at increasing temperature. Based on the results of crystal structure analyses at different temperatures, we exclude scenario (1). From the 5d3 and 5d2 electron configurations of Os5+ and Os6+, respectively, t2g3eg0 and t2g2eg0 based states would result in ideal octahedral coordination, where the t2g levels on their part may split due to strong spin–orbit coupling into partly filled j = 3/2 and empty j = 1/2 shells, while alternatively for Os5+, in the sense of a high spin arrangement, all t2g orbitals can be occupied by a single electron, as well. Further considering the actually low symmetry of the ligand fields, it is obvious that the resulting term schemes will be quite complex, which would principally admit an explanation according to (2). From the crystal structure it is evident that there is a range of competing magnetic exchange paths, and thus magnetic ordering may occur at different temperatures for the different substructures, and thus explanation according to (3) may be valid as well. Evidently, for solving this puzzle, follow-up experimental studies are required, in the first place high resolution electron spectroscopy and neutron diffraction, which in addition would be quite suited to shed more light into the charge ordering processes.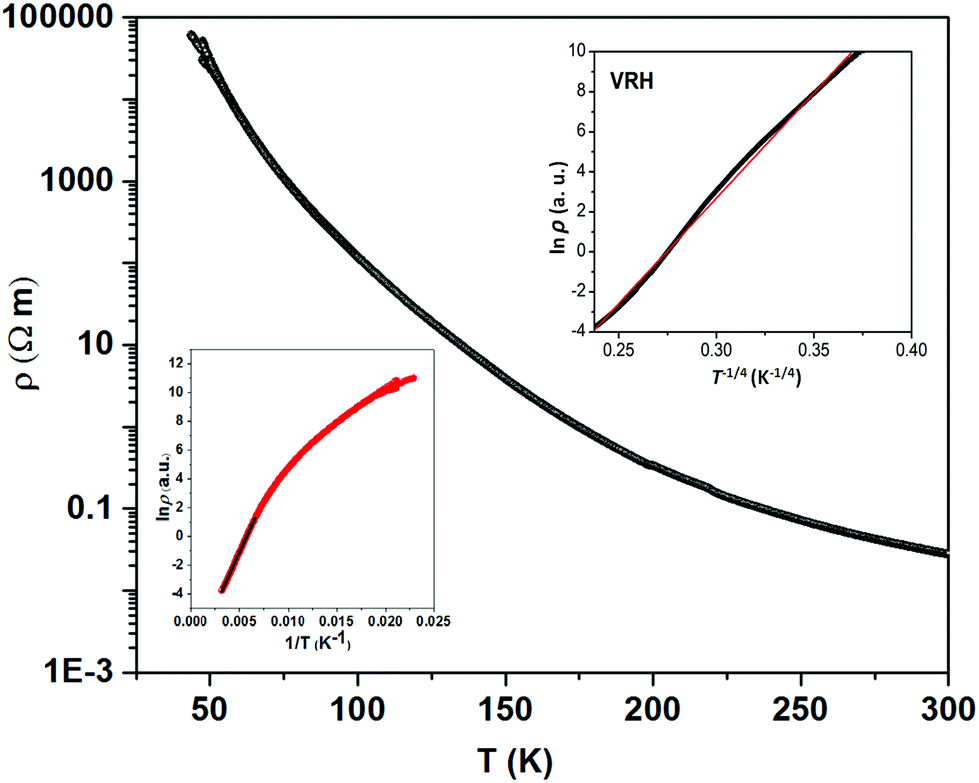 | ||
| Fig. 6 Temperature dependence of the electric resistivity of polycrystalline Sr5Os3O13. The insets show the Arrhenius plot (left bottom) and variable range hopping plot (right top) with the best-fit lines. | ||
 | ||
| Fig. 7 Temperature dependence of the magnetic susceptibility χ (spheres) and of the inverse magnetic susceptibility χ−1 (circles) for Sr5Os3O13 measured in magnetic fields of μ0H = 3.5 T (red, cooling mode) and 7.0 T (black, warming mode). | ||
 | ||
| Fig. 8 Temperature dependence of specific heat divided by temperature, Cp/T, for Sr5Os3O13. The specific heat data are per mol of Os. The inset shows the same data Cp/T as a function of T2 for temperatures T < 10 K. | ||
Conclusions
Sr5Os3O13, which was prepared by reacting the binary constituent oxides in sealed quartz ampoules, constitutes another member of perovskite derived multinary oxides. An (Os3O13)10− polyanion evolves a singular connectivity pattern of octahedra, resulting in quasi-2D corrugated slabs. Similar to comparable multinary oxides of 5d transition elements, the electronic properties of the new mixed-valency oxide are controlled by an intricate interplay of the local effects of ligand field splitting, spin–orbit coupling and Hund's coupling, which are energetically in the same order of magnitude, and in addition by collective phenomena of charge, spin and orbital ordering. Noteworthy, the charge ordering within the title compound appears to occur over a wide temperature range, which is a rare observation. Against this background it is well understandable that complex ordering processes take place and that it is difficult to unambiguously reveal the electronic and magnetic groundstates. The qualitative explanations discussed need to be confirmed experimentally, using state of the art diffraction techniques and spectroscopy.Conflicts of interest
There are no conflicts to declare.Acknowledgements
We thank Dr. Walter Schnelle and Ralf Koban for performing magnetization, electronic conductivity and specific heat measurements. Open Access funding provided by the Max Planck Society.References
-
(a) R. Matzdorf, Z. Fang, Ismail, J. Zhang, T. Kimura, Y. Tokura, K. Terakura and E. W. Plummer, Science, 2000, 289, 746–748 CrossRef CAS PubMed
; (b) C. Bergemann, A. P. Mackenzie, S. R. Julian, D. Forsythe and E. Ohmichi, Adv. Phys., 2003, 52(7), 639–725 CrossRef CAS
-
(a) I. V. Solovyev, V. V. Mazurenko and A. A. Katanin, Phys. Rev. B: Condens. Matter Mater. Phys., 2015, 92, 235109 CrossRef
- Y. Shi, Y. Guo, S. Yu, M. Arai, A. Sato, A. A. Belik, K. Yamaura and E. T. Muromachi, J. Am. Chem. Soc., 2010, 132, 8474–8483 CrossRef CAS PubMed
- M. Wakeshima and Y. Hinatsu, Solid State Commun., 2005, 136, 499–503 CrossRef CAS
- A. Tomaszewska and H. Muller-Buschbaum, Z. Anorg. Allg. Chem., 1993, 419, 1738–1742 CrossRef
- S. A. Mohitkar, W. Schnelle, C. Felser and M. Jansen, Inorg. Chem., 2016, 55, 8201–8206 CrossRef CAS PubMed
-
(a) R. F. Sarkozy and B. L. Chamberland, Mater. Res. Bull., 1993, 8, 1351–1360 CrossRef
- J. Reading, C. S. Knee and M. T. Weller, J. Mater. Chem., 2002, 12, 2376–2382 RSC
- I. S. Shaplygin and V. B. Lazarev, Thermochim. Acta, 1979, 33, 225–229 CrossRef CAS
-
(a) I. D. Brown and R. D. Shannon, Acta Crystallogr., Sect. A: Found. Crystallogr., 1973, 29, 266–282 CrossRef CAS
- R. Hoppe, Angew. Chem., Int. Ed. Engl., 1966, 5, 95–106 CrossRef CAS
- R. Hoppe, Angew. Chem., Int. Ed. Engl., 1970, 9, 25–34 CrossRef CAS
-
R. Hübenthal, MAPLE, Program for the Calculation of the Madelung Part of Lattice Energy, 1993 Search PubMed
-
TOPAS-V4.2.0.2: General Profile and Structure Analysis Software for Powder Diffraction Data, Bruker AXSGmbh, Karlsruhe, Germany Search PubMed
- G. Cakmak, J. Nuss and M. Jansen, LiB6O9F, the First Lithium Fluorooxoborate-Crystal Structure and Ionic Conductivity, Z. Anorg. Allg. Chem., 2009, 635, 631–636 CrossRef CAS
-
Bruker Suite, version 2013/1, Bruker AXS Inc., Madison, WI, 2013 Search PubMed
-
G. M. Sheldrick, SADABS —Bruker AXS area detector scaling and absorption, version 2012/1, University of Göttingen, Germany, 2012 Search PubMed
- G. M. Sheldrick, Short History of SHELX, Acta Crystallogr., Sect. A: Found. Crystallogr., 2008, 64, 112–122 CrossRef CAS PubMed
- G. M. Sheldrick, Crystal Structure Refinement with SHELXL, Acta Crystallogr., Sect. C: Struct. Chem., 2015, 71, 3–8 CrossRef PubMed
- H. Müller-Buschbaum and J. Wilkers, Z. Anorg. Allg. Chem., 1990, 591, 161–166 CrossRef
- K. Yamaura, Q. Huang, D. P. Young and E. T. Muromachi, Chem. Mater., 2004, 16, 3428–3430 CrossRef
-
B. G. Hyde and S. Andersson, Inorganic Crystal Structures, John Wiley & Sons, New York, 1989 Search PubMed
- F. Zürcher, S. Wengert and R. Nesper, Inorg. Chem., 1999, 38, 4567–4569 CrossRef
- R. D. Shannon, Acta Crystallogr., Sect. A: Cryst. Phys., Diffr., Theor. Gen. Crystallogr., 1976, 32, 751–767 CrossRef
- O. J. Rutt, G. R. Williams and S. J. Clarke, Chem. Commun., 2006, 2869–2871 RSC
- S. F. Matar, G. Demazeau and N. Ouaini, J. Solid State Chem., 2010, 183, 402–407 CrossRef
- Yu. N. Zhuravlev and O. S. Obolonskaya, Zh. Strukt. Khim., 2010, 51, 1005–1013 CAS
- J. Reading, C. S. Knee and M. T. Weller, J. Mater. Chem., 2002, 12, 2376–2382 RSC
- Q. Huang, O. Chmaissem, J. J. Caponi, C. Chaillout, M. Marezio, J. L. Tholence and A. Santoro, Physica C, 1994, 227, 1–9 CrossRef CAS
Footnote |
| † Electronic supplementary information (ESI) available. See DOI: 10.1039/c8dt00528a |
| This journal is © The Royal Society of Chemistry 2018 |