
 Open Access Article
 This Open Access Article is licensed under a
 Creative Commons Attribution 3.0 Unported Licence
Sequential ionic layer adsorption and reaction (SILAR) deposition of Bi4Ti3O12 on TiO2: an enhanced and stable photocatalytic system for water purification†
Gylen
Odling
a,
Efthalia
Chatzisymeon
b and
Neil
Robertson
 *a
*a
aSchool of Chemistry, University of Edinburgh, Joseph Black Building, David Brewster Road, Edinburgh, EH9 3FJ, UK. E-mail: n.robertson@ed.ac.uk
bSchool of Engineering, Institute for Infrastructure and Environment, University of Edinburgh, Edinburgh, EH9 3JL, UK
First published on 15th January 2018
Abstract
A new method to produce bismuth titanate – titanium dioxide composites by modification of a TiO2 film deposited on a variety of different glass substrates is reported. Using a simple SILAR method, BiOBr may be deposited upon TiO2 surfaces, which upon heating forms a closely intercalated structure of bismuth titanate (Bi4Ti3O12, BTO) and TiO2. This new method expands the scope of the SILAR process, which is typically restricted to materials which can be formed from soluble precursors. This composite material has undergone a thorough materials characterisation to confirm the absence of the BiOBr precursor, and the formation of the new bismuth titanate phase. The electronic structure of the heterojunction formed has also been investigated by valence band XPS and diffuse reflectance measurements, and a plausible band structure proposed. The immobilised composites have then been applied to the photocatalytic degradation of organic pollutants and bactericidal testing, as well as stability tests and identification of the key reactive species. Further photocatalytic studies have been carried out on this material in a synthetic wastewater medium, taking a step towards application under real-world conditions.
Introduction
The availability of clean water has been identified as one of the United Nations' global goals for sustainable development.1 The provision of this basic resource for a rapidly growing global population poses significant challenges, namely the extreme low cost and lack of extensive infrastructure required to be viable in the developing world. Semiconductor photocatalysis has the potential to fit this niche well, particularly when operated using freely available sunlight. Indeed, it is often the regions of the globe worst affected by poor water quality that have reliable sunshine over much of the year.2 Through the generation of reactive species, semiconductor photocatalysis has been proven to be effective in the destruction of organic pollutants3 and bacteria.4,5 For this purpose, titanium dioxide (TiO2) is a material which is subject to considerable attention6,7 due to the high natural abundance of its constituent elements in the earth's crust,8 low cost9 and low toxicity.10 However, due to the wide band gap of 3–3.2 eV, the use of TiO2 under solar irradiation is limited to the UV portion of the spectrum (∼5%). In addition, recombination of photo-generated charges has been found to be orders of magnitude faster than surface reactions,11,12 causing most of the photo-excited holes and electrons to recombine before being able to generate any useful species. One method by which TiO2 can be given both visible light activity and a mechanism to allow charges to separate is to form a heterojunction with another, narrower band gap semiconductor.13 The narrower band gap allows excitation by visible light, and the interface between the two materials allows charges to be separated in space and therefore recombination is hindered. Bismuth based semiconductors have been suggested as potential materials for this purpose due to the low cost and low toxicity of bismuth. Of interest are the Aurivillius structured bismuth containing semiconductors such as Bi2O3,14 Bi2MoO6,15 Bi2WO6 (ref. 16) and Bi4Ti3O12.17 These materials are characterised by their layered structure with perovskite layers of (An−1BnO3n+1)2− sandwiched between layers of bismuth oxide (Bi2O2)2+.18 Such materials have been proven to have interesting luminescent, dielectric and ion conductive properties,19 but have rarely been combined with TiO2 for photocatalytic purposes to date.While materials development is an important step in producing high efficiency photocatalysts, of equal importance is overcoming the implementation hurdles associated with photocatalytic water purification,20 which are often overlooked in the literature.21 Particularly, the recovery of the photocatalyst poses a problem due to the nanoparticulate nature of most photocatalysts. If un-recovered, photocatalyst losses will reduce activity, and in addition it has been found that while materials such as TiO2 are largely regarded as non-toxic, they may exhibit toxic effects when present at nanoscale sizes.22 In a laboratory setting centrifugation is used to remove materials from water post-use, which is likely to be impossible in areas of the planet where electrification is not available or not reliable. Therefore, immobilisation of the photocatalyst onto an easily separable support is key in producing a usable photocatalyst for some of the poorer areas of the planet.
Herein is reported the formation of a composite photocatalyst comprised of the Aurivillius semiconductor Bi4Ti3O12 (BTO) and TiO2. Using TiO2 immobilised on glass substrates as a basis, we apply a sequential ionic layer adsorption reaction (SILAR) method to introduce a BiOBr precursor. Upon heating, we have discovered that this BiOBr precursor is converted to BTO along with the concurrent loss of Br. Recently, Zhang et al. demonstrated a similar modification by epitaxial growth of BTO on the anatase TiO2 [001] surface.23 This was achieved by hydrothermal modification of anatase with exposed [001] facets with Bi(NO3)3. However, to date this conversion from BiOBr to BTO has not been reported, and represents something of an anomaly in preparation of more complex semiconductors by SILAR. Typically, SILAR is restricted to simple binary chalcogenides,24,25 and would not be thought of as a potential method to prepare a titanate semiconductor due to the insolubility of the titanate anion. The material formed in this manner has undergone full characterisation, and a variety of different photocatalytic tests as a coating on glass beads, which prove the effectiveness of the material to be applied under conditions found in the real world.
Experimental
Materials
Glass beads (3 mm diameter, soda-lime glass) were purchased from Sigma-Aldrich. Bi(NO3)3·5H2O (98%) and Triton X-100 were purchased from Acros. KBr (>99.5%) and TiCl4 (>98%) were purchased from Fluka. Acetylacetone, 4-chlorophenol (>99%), 4-nitrophenol (>99%), potassium dichromate (99.99%) and meat extract were purchased from Sigma-Aldrich. (NH4)2Fe(SO4)2 (>98.5%) was purchased from Strem Chemicals. Peptone was purchased from Scientific Laboratory Supplies. All salts used in the preparation of the synthetic wastewater were of reagent grade, and were purchased from Fischer Chemical. Potassium bifluoride (98%) and disodium terephthalate (>99%) were purchased from Alfa Aesar. All materials were used as received without further purification.TiO2 suspension preparation
P25 TiO2 powder (2.5 g) was added slowly to water (14 ml) with stirring. Acetyl acetone (0.5 ml) was then added with stirring. Finally, Triton X-100 (5 drops) was added, the resulting suspension was then stirred vigorously overnight before use. The suspension was continually stirred when not in use.Glass bead etching
Soda-lime glass beads were added into a solution of potassium bifluoride (10 mg ml−1) and left to etch for 3 days, with occasional agitation. The beads were then rinsed thoroughly with water, then sonicated in water for 15 minutes, followed by rinsing with ethanol and sonication in ethanol for a further 15 minutes. The beads were then recovered and dried at 100 °C for 30 minutes before use.Deposition of TiO2 on glass substrates
Prior to coating with the prepared TiO2 suspension, the beads were treated with TiCl4 (40 mM) at 70 °C for 30 minutes and then annealed at 500 °C for 30 minutes. The etched & treated glass beads were then coated with TiO2 by immersion of an appropriate amount of the beads in the prepared suspension for 30 minutes. The excess suspension was then drained by initially decanting and then using a syringe to remove the last few drops. The beads were then spread on a glass dish and heated to 100 °C for 30 minutes to dry. Care was taken to avoid clustering of the beads during this process, which would lead to an uneven coating. The beads were then annealed at 500 °C for 1 hour. This process was repeated twice to build up a larger amount of TiO2 on the bead surface.To simplify some of the analytical methods used to characterise the materials, standard microscope slides were coated with the TiO2 suspension by dip-coating. The slides were then wiped clean on one side, and allowed to dry at 100 °C for 30 min. The coated slides then annealed at 500 °C for 2 hours.
SILAR modification
The TiO2 coated glass beads were firstly packed into a standard chromatography column. Two solutions were then prepared, solution A consisting of Bi(NO3)3 in water (5 mM), and solution B consisting of KBr (5 mM) in water. Solution A was added to the column in enough volume such that the beads were fully immersed, and left to stand for 300 seconds. Solution A was then drained and de-ionised water was then added and allowed to stand for 300 seconds. The water was then drained and solution B added and allowed to stand for 300 seconds. After draining, water was finally added and allowed to stand for another 300 seconds. This process is termed as one SILAR cycle, and was repeated between 3 and 9 times to give the different SILAR modified samples. Modification of the coated microscope glass was achieved in similar fashion. Coated substrates were dipped for 300 seconds into a beaker containing solution A, then washed with de-ionised water for 300 seconds, then dipped into solution B for 300 seconds, before finally washing with water for a further 300 seconds. To convert the SILAR deposited BiOBr made using this method, the coated glass substrates were then annealed at 600 °C in air, for 1 hour. For comparison, a Bi2O3–TiO2 sample was also fabricated per a slight modification to a previously reported method.14 In brief, the KBr solution used to generate BiOBr was switched with 1 M KOH solution, and the procedure, including annealing, was carried out in the same way.Material characterisation
X-ray diffraction studies were performed using a Bruker D2 phaser using Cu Kα radiation. UV-vis diffuse reflectance measurements were made using a JASCO V-670 spectrophotometer with an integrating sphere attachment. SEM images were collected using a Carl Zeiss SIGMA HD VP Field Emission SEM, operated in InLens mode with a 10 kV accelerating voltage. SEM-EDS measurements were made on the same instrument, using an Oxford AZtec ED X-ray analysis set up. Solutions for ICP-MS analysis were obtained by dissolving the BTO or BiOBr materials in nitric acid before dilution to give a 3 vol% HNO3 solution. ICP-MS analysis was then performed on an Agilent 7500ce ICP-MS system. Photoluminescence measurements were carried out using a Horiba Jobin Yvon Fluoromax-3. A fibre optic attachment was used to measure the film photoluminescence. TEM images and elemental maps were captured with a FEI Titan Themis electron microscope using a Super-X high sensitivity windowless EDX detector. X-ray photoelectron spectroscopy measurements were carried out using an Al Kα X-ray source on the Scienta 300 XPS spectrometer. Analyses accompanied by an error have been calculated based on three separate measurements.Photocatalytic testing
The coated glass bead samples (approx. 11.5 g) were packed into a jacketed column. 5 ml of a solution of 4-chlorophenol (156 μM) was then added such that the beads were immersed in the solution. The assembly was then irradiated with an unfiltered halogen lamp (400 W, >350 nm) from the side from 5 cm away for 3 hours, keeping the temperature approximately constant at room temperature using a flowing water jacket. The change in absorption of the solution was measured on a JASCO V-670 UV-vis spectrophotometer at 223 nm. Between recycling tests, the beads were left to stand in de-ionised water overnight before drying by passing N2 through the column. Regeneration of the photocatalyst was achieved by heating at 600 °C in air for 1 hour. Photocatalytic scavenging tests were carried out in the same way, using the same concentration of 4-chlorophenol solution, with the addition of tertiary butanol (50 mM), methanol (50 mM) or with the 4-chlorophenol solution being degassed by bubbling with N2 for 30 minutes prior to the test. Synthetic wastewater was prepared in deionised water according to the OECD standard for synthetic wastewater26 (peptone 160 mg l−1, meat extract 110 mg l−1, urea 30 mg l−1, NaCl 7 mg l−1, CaCl2·2H2O 4 mg l−1, MgSO4·7H2O 2 mg l−1, K2HPO4 28 mg l−1). To this solution was introduced 4-nitrophenol (20 mg l−1), before measuring the photocatalytic removal of the 4-nitrophenol in the same way as used in previous tests. Degradation of 4-nitrophenol was measured using the same UV-vis spectrophotometer as before, using the peak at 350 nm for 4-nitrophenol. Chemical oxygen demand titrations of the synthetic wastewater were carried out before and after photocatalytic degradation as follows. To a sample of wastewater (5 ml) was added concentrated H2SO4 (20 ml) and potassium dichromate (4 mM, 25 ml). The resulting solution was swirled and allowed to stand for 15 minutes before adding a couple of drops of ferroin indicator and titrating against freshly prepared ammonium iron sulfate solution (40 mM). A blank deionised water sample was also run in the same fashion.Error bars were calculated by repeated measurements on three separate samples.
Bactericidal testing
Bactericidal testing was carried out in a similar method to the photocatalytic testing. Coated beads (approx. 11.5 g) were packed into a jacketed column and de-ionised water spiked with Escherichia coli (E. coli) (5 ml, 2 × 10⁶ CFU) added such that the beads were immersed. The assembly was then irradiated with an unfiltered halogen lamp (400 W, >350 nm) from the side from 5 cm away for 90 minutes. The standard E. coli ATCC 23716 (American Type Culture Collection, Rockville, MD, USA) strain was used. The freeze-dried cultures were rehydrated and reactivated according to the manufacturer's instructions. Viable E. coli bacteria were measured using a serial dilution pour plate agar technique. Serial dilutions of the reaction solution were performed in sterile aqueous solution and 200 μL of each dilution (including neat sample) were pipetted and spread onto Brilliance E. coli/coliform agar (Oxoid) plates, a selective culture medium. The plates were incubated at 37 °C for 20–24 h before viable counts were determined.Results and discussion
TiO2-Bead preparation and SILAR processing
Glass beads were chosen as a substrate as they can fill any container effectively, and are therefore more applicable than, for example, a flat glass plate. The general fabrication process for the coated bead samples is given in Fig. 1A. The beads are first etched to provide a roughened surface to which TiO2 particles are well adhered. Once roughened, a TiO2 coating is applied by firstly treatment with a solution of TiCl4, and then immersion in a suspension of TiO2 according to a standard literature procedure.27 BiOBr SILAR is then carried out by packing the TiO2 coated beads into a column and sequentially passing solutions of Bi(NO3)3 and KBr through as shown in Fig. 1B. This SILAR process was repeated between 3 and 9 times to give different amounts of the BiOBr precursor, which after a final annealing step gave BTO–TiO2 coated beads. The samples will henceforth be named N× BTO, where N is the number of SILAR cycles used upon the beads. While the beads were used exclusively for the photocatalytic testing, much of the analysis requires a flat surface to be carried out, therefore the same process was applied to microscope slides for some of the analytical measurements.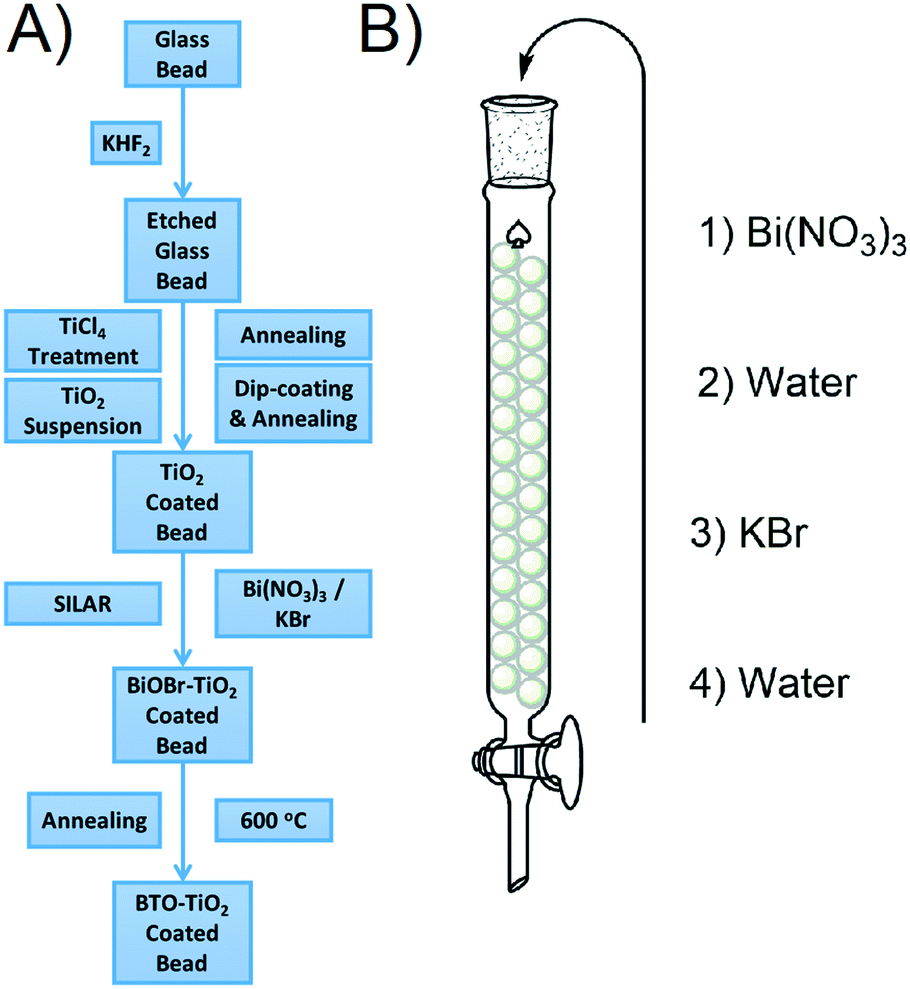 | ||
| Fig. 1 A) General fabrication procedure for BTO–TiO2 coated beads B) SILAR processing details for BiOBr precursor modification. | ||
X-ray diffraction
X-ray diffraction (XRD) traces of the pristine TiO2 and BTO–TiO2 samples are given in Fig. 2A. Due to P25 being the source of TiO2 used, a mixture of anatase and rutile phase TiO2 was found in the pristine TiO2 sample. Upon SILAR modification and annealing, a variety of new peaks appeared, which can be assigned to the orthorhombic Aurivillius structure of BTO (JCPDS card #35-795). These peaks were found to increase in intensity as the number of SILAR cycles increased, corresponding to the formation of larger amounts of BTO. Two major peaks were observed at 2θ values of 30.2 and 33.0 corresponding to the [171] and [200] planes of BTO respectively.28 Other bismuth titanate phases such as Bi2Ti2O7 and Bi12TiO20 have been previously reported, however peaks for these phases29,30 were not observed, indicating a single pure phase of Bi4Ti3O12. Further smaller peaks were also observed, and assigned as shown in Fig. 2A. For comparison, XRD traces of a BiOBr–TiO2 sample (9× BiOBr) before annealing and a Bi2O3 sample (9× BO) prepared by a previously reported SILAR method14 were measured as shown in Fig. 2B. The prepared BTO–TiO2 was found to share no peaks with the BiOBr and Bi2O3 comparison materials, indicating that the preparation method used to generate BTO is indeed forming a distinct phase. The intensity of the major TiO2 peaks were found to decrease on increased number of SILAR cycles, indicating the conversion of some TiO2 into BTO. Interestingly, certain TiO2 peaks were observed to decrease more than others. The intensity of the [101] anatase peak at a 2θ value of ∼25.4° was around one half the area for the 9× BTO sample compared with the pristine TiO2 (Fig. S1, Table S1†). Conversely, the area of the main [110] rutile peak at ∼27.5° and the smaller [101] peak at ∼36.1° were found to be largely unaffected (Fig. S2 and S3, Tables S2 and S3†). A very small decrease was noted for the anatase [200] peak at 48.1° (Fig. S4, Table S4†). All other observed peaks were found to be unaffected by the formation of BTO (Fig. S5†). Therefore, it can be concluded that BTO is being formed mostly from the [101] plane of anatase TiO2. It is known that the [101] surface is the most thermodynamically stable facet of anatase, with many studies having been undertaken to investigate reactivity on this facet.31 We propose that BTO has formed with the consumption of titanium from anatase surfaces of this facet predominantly due to preferred deposition of the BiOBr precursor on this facet. These findings contrast with the observations of Zhang et al., who used a hydrothermal modification of Bi onto anatase with exposed [001] facets.23 In their study, it was concluded that BTO would not form on the anatase [101] facet, and would preferentially form on their exposed [001] facet due to lattice matching. Zhang et al. were however unsuccessful in using their hydrothermal method to deposit BTO on P25, which they concluded was due to the mismatch of BTO with the exposed anatase [101] facet in P25. In this work, it has been demonstrated that it is indeed possible to grow BTO from this facet when using our SILAR BiOBr/thermal annealing route. In addition, the crystallinity of the BTO material formed in this route is significantly higher than that demonstrated by Zhang et al.,23 a factor which has been demonstrated to be very significant in photocatalysis.32,33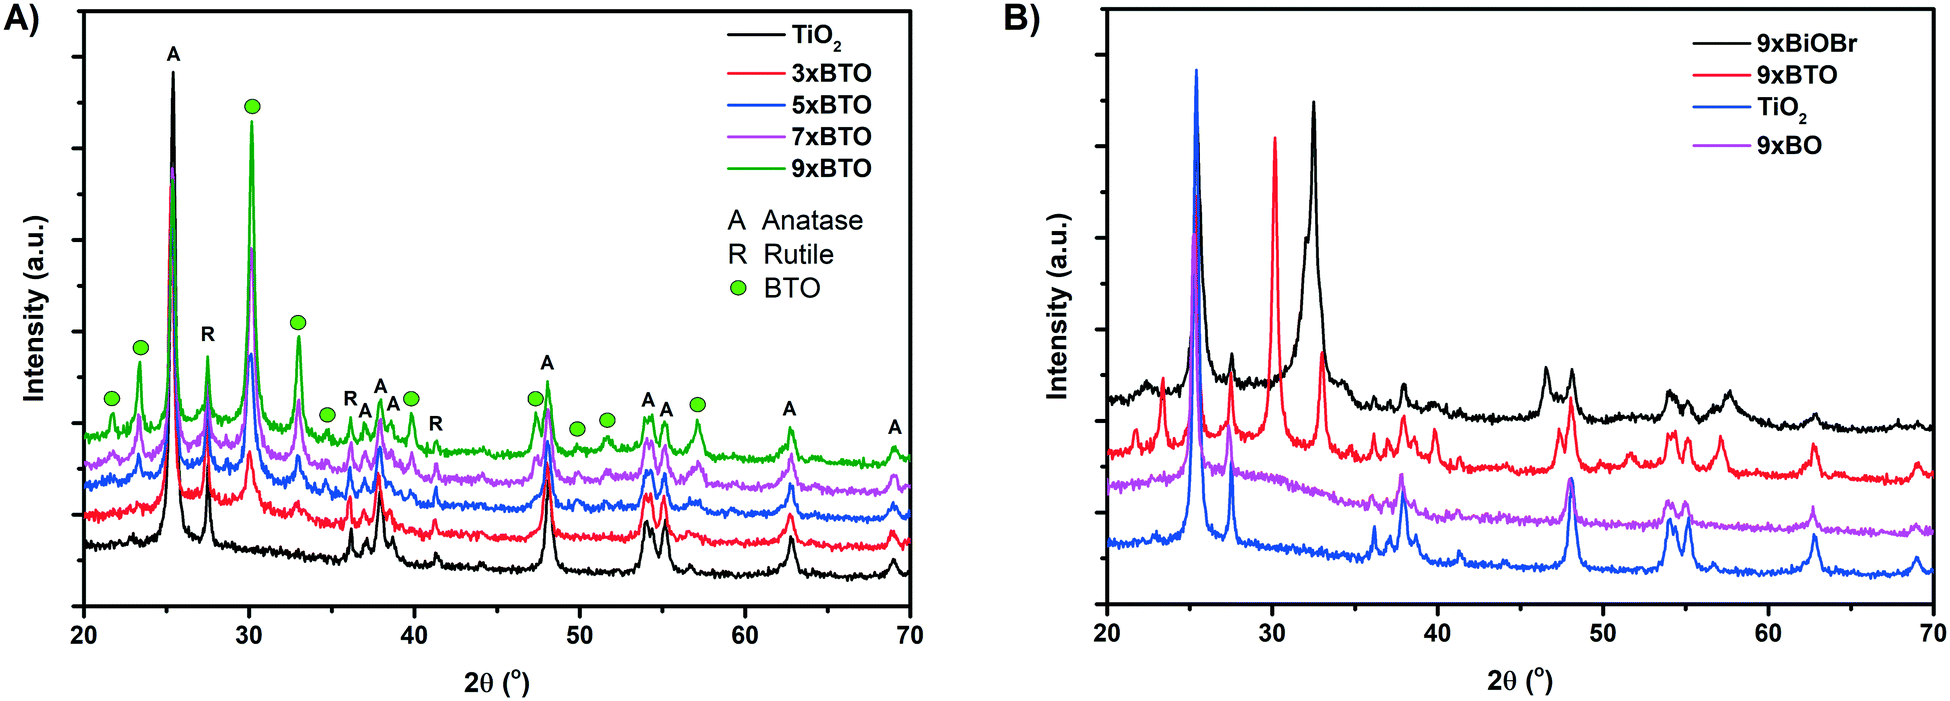 | ||
| Fig. 2 A) XRD traces of samples modified with different numbers of SILAR cycles B) comparison between the BiOBr precursor (9× BiOBr), the previously reported bismuth oxide (9× BO) and bismuth titanate (9× BTO). | ||
Electron microscopies
The surface of the TiO2 and BTO–TiO2 modified beads was investigated using scanning electron microscopy (SEM), example images of which are given in Fig. 3A and B. Images of the etched glass beads are given in the ESI† (Fig. S6).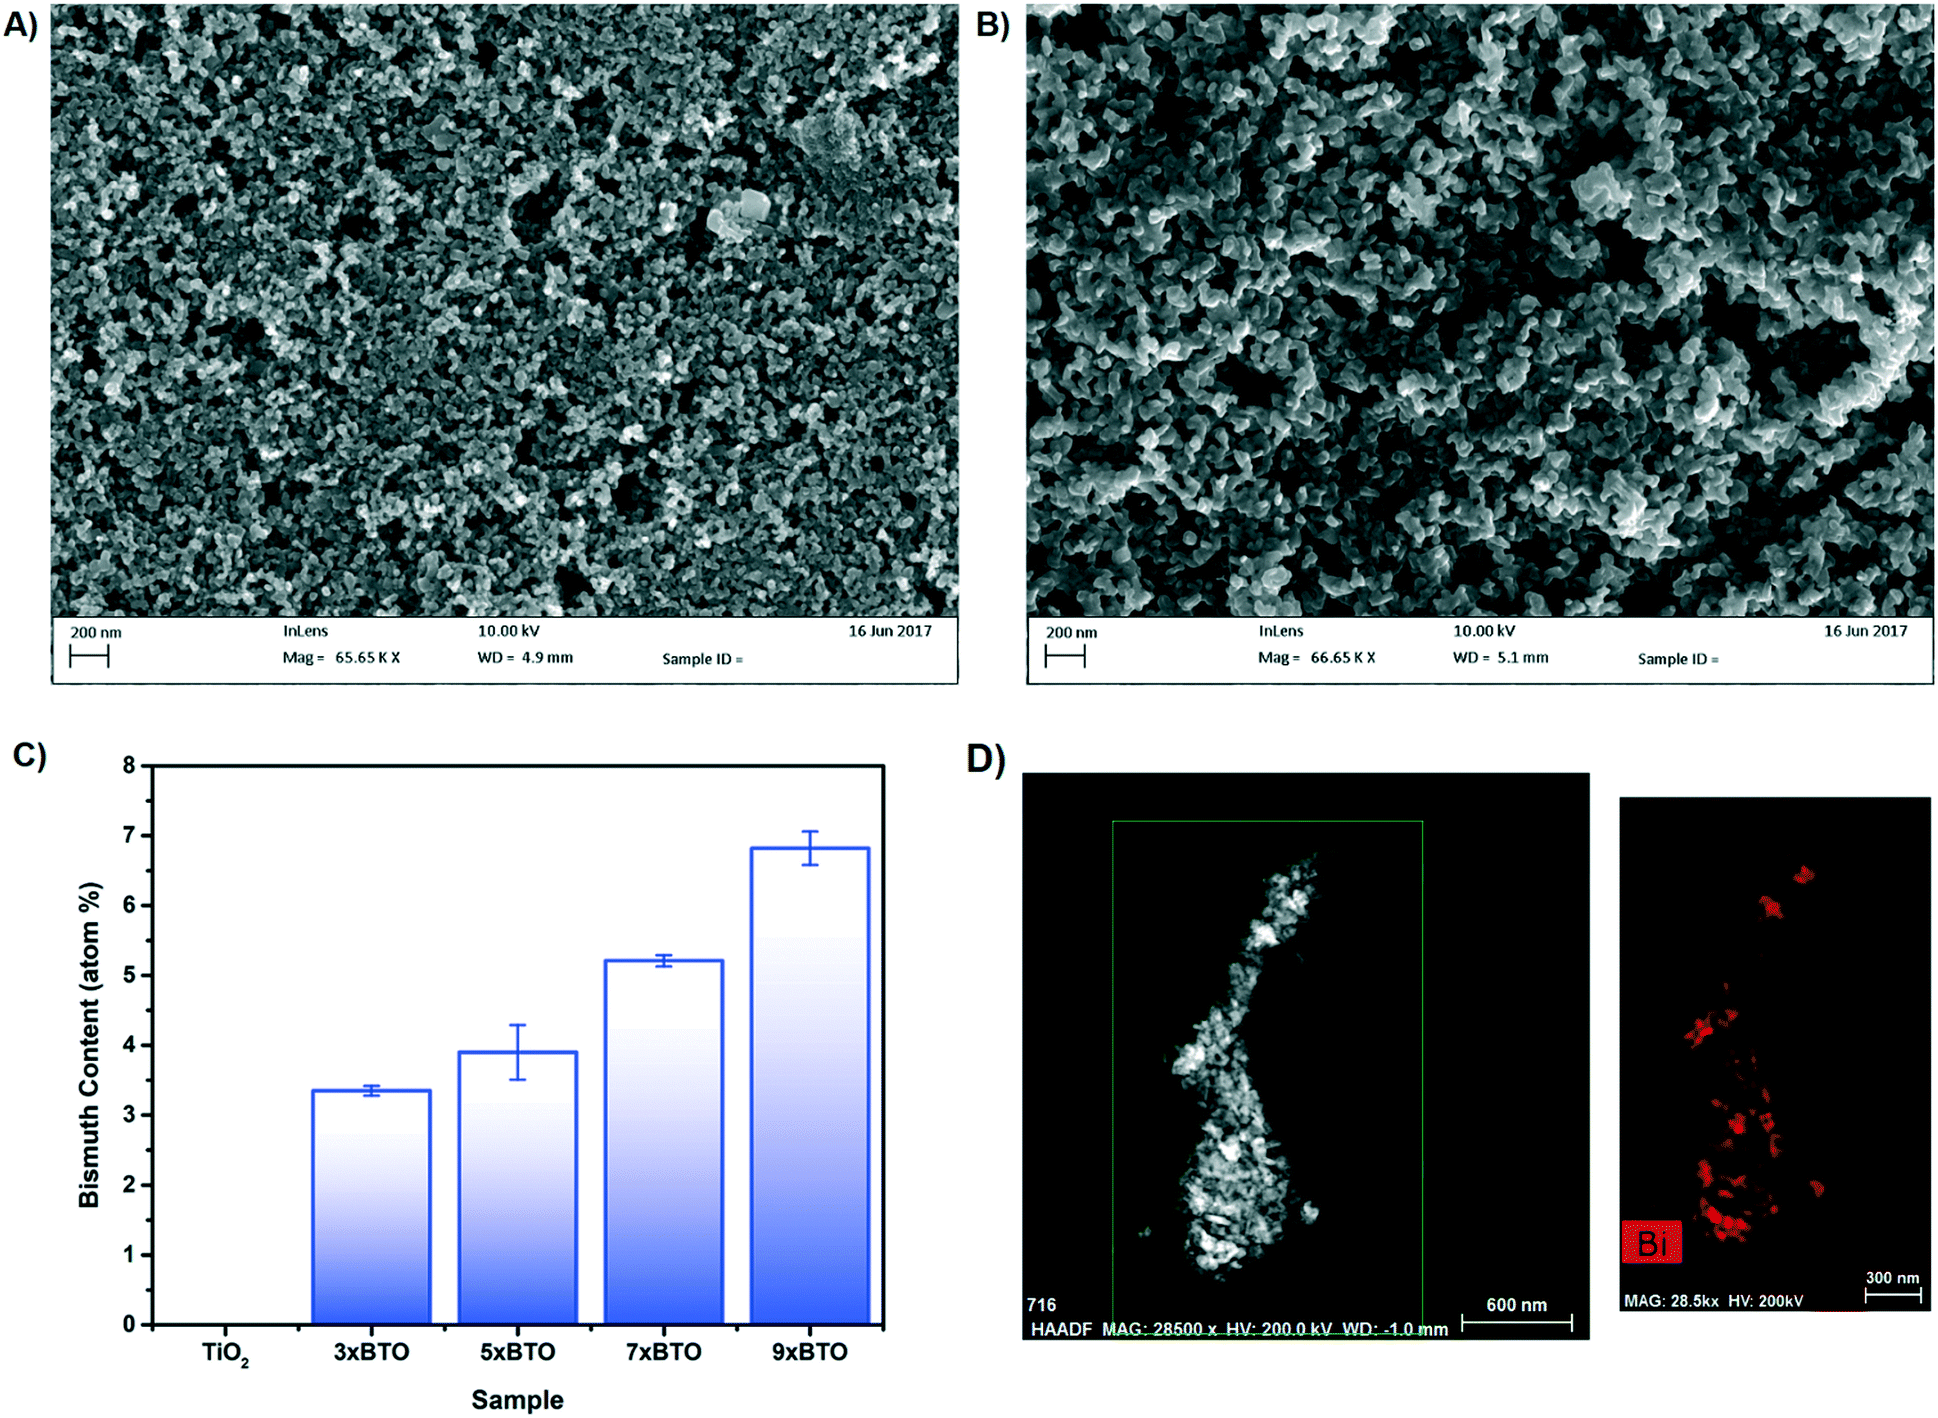 | ||
| Fig. 3 A) SEM images of the pristine P25 TiO2 coated bead surface B) SEM image of the 9× BTO coated bead surface C) bismuth atom% concentration as measured by SEM-EDS on the BTO modified samples D) TEM high angle annular dark field image of the 7× BTO material and corresponding Bi elemental map. | ||
A porous network of particles could be observed with particle sizes of around 20–30 nm for the pristine TiO2 sample. Upon modification with BTO, the particles appear to increase in size somewhat to ∼50–100 nm, and the gaps between the particles widen significantly. No obvious interface between the BTO and TiO2 materials was observed however at this magnification. Energy dispersive X-ray spectroscopy (EDS) was used to identify the elements present in the coatings (Fig. 3C). A clear increase in Bi concentration was found as the number of SILAR cycles was increased, corresponding to larger amounts of BTO in the structure. No indication was found of any Br, indicating the complete conversion of BiOBr to BTO by annealing.
Transmission electron microscope (TEM) elemental mapping was used to characterise the distribution of bismuth in the composite (Fig. 3D). The distribution of Bi in the material was found to be inhomogeneous, with some particles appearing completely converted to BTO, while others contained little bismuth. The origin of this was investigated by examination of the BiOBr–TiO2 precursor (Fig. S7†). BiOBr was observed to have been deposited as nanoflakes on the TiO2 surface, a typical morphology for bismuth oxyhalides.34,35 However, many particles were devoid of BiOBr material, and it is therefore likely that the areas of high Bi concentration after annealing correspond to areas in which the BiOBr nanoflake precursor had grown.
ICP-MS analysis
To prove the conversion of BiOBr to BTO on heating, an acidic leach solution was prepared from the films. The Br content in the leach was then quantified by inductively coupled plasma mass spectrometry (ICP-MS) (Fig. 4). Before annealing in the 9× BiOBr sample, large quantities of Br were found, whereas after annealing the Br has completely left the structure. Small quantities of Br appear to remain; however, these were also found to be present in the blank, indicating that they do not originate from the sample. This result is in keeping with the SEM-EDS, indicating the complete conversion of BiOBr to BTO on heating.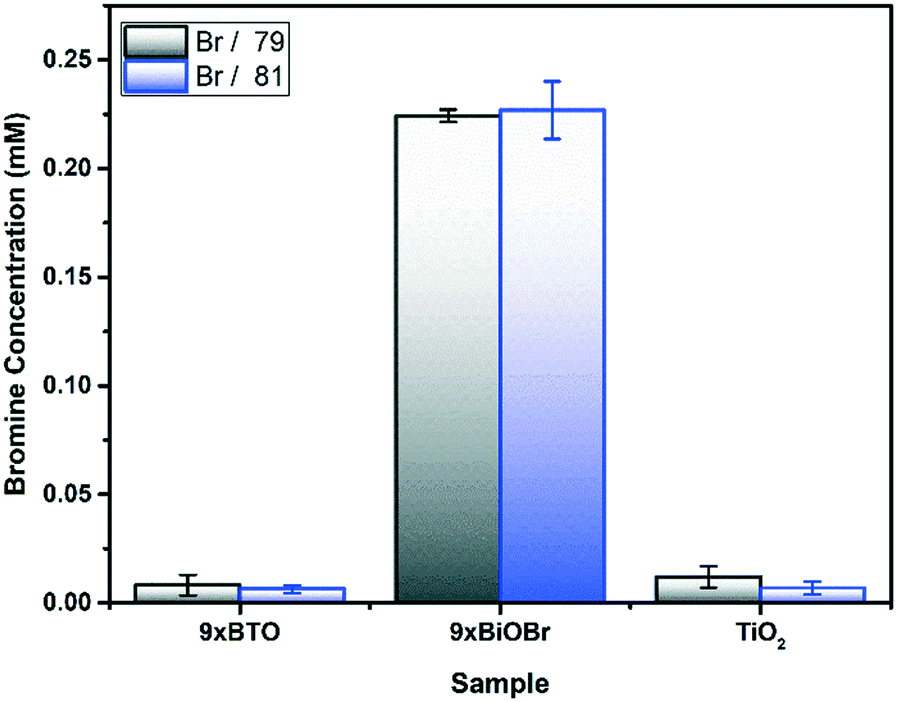 | ||
| Fig. 4 Br content of the precursor, and annealed material determined by ICP-MS. | ||
X-ray photoelectron spectroscopy
X-ray photoelectron spectroscopy (XPS) analysis was used to characterise the various chemical states of the elements present in the composite (Fig. 5). 7× BTO (Fig. 5A) displayed clear peaks at binding energies typical for Bi3+ 4f electrons at 159.8 and 165.1 eV, corresponding to the s = 5/2 and 7/2 spin states respectively in good agreement with previous reports for BTO.36 The Ti4+ region (Fig. 5B) of the composite is somewhat complicated by overlapping of the Bi 4d and Ti 2p peaks resulting in a broad band between ∼460–470 eV, but is in keeping with previous reports for Ti 2p states in BTO.37 O1s region scans (Fig. 5C) show a single asymmetric peak at 530.3 eV, with a slight shoulder toward higher energy which can be assigned to the presence of surface adsorbed oxygen containing species and surface terminal oxygen atoms.38 In accordance with the SEM-EDS and ICP-MS results, no peaks due to Br were observed in the survey scan (Fig. S8†). XPS spectra for a blank TiO2 sample as well as carbon region scans used for calibration are included in the ESI† (Fig. S9 and S10†).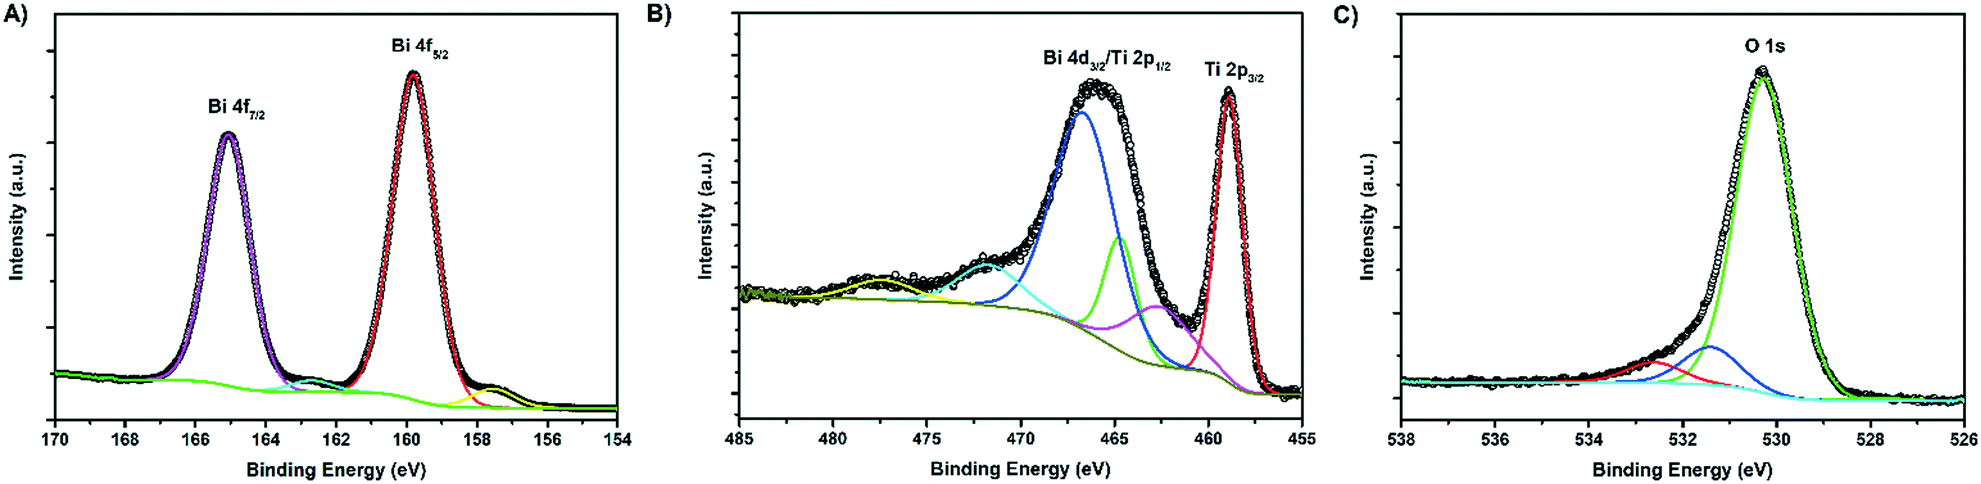 | ||
| Fig. 5 XPS scans of the A) Bi 4f region B) Ti 2p and Bi 3d region C) O 1s region. | ||
Optical properties
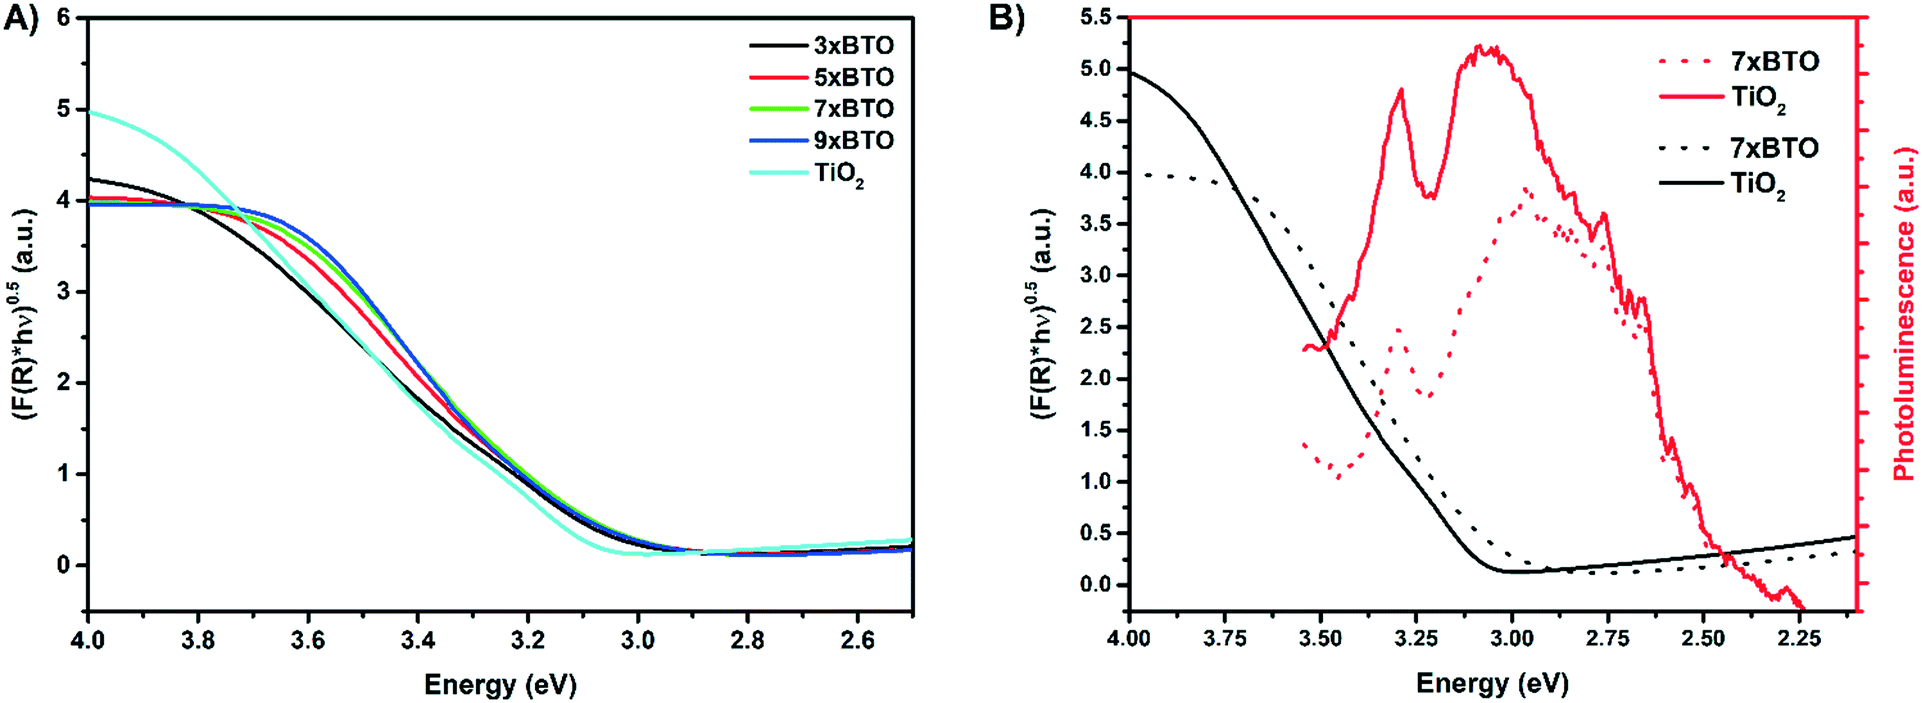
To investigate the light absorbing properties of the materials, UV-visible diffuse reflectance spectra were measured and converted into the corresponding Tauc plots (Fig. 6A). Modest shifts into the visible were noted for the BTO modified samples, which were quantified using the following relationship:where F(R) is the absorption obtained from the Kubelka–Munk function, h is Plank's constant, ν is the frequency of the incident light, A is a constant and Eg is the band gap. The band gaps obtained by extrapolation of the linear portion of the Tauc plots are summarised in Table 1.
 | ||
| Fig. 6 A) Tauc plots derived from diffuse reflectance measurements B) photoluminescence plots of 7× BTO and P25 TiO2 overlayed with their corresponding Tauc plot. | ||
| Sample | Band gap (eV) |
|---|---|
| TiO2 | A: 3.12(7), R: 3.04(7) |
| 3× BTO | 2.98(3) |
| 5× BTO | 2.97(6) |
| 7× BTO | 2.95(8) |
| 9× BTO | 2.98(2) |
Two values were clearly obtainable for the pristine P25 TiO2 sample, due to the presence of both anatase and rutile, with nominal band gaps of 3.1 eV and 3 eV respectively. The BTO modified samples all exhibited approximately the same band gap of around 2.96–2.98 eV, within the range of values reported previously for the Bi4Ti3O12 phase of BTO.39 While this value does not constitute a great deal of visible light harvesting (2.96 eV = 419 nm), it is important to note that upon lowering the band gap, there is less driving force to produce reactive species for water purification. Fundamentally low band gap materials give high light harvesting, but may be poor photocatalysts for water purification due to the low energy of photoexcited charges, leading to an inability to form the highly reactive oxygen species needed for full mineralisation.40
Photoluminescence (PL) measurements are a common method used to investigate the degree of charge separation in heterojunctions.41,42 Upon excitation of the TiO2 at 325 nm, the PL spectra of the prepared materials were measured (Fig. 6B). Broad PL signals were observed from 355 nm to 550 nm for all the samples, with the BTO–TiO2 heterojunctions generally exhibiting lower PL intensity over this range. This can be indicative of lower charge recombination. However, it is important to note that lowered PL intensity in the range that BTO absorbs may in fact be due simply to re-adsorption of emitted photons by BTO, and not separation of charges. This has often been overlooked in previous reports,43–45 and should be considered. Therefore, in this work the Tauc plot of 7× BTO has been overlayed with its PL spectrum. A general decrease in PL intensity across the entire emission is observed, however it should be noted that emission above ∼2.98 eV should not be relied upon due to the effect of re-absorption. Nevertheless, the PL intensity below the BTO band gap energy is also lowered, and as such there is some separation of charges occurring across the BTO–TiO2 interface.
Photocatalytic testing
Photocatalytic water purification tests were run in a jacketed column type reactor packed with the sample coated beads as detailed in the ESI† (Fig. S11). To avoid any photosensitisation which may occur when using a dye molecule as a model pollutant,46 the destruction of colourless 4-chlorophenol (4CP) was chosen as a metric for photocatalysis. Photocatalytic tests against dyes, while often successful, should always be accompanied with a test such as this. In addition to photosensitisation, it is also possible to simply oxidise/reduce certain dyes to colourless molecules,47 and incorrectly assume degradation. Before irradiation, dark adsorption experiments were carried out (Fig. S12†). Overall degradation efficiency (DE) was calculated for the prepared materials on 4CP as shown:where C is the concentration of 4CP after 3 hours irradiation and C0 is the initial concentration of 4CP. The DE of the materials on 4CP under irradiation with a 400 W halogen lamp is shown in Fig. 7A. DE was observed to be higher for the BTO modified materials than the pristine TiO2 sample, with the greatest activity exhibited by the sample derived from 7 SILAR cycles, achieving ∼75% DE during the 3 hours of illumination.
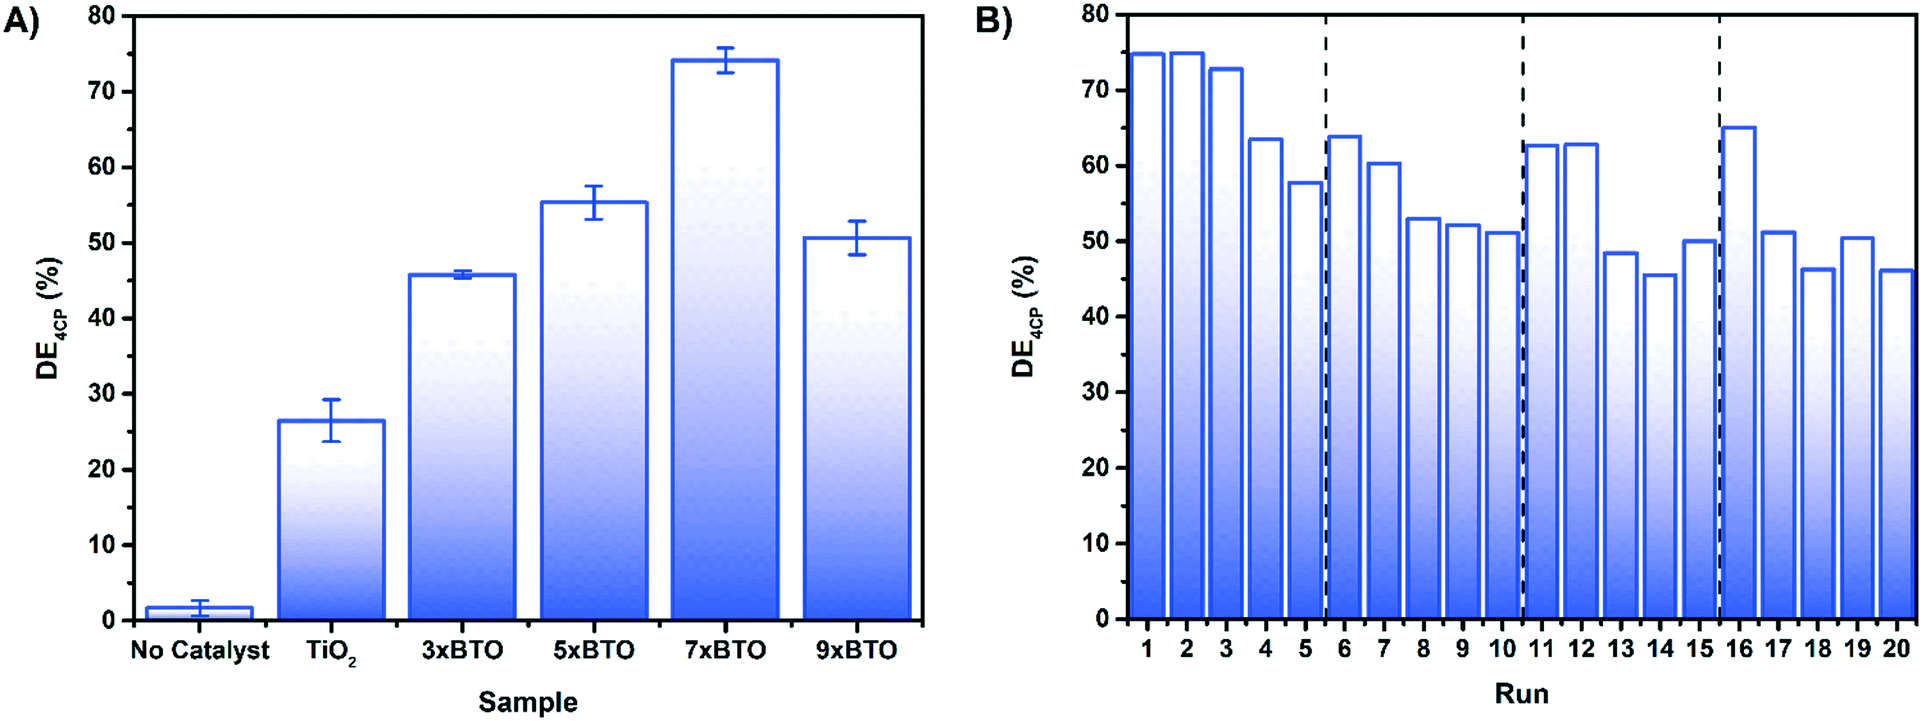 | ||
| Fig. 7 A) Photocatalytic degradation of 4CP by the coated bead samples after 180 minutes B) recycling test of 7× BTO on 4CP, each run consisting of 180 minutes irradiation. | ||
While direct comparisons with the photocatalytic results of others are difficult, it should be noted that a previous investigation by Zhang et al. on the photocatalytic activity of BTO–P25 composites yielded no activity at all.23 It was concluded that this was due to an inability for BTO to form on the anatase [101] facet under hydrothermal conditions. Using the SILAR/thermal annealing route described here however it appears that it is possible for BTO for form on this facet, and give good photocatalytic activity.
As the composite with the best activity, 7× BTO was chosen for further studies. An important property for the viability of a photocatalyst system is the ability to re-use the photocatalyst materials. An advantage of using an immobilised system is the ease of which this can be carried out. To test this, the photocatalytic degradation of 4CP was measured by successive photocatalytic tests, with a fresh solution of 4CP on each run (Fig. 7B). Slight losses of activity were observed after the first run, but remained stable on subsequent runs. It was found that the activity could be returned to the original level by using a calcination process to regenerate the photocatalyst beads. This could be due to inhibition of the photocatalyst surface by degradation products, which can be removed by calcination. Regeneration of the photocatalyst by this method was found to be effective in extending the photocatalyst activity up to at least 60 hours.
To investigate the effect of interfering contaminants and to move toward a more realistic system, the activity of 7× BTO was tested upon 4-nitrophenol in synthetic wastewater (Fig. 8A). It was found that using synthetic wastewater as a medium had no effect on the photocatalytic activity of 7× BTO, displaying similar degradation efficiency (∼75%) as in a deionised water medium. The ability of photocatalysts to handle relatively highly contaminated water and retain good degradation activity in this way is key in moving away from somewhat artificial tests against single model contaminants in de-ionised water, and as such is an important assessment of a photocatalytic materials applicability.
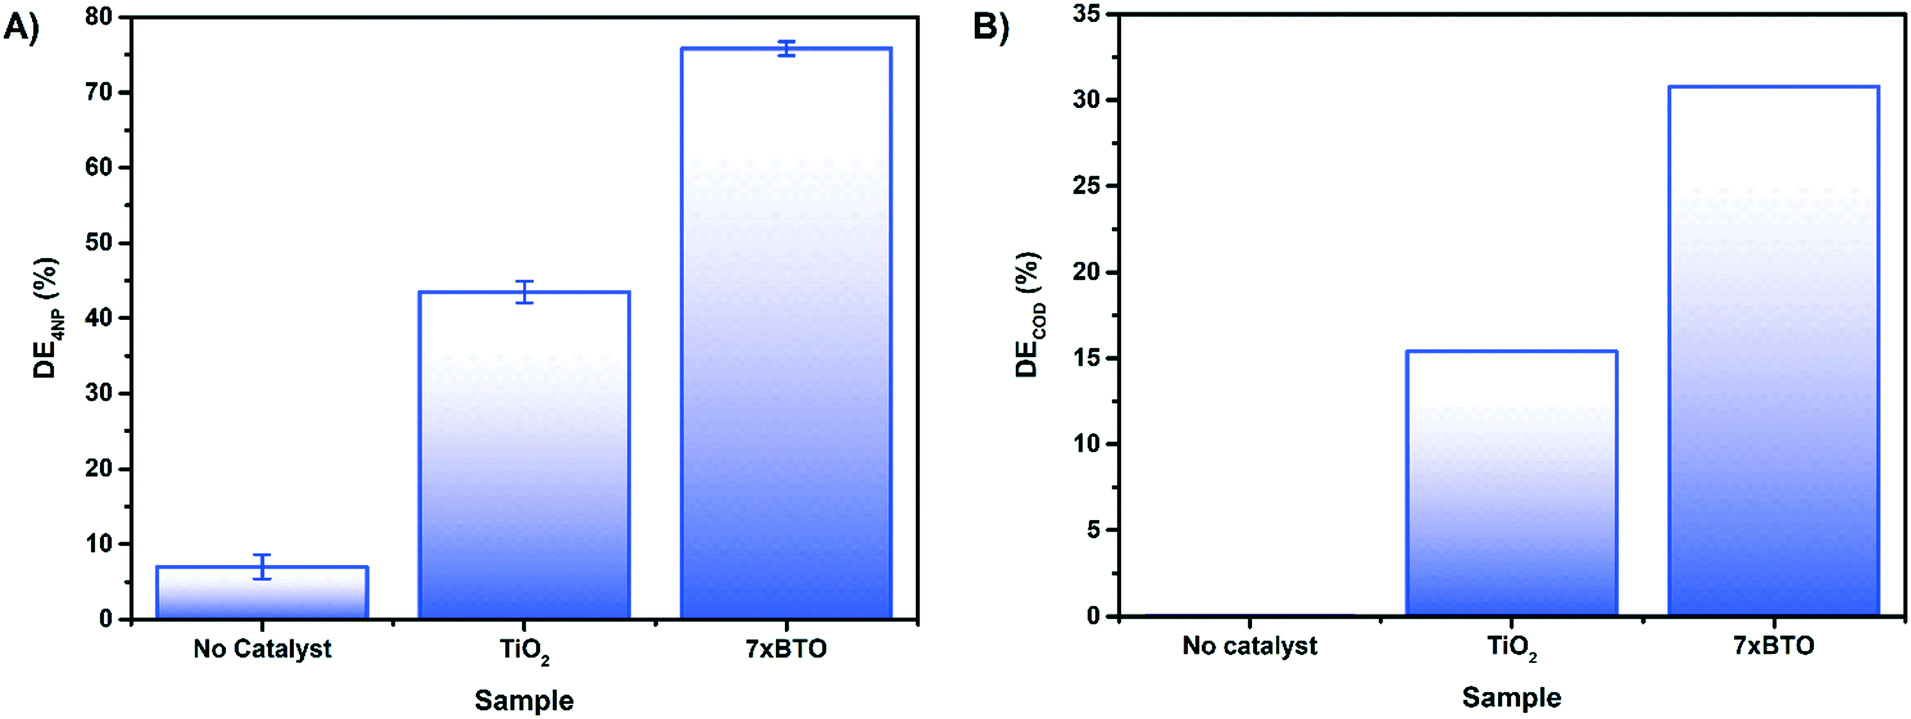 | ||
| Fig. 8 A) Photocatalytic degradation of 4NP in a synthetic wastewater medium after 180 minutes irradiation B) photocatalytic COD reduction of synthetic wastewater in 180 minutes of irradiation. | ||
To gain an insight into the degree of complete mineralisation, as opposed to initial degradation, chemical oxygen demand (COD) measurements were made on samples of synthetic wastewater before and after photocatalytic treatment (Fig. 8B). While 7× BTO displayed a clear improvement over the TiO2 control, it was noted that the COD removal was significantly lower than the degradation tests on 4CP/4NP measured by absorption spectroscopy, only achieving 30% DE rather than 75%. It is commonly found that COD and similar measurements such as total organic carbon (TOC) lag behind the degradation measured by absorption spectroscopy48–50 due to the destruction of the chromophore being usually several oxidation steps removed from full mineralisation.51 This type of mineralisation study is often overlooked in much of the literature, where simple decolourisation tests are favoured, but should be carried out to ascertain whether mineralisation of the pollutant in question is being achieved.
Bactericidal testing
E. coli is a Gram-negative bacterium often used as an indicator of bacterial content in drinking water.52 To investigate the bactericidal activity of the prepared photocatalyst beads, the destruction of E. coli was measured (Fig. 9). After 90 minutes, almost complete removal of viable colony forming units (CFU) was observed for the 7× BTO sample, while in the unmodified TiO2 sample around 40 times the number of CFU remained. It has been proposed that photocatalytic bactericidal activity works by oxidative damage to the cell wall4,53 and modifications to bacterial DNA54 by reactive oxygen species reducing the ability of bacteria to form viable colonies. Rapid destruction of E. coli is an encouraging sign of bactericidal activity; however, it should be noted that as a Gram-negative bacteria E. coli is more susceptible to destruction using advanced oxidation processes than Gram-positive bacteria.55 Previous work has demonstrated that under the same conditions Gram-negative bacteria take significantly longer to be de-activated than Gram-positive.56 We suggest that the BTO–TiO2 system affects rapid deactivation of E. coli, but would warn against assuming such efficient bactericidal action against other micro-organisms.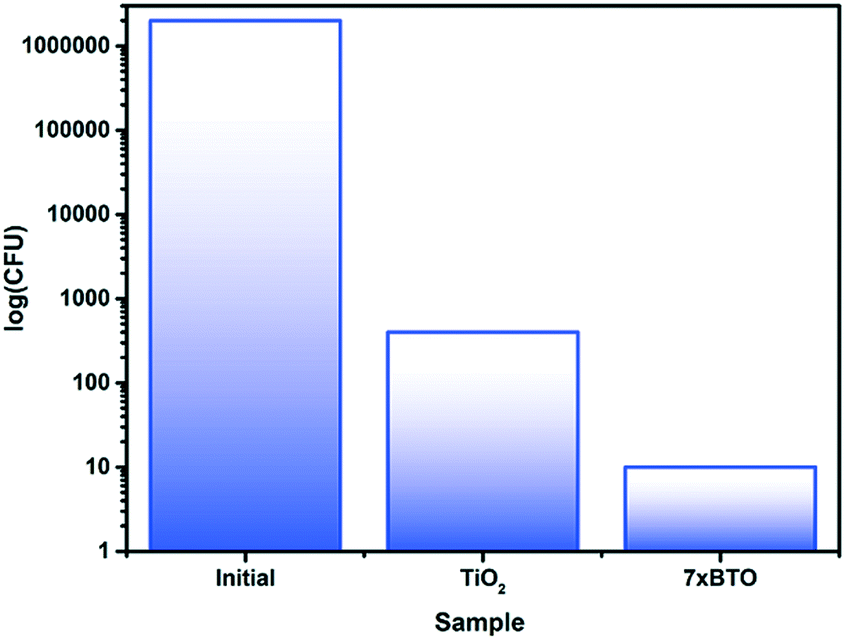 | ||
| Fig. 9 Viable colony counts in the initial contaminated water sample, and after photocatalytic treatment. | ||
Mechanistic studies
To probe the mechanism of photocatalytic activity a series of scavenging tests were carried out on 4-chlorophenol. tert-Butanol, methanol and degassing with nitrogen were used to scavenger for hydroxyl radicals,57 holes58 and to study the effect of electron transfer to dissolved oxygen59 respectively (Fig. 10A). It was found that tert-butanol reduced the photoactivity to around 40%, while the addition of methanol almost completely stopped the photocatalytic reaction. This would suggest that the mechanism involves both hole driven production of hydroxyl radicals and direct oxidation of the model pollutants by holes. Degassing with nitrogen to remove dissolved oxygen from the solution also reduced the photoactivity to around 45%, indicating that electron transfer from the composite to oxygen is key in the degradation mechanism. Hydrogen peroxide and hydroxyl radicals60 may be formed via the superoxide ion resulting from electron transfer to oxygen. It is likely that without oxygen in the solution a combination of loss of these reactive species and increased recombination results in a reduced degradation efficiency.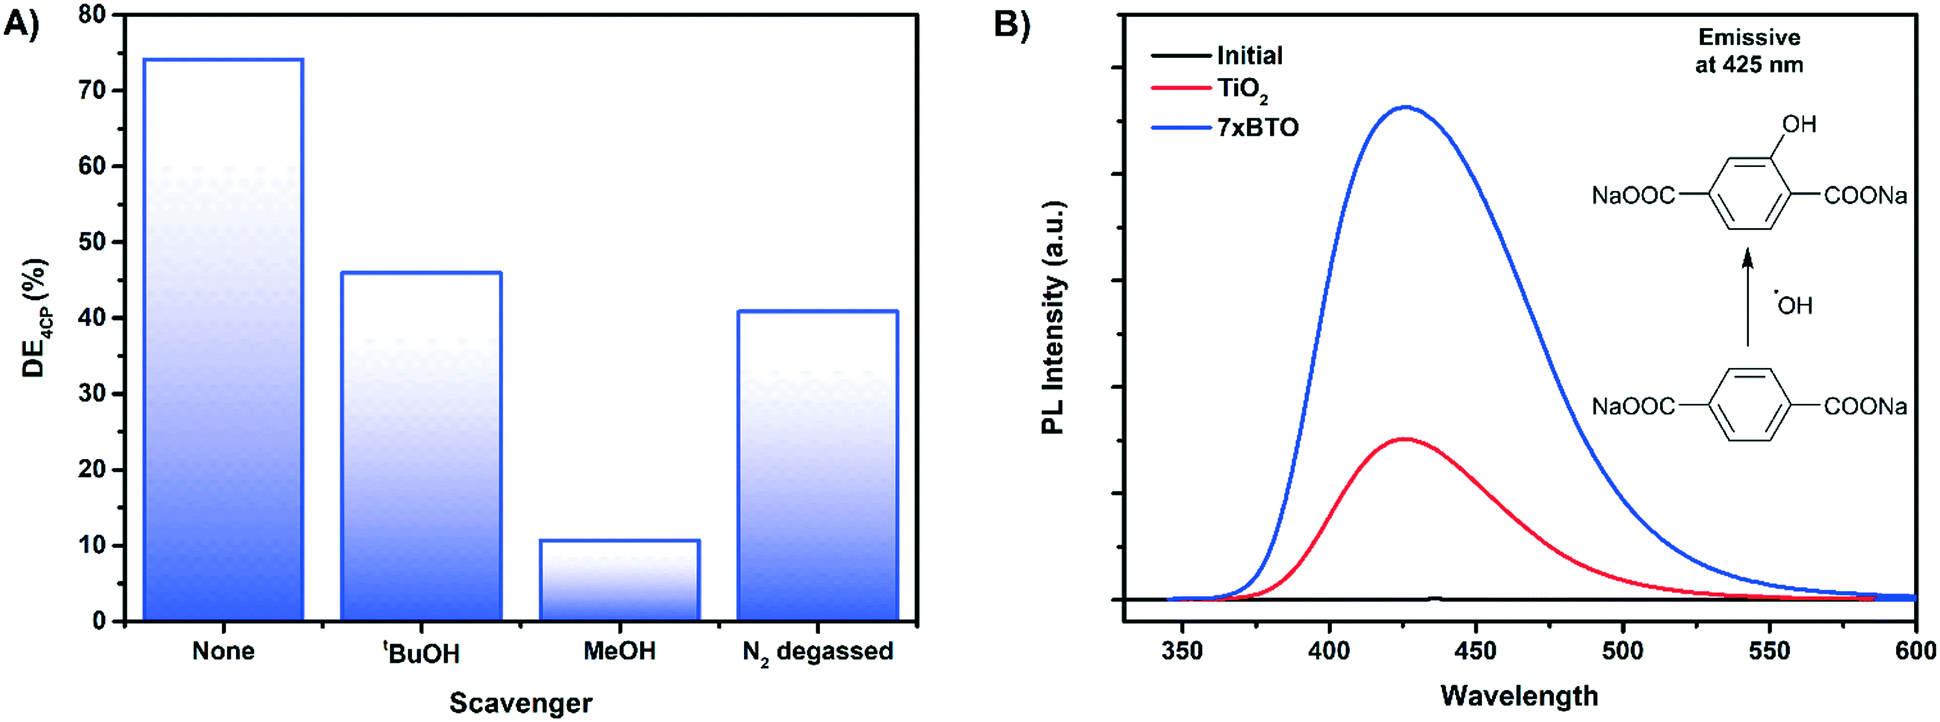 | ||
| Fig. 10 A) Key reactive species determination by scavenger tests on 4CP after 180 minutes irradiation B) hydroxylation of disodium terephthalate by photocatalytically produced hydroxyl radicals in 120 minutes irradiation. | ||
Hydroxyl radicals, due to their high oxidising power and fast reaction rates approaching the diffusion limit40,61 are key in the mineralisation of organic pollutants and the destruction of bacteria. A common strategy to prove the production of hydroxyl radicals is to monitor the hydroxylation of sodium terephthalate to the fluorescent 3-hydroxy sodium terephthalate.62 After 2 hours of irradiation of a solution of sodium terephthalate with TiO2 and 7× BTO samples a photoluminescence peak at 425 nm typical of 3-hydroxy sodium terephthalate was observed (Fig. 10B). While both TiO2 and 7× BTO produced hydroxyl radicals, the yield of the hydroxylated product was found to be ∼3 times higher on 7× BTO compared to TiO2. This finding is in accord with the scavenging tests, indicating that hydroxyl radicals are involved in the photocatalytic degradation mechanism.
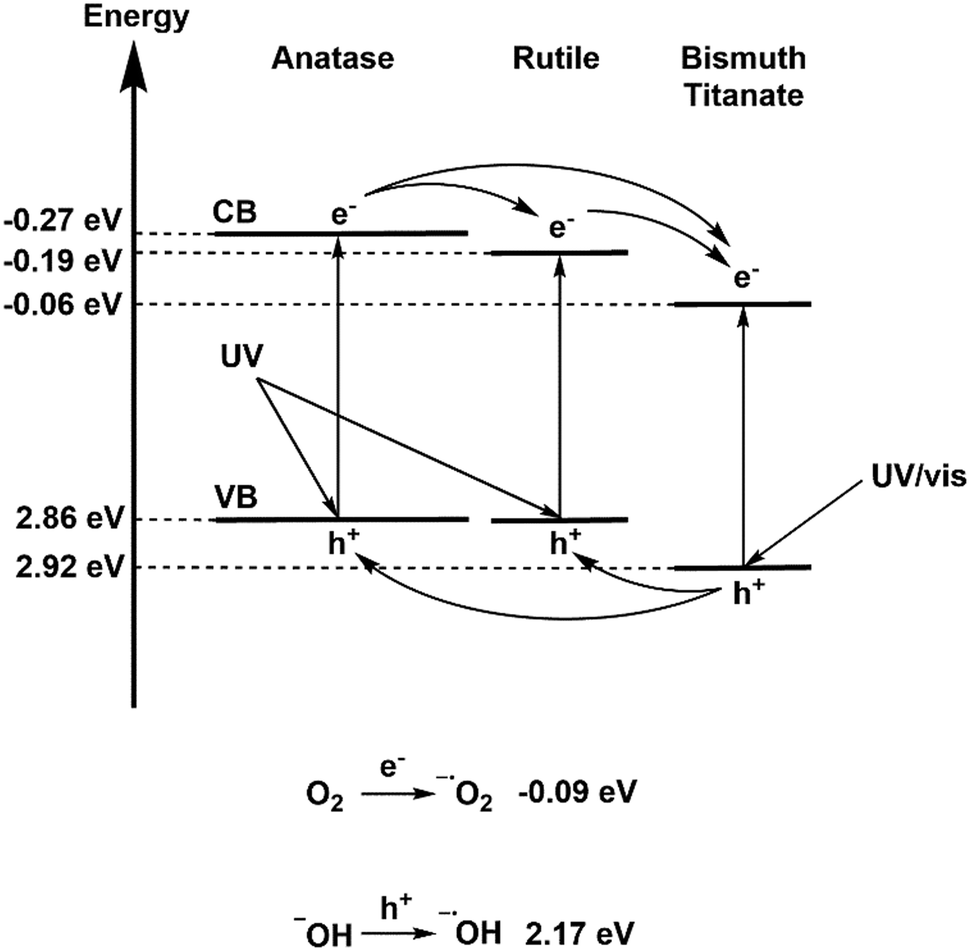
According to values calculated in the literature, the BTO and TiO2 valence bands lie at 2.92 eV (ref. 37) and 2.86 eV (ref. 63) on the hydrogen scale respectively. Using these values, and the band gaps determined by diffuse reflectance measurements, it is possible to propose a band alignment diagram, and a plausible mechanism (Fig. 11). Accordingly, a driving force of 160 mV exists for holes to migrate from BTO to TiO2, allowing transfer of photogenerated holes and subsequent direct oxidation of pollutants, or formation of hydroxyl radicals. Photogenerated electrons on the anatase portion of P25 TiO2 also have a driving force to transfer to BTO/rutile TiO2, however once there they lie below the potential required for electron transfer to oxygen. It can be concluded that BTO is acting in this capacity as an electron sink, similarly to the traditional model of electron transfer on P25.56 Given that removal of oxygen from a test solution somewhat abated the photocatalytic efficiency however, it can be concluded that not all photoexcited electrons in the anatase conduction band are transferred to BTO/rutile, and that some electrons are trapped as superoxide ions.
 | ||
| Fig. 11 Proposed mechanism for photocatalysis on BTO–TiO2 nanocomposites, including electron transfer viability and ROS generation. | ||
Conclusions
A sequential ionic layer adsorption reaction method and thermal annealing has been investigated as a new way to produce bismuth titanate on titanium dioxide surfaces. This route is previously unknown in the literature, and demonstrates that SILAR may be used to generate more than simple binary chalcogenides. This material has been immobilised on glass beads as a support, and applied to a variety of different photocatalytic tests. The TiO2–BTO system has been found to be effective on molecular organic targets, providing high degradation and a degree of mineralisation, as well as photocatalytic bactericidal properties. In addition, steps have been undertaken to test the real-world applicability of the system, including its recyclability, and the effect of testing in a synthetic wastewater medium on the degradation efficiency.Conflicts of interest
There are no conflicts of interest to declare.Acknowledgements
The authors would like to thank the CRITICAT Centre for Doctoral Training (Ph.D. studentship to O. G.; grant code: EP/L016419/1) for financial support. TEM studies were achieved with support of the EPSRC Capital for Great Technologies Grant (EP/L017008/1). Open data: http://dx.doi.org/10.7488/ds/2285.References
- https://sustainabledevelopment.un.org/, 2017.
- R. H. Reed, Adv. Appl. Microbiol., 2004, 54, 333–365 CrossRef CAS PubMed.
- H. Park, Y. Park, W. Kim and W. Choi, J. Photochem. Photobiol., C, 2013, 15, 1–20 CrossRef CAS.
- X. Zeng, Z. Wang, N. Meng, D. T. McCarthy, A. Deletic, J. Pan and X. Zhang, Appl. Catal., B, 2017, 202, 33–41 CrossRef CAS.
- J. J. Murcia, E. G. Ávila-Martínez, H. Rojas, J. A. Navío and M. C. Hidalgo, Appl. Catal., B, 2017, 200, 469–476 CrossRef CAS.
- M. Ge, C. Cao, J. Huang, S. Li, Z. Chen, K.-Q. Zhang, S. S. Al-deyab and Y. Lai, J. Mater. Chem. A, 2016, 4, 6772–6801 CAS.
- X. Zhou, N. Liu and P. Schmuki, ACS Catal., 2017, 7, 3210–3235 CrossRef CAS.
- Z. W. Davis-Gilbert and I. A. Tonks, Dalton Trans., 2017, 46, 11522–11528 RSC.
- S. H. Lee, H. Lee, M. Cho and Y. Lee, Chem. Commun., 2015, 51, 3391–3394 RSC.
- C. Song, L. Wang, F. Gao and Q. Lu, Chem. - Eur. J., 2016, 22, 6368–6373 CrossRef CAS PubMed.
- M. R. Hoffmann, S. T. Martin, W. Choi and D. W. Bahnemann, Chem. Rev., 1995, 95, 69–96 CrossRef CAS.
- S. G. Kumar and L. G. Devi, J. Phys. Chem. A, 2011, 115, 13211–13241 CrossRef CAS PubMed.
- Y. Wang, Q. Wang, X. Zhan, F. Wang, M. Safdar and J. He, Nanoscale, 2013, 5, 8326–8339 RSC.
- M. Ge, C. Cao, S. Li, S. Zhang, S. Deng, J. Huang, Q. Li, K. Zhang, S. S. Al-Deyab and Y. Lai, Nanoscale, 2015, 7, 11552–11560 RSC.
- Y. Hao, X. Dong, S. Zhai, X. Wang, H. Ma and X. Zhang, Chem. Commun., 2016, 52, 6525–6528 RSC.
- Y. Jia, S. Zhan, S. Ma and Q. Zhou, ACS Appl. Mater. Interfaces, 2016, 8, 6841–6851 CAS.
- T. Cao, Y. Li, C. Wang, Z. Zhang, M. Zhang, C. Shao and Y. Liu, J. Mater. Chem., 2011, 21, 6922 RSC.
- K. R. Kendall, C. Navas, J. K. Thomas and H.-C. zur Loye, Chem. Mater., 1996, 8, 642–649 CrossRef CAS.
- J. Cai, J. Huang and Y. Lai, J. Mater. Chem. A, 2017, 5, 16412–16421 CAS.
- P. Westerhoff, P. Alvarez, Q. Li, J. Gardea-Torresdey and J. Zimmerman, Environ. Sci.: Nano, 2016, 3, 1241–1253 RSC.
- E. L. Cates, Environ. Sci. Technol., 2017, 51, 757–758 CrossRef CAS PubMed.
- K. Ettrup, A. Kounina, S. F. Hansen, J. A. J. Meesters, E. B. Vea and A. Laurent, Environ. Sci. Technol., 2017, 51, 4027–4037 CrossRef CAS PubMed.
- J. Zhang, L. Huang, P. Liu, Y. Wang, X. Jiang, E. Zhang, H. Wang, Z. Kong, J. Xi and Z. Ji, J. Alloys Compd., 2016, 654, 71–78 CrossRef CAS.
- T. P. Niesen and M. R. De Guire, in Solid State Ionics, 2002, vol. 151, pp. 61–68 Search PubMed.
- V. P. Tolstoi, Russ. Chem. Rev., 1993, 62, 237–242 CrossRef.
- OECD, OECD guidelines for the testing of chemicals, 2009 Search PubMed.
- I. Arabatzis, S. Antonaraki, T. Stergiopoulos, A. Hiskia, E. Papaconstantinou, M. Bernard and P. Falaras, J. Photochem. Photobiol., A, 2002, 149, 237–245 CrossRef CAS.
- W. F. Yao, H. Wang, X. H. Xu, S. X. Shang, Y. Hou, Y. Zhang and M. Wang, Mater. Lett., 2003, 57, 1899–1902 CrossRef CAS.
- S. Burrows, K. McAughey, R. Edwards and S. Dixon, RSC Adv., 2012, 2, 3678 RSC.
- W. Guo, S. Zhang, Y. Guo, L. Ma, F. Su, Y. Guo and A. Geng, RSC Adv., 2013, 3, 4008 RSC.
- T. R. Gordon, M. Cargnello, T. Paik, F. Mangolini, R. T. Weber, P. Fornasiero and C. B. Murray, J. Am. Chem. Soc., 2012, 134, 6751–6761 CrossRef CAS PubMed.
- W. Zhou, F. Sun, K. Pan, G. Tian, B. Jiang, Z. Ren, C. Tian and H. Fu, Adv. Funct. Mater., 2011, 21, 1922–1930 CrossRef CAS.
- G. Tian, H. Fu, L. Jing, B. Xin and K. Pan, J. Phys. Chem. C, 2008, 112, 3083–3089 CAS.
- Y. Mei, Y. Su, Z. Li, S. Bai, M. Yuan, L. Li, Z. Yan, J. Wu and L.-W. Zhu, Dalton Trans., 2017, 46, 347–354 RSC.
- W. Li, P. Li, Y. Liu, B. Zhang, H. Zhang, W. Geng and Q. Zhang, ChemCatChem, 2015, 7, 4163–4172 CrossRef CAS.
- J. Hou, R. Cao, Z. Wang, S. Jiao and H. Zhu, J. Mater. Chem., 2011, 21, 7296 RSC.
- D. Hou, X. Hu, P. Hu, W. Zhang, M. Zhang and Y. Huang, Nanoscale, 2013, 5, 9764 RSC.
- Č. Jovalekić, M. Pavlović, P. Osmokrović and L. Atanasoska, Appl. Phys. Lett., 1998, 72, 1051–1053 CrossRef.
- R. C. Oliveira, L. S. Cavalcante, J. C. Sczancoski, E. C. Aguiar, J. W. M. Espinosa, J. A. Varela, P. S. Pizani and E. Longo, J. Alloys Compd., 2009, 478, 661–670 CrossRef CAS.
- Y. Nosaka and A. Y. Nosaka, Chem. Rev., 2017, 117, 11302–11336 CrossRef CAS PubMed.
- Y. Wang, S. Li, H. Shi and K. Yu, Nanoscale, 2012, 4, 7817 RSC.
- V. Etacheri, M. K. Seery, S. J. Hinder and S. C. Pillai, Chem. Mater., 2010, 22, 3843–3853 CrossRef CAS.
- R. Bajaj, M. Sharma and D. Bahadur, Dalton Trans., 2013, 42, 6736 RSC.
- D. K. Ma, M. L. Guan, S. S. Liu, Y. Q. Zhang, C. W. Zhang, Y. X. He and S. M. Huang, Dalton Trans., 2012, 41, 5581–5586 RSC.
- N. K. Eswar, P. C. Ramamurthy and G. Madras, Photochem. Photobiol. Sci., 2015, 14, 1227–1237 CAS.
- G. Odling and N. Robertson, ChemPhysChem, 2016, 17, 2872–2880 CrossRef CAS PubMed.
- A. Khenifi, Z. Bouberka, H. Hamani, H. Illikti, M. Kameche and Z. Derriche, Environ. Technol., 2012, 33, 1081–1088 CrossRef CAS PubMed.
- S. Sakthivel, B. Neppolian, M. V. Shankar, B. Arabindoo, M. Palanichamy and V. Murugesan, Sol. Energy Mater. Sol. Cells, 2003, 77, 65–82 CrossRef CAS.
- I. A. Alaton and I. A. Balcioglu, J. Photochem. Photobiol., A, 2001, 141, 247–254 CrossRef CAS.
- M. Y. Ghaly, J. Y. Farah and A. M. Fathy, Desalination, 2007, 217, 74–84 CrossRef CAS.
- M. Czaplicka, J. Hazard. Mater., 2006, 134, 45–59 CrossRef CAS PubMed.
- O. CARP, Prog. Solid State Chem., 2004, 32, 33–177 CrossRef CAS.
- M. Pelaez, N. T. Nolan, S. C. Pillai, M. K. Seery, P. Falaras, A. G. Kontos, P. S. M. Dunlop, J. W. J. Hamilton, J. A. Byrne, K. O'Shea, M. H. Entezari and D. D. Dionysiou, Appl. Catal., B, 2012, 125, 331–349 CrossRef CAS.
- K. S. Yao, D. Y. Wang, J. J. Yan, L. Y. Yang and W. S. Chen, Surf. Coat. Technol., 2007, 201, 6882–6885 CrossRef.
- J. Bogdan, J. Zarzyńska and J. Pławińska-Czarnak, Nanoscale Res. Lett., 2015, 10, 309 CrossRef PubMed.
- D. Venieri, E. Chatzisymeon, E. Politi, S. S. Sofianos, A. Katsaounis and D. Mantzavinos, J. Water Health, 2013, 11, 21–29 CrossRef CAS PubMed.
- J. Kim, C. W. Lee and W. Choi, Environ. Sci. Technol., 2010, 44, 6849–6854 CrossRef CAS PubMed.
- M. Shen and M. A. Henderson, J. Phys. Chem. Lett., 2011, 2, 2707–2710 CrossRef CAS.
- Y. Jin, D. Jiang, D. Li and M. Chen, Catal. Sci. Technol., 2017, 7, 2308–2317 CAS.
- M. Hayyan, M. A. Hashim and I. M. AlNashef, Chem. Rev., 2016, 116, 3029–3085 CrossRef CAS PubMed.
- M. Mrowetz, W. Balcerski, A. J. Colussi and M. R. Hoffmann, J. Phys. Chem. B, 2004, 108, 17269–17273 CrossRef CAS.
- K. Ishibashi, A. Fujishima, T. Watanabe and K. Hashimoto, Electrochem. Commun., 2000, 2, 207–210 CrossRef CAS.
- X. Zhang, L. Zhang, T. Xie and D. Wang, J. Phys. Chem. C, 2009, 113, 7371–7378 CAS.
Footnote |
| † Electronic supplementary information (ESI) available. See DOI: 10.1039/c7cy02549a |
| This journal is © The Royal Society of Chemistry 2018 |