
 Open Access Article
 This Open Access Article is licensed under a Creative Commons Attribution-Non Commercial 3.0 Unported Licence
Methane-to-methanol conversion over zeolite Cu-SSZ-13, and its comparison with the selective catalytic reduction of NOx with NH3†
Ramon
Oord
 ,
Joel E.
Schmidt
and
Bert M.
Weckhuysen
*
,
Joel E.
Schmidt
and
Bert M.
Weckhuysen
*
Inorganic Chemistry and Catalysis, Debye Institute for Nanomaterials Science, Utrecht University, Universiteitsweg 99, 3584 CG, Utrecht, The Netherlands. E-mail: b.m.weckhuysen@uu.nl
First published on 26th January 2018
Abstract
The direct conversion of methane into methanol is considered as one of the holy grails in hydrocarbon chemistry and recently it was found that small pore zeolites, such as Cu-SSZ-13, Cu-SSZ-16 and Cu-SSZ-39, are active for this process. Here, we propose a reaction mechanism based on spectroscopic evidence for the methane-to-methanol reaction over Cu-SSZ-13 (Si/Al = 20). Using in situ FT-IR and operando UV-vis-NIR DRS, performed on a series of different Cu–ion-exchanged SSZ-13 zeolites, both a mono-nuclear site or a dimeric copper active site are consistent with the observations of this study. These proposed active site(s) are characterized by a νOH at ∼3654 cm−1 and a charge transfer (CT) transition at ∼29![[thin space (1/6-em)]](https://www.rsc.org/images/entities/char_2009.gif) 000 cm−1. We have further evidence to complete the full catalytic cycle to methanol, including the formation of the reaction intermediate Cu(CH3)(H2O), which is characterized by overtone transitions, i.e., a 2νCH at ∼4200 cm−1 and a 2νOH at ∼5248 cm−1. We found that increasing the pre-oxidation temperature from 450 °C to 550 °C resulted in a 15% increase in methanol production, as well as a concomitant increase of the 29000 cm−1 CT transition. Furthermore, Cu-exchanged SSZ-13 zeolites, which perform well in the NH3-SCR reaction at 200 °C (the low temperature regime), also show a high activity in the methane-to-methanol reaction and vice versa, leading us to believe that this material has a similar if not the same active site for both the catalytic reduction of NO and the stepwise reaction towards methanol.
000 cm−1. We have further evidence to complete the full catalytic cycle to methanol, including the formation of the reaction intermediate Cu(CH3)(H2O), which is characterized by overtone transitions, i.e., a 2νCH at ∼4200 cm−1 and a 2νOH at ∼5248 cm−1. We found that increasing the pre-oxidation temperature from 450 °C to 550 °C resulted in a 15% increase in methanol production, as well as a concomitant increase of the 29000 cm−1 CT transition. Furthermore, Cu-exchanged SSZ-13 zeolites, which perform well in the NH3-SCR reaction at 200 °C (the low temperature regime), also show a high activity in the methane-to-methanol reaction and vice versa, leading us to believe that this material has a similar if not the same active site for both the catalytic reduction of NO and the stepwise reaction towards methanol.
Introduction
The economic activation of methane is one the holy grails of hydrocarbon chemistry as the chemical nature of methane makes it very hard to selectively transform it into any chemical, such as methanol. The cleavage of a C–H bond requires high activation energy, making high reaction temperatures or highly reactive substrates a necessity for the activation of methane. Another challenge is avoiding over oxidation as the partial oxidation of methane often leads to the formation of CO2, even at low conversions.1–8 Schoonheydt and coworkers have shown that Cu-based zeolites are very active in activating methane at low reaction temperatures and produce partial oxidation products, including methanol and formaldehyde, after contact with water.5,7–16 Most efforts so far have been focused on the behavior of Cu-ZSM-5 zeolites, although other large pore zeolite structures, such as mordenite and beta, are reported to be active for the direct activation of methane as well.The methane activation procedure over Cu-based zeolite materials consists of four basic steps, which need to be recycled: i) oxidation of the zeolite-based material with oxygen or N2O; ii) introducing methane into the zeolite material; iii) addition of water, which can be done in either the liquid or gas phase, to obtain the reaction products, such as methanol; iv) re-establishing the initial state of the material through high-temperature regeneration, which may be combined with step i. This procedure leads to relatively low amounts of side products, but the main drawback is that it is in essence a stepwise process (i.e., a one turnover process), and not a catalytic cycle in which the active site is repeatedly regenerated.9 van Bokhoven et al. have recently presented a direct stepwise method for converting methane into methanol with high selectivity over a copper-containing zeolite, based on partial oxidation with water, but this still is stepwise and not a continuous process.17
Identification of the active site in copper zeolites is still a much-debated topic.18 Schoonheydt et al. were the first to report that Cu-based zeolite materials (Cu-ZSM-5 and Cu-MOR) could activate methane-to-methanol, and using UV-vis proposed a comparison to the pMMO enzyme in that the methane activating core was a dinuclear bis(μ-oxo)dicopper species.8,19 Schoonheydt, Sels, Solomon, and coworkers, later proposed the methane-activating core to be a mono(μ-oxo)dicopper(II) species identified using resonance Raman spectroscopy and DFT calculations.13,20 More recently Grundner et al. proposed a trinuclear copper-oxo cluster in Cu-ZSM-5, based on theoretical analysis supported by EXAFS analysis.21,22 For Cu-MOR, Vanelderen et al. proposed two distinct [Cu–O–Cu]2+ sites to be responsible for methane activation.23 These sites are believed to be at two separate locations; one at the intersection of the side pocket with the 12 MR channel, and the other at the intersection of the side pocket with the 8 MR channel, a trinuclear copper-oxo cluster was also proposed as the active site on Cu-MOR.21 Tomkins et al. however, conclude, based on their in situ EXAFS study on Cu-MOR, that the active sites are small dehydrated clusters of copper oxides, and do not necessarily need to be di- or tri-copper sites.24 They found no proof of spectroscopic signatures assigned to μ-oxo copper species, which would show up around 20000 cm−1. They did however see a band appear at 13500 cm−1 and possibly a shoulder at 16750 cm−1, which are both consistent with Cu2+ species. They also find very small particles using TEM on samples active in oxygen at 200 °C, suggesting Cu-agglomeration.
Wulfers et al. investigated different types of Cu-exchanged zeolites and zeotype materials, showing that small pore zeolites and related materials, such as Cu-SSZ-13, Cu-SSZ-16, Cu-SSZ-39 and Cu-SAPO-34, also produce methanol from methane and water.9 For the small pore zeolites, the state and location (e.g., mono-, di- or tri-nuclear25 copper sites) are still unclear, but it is possible that the active site is the same as the active site for the low temperature catalytic NOx decomposition.9,26 In another study Kulkarni et al. showed with their DFT study that for 8MR zeolites the active site might also be a mono-nuclear site; in the form of a Cu(OH)+ species, although they indicate that <11% of the total species are in the form of [Cu(OH)]+, making Cu(OH)+ species a minority species and consequently difficult to identify.27 Very recently, Ipek et al. identified trans-μ-1,2-peroxo dicopper(II) ([Cu2O2]2+) and mono-(μ-oxo) dicopper(II) ([Cu2O]2+) using synchrotron X-ray diffraction, in situ UV-vis, and Raman spectroscopy and theory calculation for Cu-SSZ-13 and Cu-SSZ-39. (Si/Al = 12).28
We experimentally show that plausible active sites in Cu-SSZ-13 (Si/Al = 20) for methane into methanol activation can be a mononuclear Cu2+ site as well as a dimeric copper species, as discussed above. To enable this conclusion, zeolite SSZ-13 materials were ion exchanged with Cu2+ using slight variations in the exchange procedure; which resulted in differences in copper loadings as well as preferential cation locations. To study the influence of the exchange process during the methane-to-methanol reaction, all materials were analyzed using operando UV-vis spectroscopy as well as separately conducted in situ UV-vis-NIR diffuse reflectance spectroscopy and in situ FT-IR spectroscopy. Furthermore, a link has been established between low temperature NH3-SCR of NO activity at 200 °C and the TON for methane-to-methanol production, further strengthening the hypothesis that either a mononuclear copper site or a dimeric copper site are responsible for methane activation. This combined information allowed us to postulate a reaction pathway during relevant reaction conditions, including the formation of a plausible reaction intermediate, Cu(CH3)(H2O).
Experimental
Cu-exchanged zeolite synthesis
The method used has been adapted from Lezcano-González et al.29 A 25% wt solution of the structure directing agent (SDA, N,N,N-trimethyl-1-adamantammonium) (Sachem, pure) was added to tetra-ethyl orthosilicate (TEOS, Aldrich, >99%) and aluminum isopropoxide (Acros Organics, 98%+). The resulting mixture was aged at RT (∼4 days). After this a 51% HF solution (Acros organics, 48–51%) was added and stirred into a homogeneous gel. The gel was transferred into three Teflon lined autoclaves, in equal portions. Autoclaves were sealed and put in a static oven at 150 °C for 6 days. After the synthesis was finished, the resulting solid was washed thoroughly (∼8 L) with demineralized water. The resulting solid was a white powder. Calcination was performed in a static oven with the following temperature program: heat from room temperature to 150 °C in 2 h 10 min, hold for 1.5 h, then heat to 350 °C over 1.5 h with a 3 h hold, then heat to 580 °C over 4 h 50 min and hold for 3 h and finally cool to room temperature. Crystallinity was evaluated with XRD. The resulting Si/Al ratio was 20, as determined with inductively coupled plasma-optical emission spectroscopy (ICP-OES). The micropore area of the parent H-SSZ-13 zeolite was 900 m2 g−1, as determined by applying the t-plot on the Ar-physisorption data. The micropore volume was determined to be 0.36 mL g−1.To gain the Na form of the zeolite a three-fold ion exchange with 1.0 M NaNO3 (Acros organics, 99%+ for analysis ACS) (20 mL g−1) was performed for 2 h at 75 °C. The sample was then washed with deionized water, followed by another calcination at 550 °C for 2 h in air, using a ramp of 5 °C min−1. Copper ion exchange was performed using different amounts of H-SSZ-13 or Na-SSZ-13 using either CuSO4·5H2O (Merck ACS, ISO, Reag. Ph Eur) or Cu(II)acetate·H2O (Sigma-Aldrich, puriss p.a.). The exact exchange details can be found in Table 1, which also provides an overview of the different Cu-SSZ-13 materials under study. After each procedure, the resulting Cu-SSZ-13 material was washed with demineralized water and dried at 60 °C overnight. Calcination was performed in a static oven with the following temperature program: heat from room temperature to 120 °C in 1 h, hold for 30 min, then heat to 550 °C over 7 h 10 min and hold for 4 h and finally cool to room temperature.
| Sample code | Na or H | Precursor | Molarity (mol L−1) | Temperature (°C) | Liquid/solid (ml g−1) | Duration (h) | %wt Cu |
|---|---|---|---|---|---|---|---|
| Cu-1.50-Na | Na (full 3× exchange) | Cu(II) acetate | 0.002 | RT | 317 | 16 | 1.5 |
| Cu-1.38-Na | Na (full 3× exchange) | CuSO4 | 0.1 | 80 | 50 | 2 | 1.38 |
| Cu-1.21-Na | Na (full 3× exchange) | CuSO4 | 0.05 | 80 | 50 | 2 | 1.21 |
| Cu-1.15-Na | Na (full 3× exchange) | CuSO4 | 0.025 | 80 | 50 | 2 | 1.15 |
| Cu-1.14-H | H | CuSO4 | 0.1 | 80 | 50 | 2 | 1.14 |
| Cu-1.03-Na | Na (full 3× exchange) | CuSO4 | 0.1 | RT | 1000 | 16 | 1.03 |
| Cu-0.95-Na | Na (full 3× exchange) | CuSO4 | 0.1 | 60 | 1000 | 16 | 0.95 |
| Cu-0.93-Na | Na (full 3× exchange) | Cu(II) acetate | 0.0011 | RT | 317 | 16 | 0.93 |
| Cu-0.91-Na | Na (1× partial exchange) | CuSO4 | 0.1 | 80 | 50 | 2 | 0.91 |
In this work, a series of Cu-exchanged zeolites have been prepared, using different ion exchange methods. Table 1 summarizes the Cu-SSZ-13 samples under study, including their sample code, preparation procedure and corresponding copper loading. The as-prepared H-SSZ-13 zeolite material used for the preparation of the Cu-based SSZ-13 zeolites exhibits a typical XRD CHA pattern, as illustrated in Fig. S2A,† confirming the good crystallization and phase purity of the starting H-SSZ-13 material. Note that the reflections appear at different 2 theta values than usual, since we are using a Co X-Ray source instead of the widely used Cu X-Ray source. The incorporation of Na or Cu did not result in any obvious modifications to the CHA structures (Fig. S2A†), with only small lattice parameter changes due to the increased size of the counter cation. No copper (or copper oxide) peaks were detected in the XRD patterns after copper exchange. NH3-TPD measurements were taken to probe the acidity of the zeolite (Fig. S2B†). In previous studies,30–32 the low temperature peak (LT) is assigned to weakly absorbed NH3, such as physisorbed NH3 and NH3 adsorbed on weak Lewis acid sites. The high temperature peak (HT), starting around 350 °C, is assigned to NH3 adsorbed on Brønsted acid sites. NH3-TPD shows a disappearance of the HT peak after ion exchange with Na, as this will remove the Brønsted acidity. The Cu/Al ratios of the different Cu-SSZ-13 samples were determined by inductively coupled plasma (ICP-OES), which showed copper loadings between 0.9 and 1.3 wt%, and resulting Cu/Al ratios of 0.5–0.9, as summarized in Table 1.
Cu-exchanged zeolite characterization
X-ray diffraction (XRD) patterns of as-synthesized, calcined and Cu-exchanged samples were recorded on a Bruker D2 X-ray powder diffractometer instrument equipped with a Co Kα X-ray tube (λ = 1.7902 Å).UV-vis-NIR diffuse reflectance spectroscopy (DRS) was collected using a Varian Cary 500 UV-vis-NIR spectrometer equipped with a DRS accessory to allow collection in the diffuse reflectance mode, against a pure white reference standard. The spectra were collected between 4000–50000 cm−1 with a data interval of 10 cm−1 and at a scanning rate of 6000 cm−1 min−1. The UV-vis-NIR DRS spectra were corrected for the detector/grating and light source changeover steps at 11400, 12500 cm−1 and 28570 cm −1, respectively.
Inductively coupled plasma-optical emission spectrometry (ICP-OES) was measured using a SPECTRO CIROSCCD instrument. Samples were first dissolved using an aqua regia with HF solution at 90 °C overnight, after which it was cooled down to RT and neutralized using boric acid. After this the solutions were diluted to yield the appropriate concentrations.
Temperature programmed desorption of ammonia (NH3-TPD) was performed on a Micromeritics Autochem II 2920 equipped with a TCD detector. Prior to TPD, 0.1 g of Cu-exchanged zeolite was first out gassed in He for 1 h at 600 °C with a heating ramp of 10 °C min−1. Ammonia was adsorbed at 100 °C until saturation, followed by flushing with He for 120 min at 100 °C. The ammonia desorption was monitored using the TCD detector until 600 °C with a ramp of 5 °C min−1, using a flow of 25 mL min−1.
A Perkin-Elmer 2000 FT-IR instrument and a high temperature flow through cell equipped with KBr windows were used to obtain in situ FT-IR spectra. The sample (∼15 mg) was ground and pressed into a self-supported wafer. The Cu-exchanged zeolite wafer was placed in a holder for transmission FT-IR measurements. For each spectrum, 32 scans were recorded with a 4 cm−1 resolution. Samples were dehydrated in a flow of either O2 or He for 2 h, while the measurements were taken at 150 °C. For sake of clarity, absorption values are normalized to sample pellet weights.
Ar physisorption on the parent material was performed with an automated gas sorption system, Micromeritics TriStar 3000. Before the measurements, the samples were outgassed for 16 h at 380 °C under vacuum. Measurements were performed using Ar at −196 °C. The external surface area, micropore surface area and micropore volume were determined by applying the t-plot method.
Methane-to-methanol conversion
UV-vis-NIR DRS experiments were performed in a specially designed quartz reactor equipped with a UV-vis-NIR transparent window. The spectra were taken on a Cary 500 UV-vis-NIR DRS spectrophotometer equipped with an integration sphere. Before reaction the samples (∼0.3 g) were calcined in dry O2 (30 mL min−1) at 450 or 550 °C (heating ramp of 5 °C min−1). After calcination, the samples were cooled to RT and a UV-vis-NIR DRS spectrum was measured. Subsequently, the samples were heated to 200 °C in methane (20 mL min−1) and kept at that temperature for 60 min. After reaction with methane, another UV-vis-NIR DRS spectrum was taken. The samples were then exposed to water vapor at 200 °C using a flow of N2 as carrier gas through a saturator containing water at 20 °C. After this treatment, another UV-vis-NIR DRS spectrum was taken, and the sample was exposed to the atmosphere overnight at RT to regain the hydrated form of the zeolite, after which a UV-vis-NIR DRS spectrum was collected.In another series of experiments, catalytic testing and operando UV-vis spectroscopy experiments were simultaneously performed in a specially designed quartz fixed-bed reactor equipped with a UV-vis transparent window. Details of the experimental set-up can be found in several publications of our group.33–37 The overall reaction procedure consists of three steps; oxidation of the zeolite-based material (16 mL min−1 O2) at 450 or 550 °C (heating ramp of 5 °C min−1, hold for 2 h), after which the sample is cooled down to 60 °C. At 60 °C the flow is switched to methane in N2 (6 mL min−1 methane in 10 mL min−1 N2). After 20 min, the temperature is increased to 200 °C (heating ramp of 5 °C min−1). After 20 min at this temperature, the flow is switched to N2 as carrier gas through a saturator containing water at 20 °C, to perform a gas phase extraction of the methanol. Operando UV-vis spectra were obtained using an AvaSpec 2048 L spectrometer (Avantes, 2048 pixel 200 μm CCD detector, 200–1100 nm) connected to a high-temperature UV-vis optical fiber probe (Avantes, 7 × 400 μm fibers), which was used to collect the operando spectra in reflection mode. On-line analysis of the reactants and reaction products was performed using an Interscience Compact GC, equipped with an Rtx-wax and Rtx-1 column in series and an Rtx-1, Rt-TCEP and Al2O3/Na2SO4 in series, both connected to an FID detector. To avoid condensation in the reaction system, all gas lines were heated to 150 °C.
Selective catalytic reduction of NO with NH3
Catalytic tests were performed in a fixed bed plug flow set up. Typically, 50 mg of powdered material (sieve fractions of 0.425–0.150 mm) was loaded in a 1 cm OD quartz tubular reactor. Prior to the experiment, the zeolite sample was pre-treated for 1 h with 5% O2 in He at 550 °C. After the pre-treatment, the desired reaction temperature was fixed and the material was exposed to a SCR feed composition of 1000 ppm NO, 1000 ppm NH3 and 5% O2, using He as balance, with a Gas Hourly Space Velocity (GHSV) of 100000 h−1. Steady-state activity measurements were performed at different reaction temperatures, from 150 to 450 °C, using a stabilization period of 60 min at each temperature and analyzing the output gases by mass spectrometry (Hiden Analytical, HPR-20 QIC) and FT-IR gas analysis. All gases used were provided by Linde. To avoid condensation in the reaction system, all gas lines were heated to 150 °C. The following calculations were used to calculate respectively the NO conversion and N2 selectivity:

Results and discussion
In what follows, we will first present the operando UV-vis spectra during the stepwise methane-to-methanol reaction, and then correlate these results with the NH3-SCR catalytic activity. After that we will study the active state of copper with UV-vis-NIR-DRS, using a spectrophotometer which is also capable measuring over a wider range (including the valuable NIR-region) as the operando UV-vis spectrophotometer. The operando measurements have the advantage that we measure during the reactions at elevated temperature, while the UV-vis-NIR-DRS spectrophotometer is done at RT after one of the reactions steps, but yielding better quality spectra and we also gain NIR-spectra. We will conclude with additional FT-IR data.Operando UV-vis spectroscopy
Operando UV-vis spectra were collected during all three steps of the cycling experiments to gain insight into changes in the spectra during the methane-to-methanol reaction. Fig. 1A and C shows the operando UV-vis spectra of one Cu-SSZ-13 sample (Cu-1.21-Na) during the pre-oxidation step in the methane-to-methanol reaction, using a heating rate of 5 °C min−1 from RT up to 450 °C. The time interval between two spectra is 1 min or a temperature difference of 5 °C. The arrow represents the temperature evolution. A band emerges at 29000 cm−1 during the oxidation step of the reaction. After flowing methane over the Cu-exchanged zeolites (Fig. 1B and D), the band at 29000 cm−1 decreases. Smeets et al. have reported similar behavior with Cu-ZSM-5, though for a different band.19Fig. 1B and D show the operando UV-vis spectra during the addition of methane to Cu-1.21-Na while ramping the temperature from 60 °C to 200 °C (one spectrum per min, 68 min in total), in which it is clear that the band at 29000 cm−1 diminishes upon contact with methane. Fig. 1E shows the temperature program during the experiment and Fig. 1F shows the corresponding development of the d–d band at 16400 cm−1 as well as the band at 29000 cm−1 over time. It is clear that the band at 29000 cm−1 sharply diminishes in intensity at 200 °C in the methane flow, while the d–d band at 16400 cm−1 only shows minor changes.
 | ||
| Fig. 1 Operando UV-vis spectra of the Cu-1.21-Na Cu-exchanged zeolite, a measurement was taken every minute, the arrow represents the time evolution A) and C) during O2 activation from RT to 450 °C (1 scan during every 5 °C) B) and D) during methane addition from at 60 to 200 °C (68 min or 68 scans are shown), arrows indicate the time evolution, the green spectrum is the starting point of the experiment, while the red spectrum is the endpoint. E) Shows the temperature versus time for the operando experiment, while F) shows the development of the d–d band (16400 cm−1) as well as the development of the 29000 cm−1 band versus time. | ||
The same experiment was also performed using He instead of O2, to show that an oxidant is necessary in the activation step, and the UV-vis spectra during the heat treatment can be found in Fig. S1.† Initially, it appears that there is still a band developing at 29000 cm−1, however, while maintaining that temperature and upon cooling down, this band diminishes, as is clear from Fig. S1D† (compare Fig. 1D to S1D or see Fig. S3†). Upon addition of methane, we do see some changes in the UV-vis spectra, but no appreciable change at the 29000 cm−1 absorption, in contrast to the results in the O2 experiment. It is known that copper can auto-reduce in the presence of He,38,39 which might occur in the activation step of this experiment, as the d–d region shows a weaker absorption. In our experiments we found that an oxidizing agent is needed to create the active site for methane-to-methanol activation in Cu-SSZ-13 as we did not observe any methanol product in the absence of the oxidant, and here we present spectroscopic results to explain the underlying reasons for these phenomena. This result is different from Ipek et al. who show that show the active site can be generated in both O2 as well as He in Cu-SSZ-13, and we are unable to account for this based on our experimental findings.28
A similar experiment was performed using 550 °C as the pre-oxidation temperature. Upon reaching 550 °C, the band at 29000 cm−1 has a higher absorption compared to the Cu-exchanged zeolite at 450 °C (ESI,† Fig. S3D). From the online GC data, we know pre-oxidation at 550 °C increases the methanol production, as summarized in Table 1. Since we are measuring using operando conditions, linking these results directly shows that the UV-vis absorption at 29000 cm−1 is directly correlated with the production of methanol. A comparison of Fig. S3B and D† clearly shows that the band at 29000 cm−1 is more pronounced when we heat the Cu-exchanged zeolite to 550 °C than 450 °C, and in both cases the band diminishes upon contact with methane.
Methanol production and catalytic testing
In our investigations, all Cu-SS-13 materials described in Table 1 have been tested for methane-to-methanol activity, as well as low temperature NH3-SCR catalytic activity. Fig. 2 shows methanol production versus time after admission of water vapor at 200 °C, while Fig. 3 shows the NH3-SCR conversions. The total amount of methanol produced is given in Table 2. Before extracting the product, the copper zeolites were oxidized at 450 °C in pure O2, after which methane was added to the material. The exact temperature program can be found in Fig. 1E. It can be concluded that all Cu-SSZ-13 zeolites released methanol over a period of about 100 min. Methanol is only released after the addition of water vapor, in agreement with earlier investigations, and the turnover numbers (TON) for the Cu-exchanged zeolite materials under study are very similar to those reported in literature.9 Our TON numbers are in the range of 0.028–0.045 mol MeOH per mol Cu, which are in good agreement with the values of Wulfers et al. (0.03–0.06).9 Furthermore, it was observed that Cu-SSZ-13 zeolites exchanged with higher copper loadings produce more methanol per gram of Cu-exchanged zeolite (Fig. 2 and Fig. S6,† and Tables 1 and 2), though the TON only vary between 0.033 and 0.045. This observation could be due to different ion-exchange positions being occupied at higher ion-exchange levels and different ion-exchange procedures. At higher ion-exchange levels Cu-dimers are more likely to be formed in a random distribution due to the closer proximity of the Cu-ions. One Cu–H-SSZ-13 sample has been measured, and it behaves similarly to the Cu–Na-SSZ-13 samples, if one considers the exact copper loading of this sample. | ||
| Fig. 2 A) The concentration of methanol in the effluent stream versus time-on-stream after admission of water vapor (which occurred at relative time = 0 min). The pre-oxidation temperature was 450 °C, desorption of the methanol at 200 °C, for the various Cu-exchanged zeolites. B) Amount of produced methanol expressed as μmol g−1 Cu-exchanged zeolite versus the pre-oxidation temperature for Cu-0.95-Na, illustrating that a rise in pre-oxidation temperature results in an increased methanol production. The results are based on methanol desorption at a temperature of 200 °C. | ||
 | ||
| Fig. 3 Steady state NO conversions, 50 mg Cu-exchanged zeolite, 1000 ppm NO, 1000 ppm NH3, 5% O2, balanced by He, GHSV 100000 h−1. | ||
| Name | Methanol (μmol g−1) 450 °C | TON (mol mol−1) 450° | Methanol (μmol g−1) 550 °C | TON (mol mol−1) 550 °C |
|---|---|---|---|---|
| ND = not determined. | ||||
| Cu-1.50-Na | 7.578 | 0.033 | ND | ND |
| Cu-1.38-Na | 7.610 | 0.036 | ND | ND |
| Cu-1.21-Na | 8.248 | 0.045 | 9.04 | 0.049 |
| Cu-1.15-Na | 7.192 | 0.041 | ND | ND |
| Cu-1.14-H | 6.301 | 0.036 | 7.55 | 0.043 |
| Cu-1.03-Na | 5.283 | 0.034 | ND | ND |
| Cu-0.95-Na | 4.921 | 0.034 | 7.48 | 0.052 |
| Cu-0.93-Na | 5.425 | 0.038 | ND | ND |
| Cu-0.91-Na | 4.660 | 0.034 | ND | ND |
Most Cu-zeolites under study have been pre-treated at temperatures around 450 °C to yield the active state of the Cu-exchanged zeolite.9,25,40 It was found that for the samples we tested that increasing the pre-oxidation temperature from 400 to 450 to 550 °C using dry O2 resulted in increasing methanol production. Fig. 2B shows this increase in methanol production for the Cu-0.95-Na Cu-exchanged zeolite, which is ∼15% increase in μmol methanol g−1 zeolite, when going from 400 to 550 °C (Table 2). Recently, Ipek et al. showed that increasing the pre-oxidation temperature from 200 to 550 °C with N2O as oxidant for Cu-SSZ-13 increased the methanol production significantly, and our results are consistent with this observation as shown in Fig. 2B and Table 2.41 After activating the samples in He instead of O2, methanol levels were below the detection limit of the GC. This again contrasts with the results of Ipek et al.,28 but is in line with the results of Pappas et al., who showed a much lower methanol production upon activation with just He.42
All synthesized Cu-SSZ-13 samples have also been tested for their activity in the low temperature NH3-SCR of NOx reaction, and the results can be found in Fig. 3. NO conversions of the better performing catalysts are typical for these catalysts.43–45 Both Cu-0.93-Na and Cu-1.50 show conversions below what is normally seen for these catalysts. Examining the UV-vis-NIR-DRS results of the hydrated samples explains this result as both contain a large amount of CuxOy species, which are known to be responsible for unselective NH3-oxidation, with a detrimental influence on the NH3-SCR of NOx reaction.46
Comparison of catalytic data between methane-to-methanol activation and NH3-selective catalytic reduction (SCR) of NOx
The copper weight loading for the SSZ-13 zeolite is plotted versus the amount of methanol produced per gram Cu-exchanged zeolite, as well as the NO conversion (at 200 °C) in Fig. 4. The general trend that is visible in this graph is that higher copper weight loadings in the zeolite leads to both higher NO conversion as well as methanol production. One possible explanation for this increase with increasing copper content could be that more ion exchange positions are being filled, including the specific sites needed for methane-to-methanol activation, leading to a higher methanol production. At higher ion-exchange levels, Cu-dimers are also more likely to be found, but these two effects are not easily separated. | ||
| Fig. 4 μmol methanol produced g−1 Cu-exchanged zeolite (left axis, squares) and NO conversion (right axis, stars) plotted vs. the calculated amount of copper atoms per cage. The straight lines are added as a visual guide. | ||
Fig. 4 demonstrates the correlation between activity in the NH3-SCR reaction at 200 °C and activity in the methane-to-methanol reaction, leading us to believe that this material has a similar if not the same active site(s) for both reactions. For low temperature NH3-SCR it is already known that there is more than one type of active site, including both mononuclear sites as well as Cu-dimeric sites, and [Cu(OH)]+ could be one of these.47,48 Our data shows that this is likely the case for the methane-to-methanol reaction, that more than one active site exists. Paolucci et al. demonstrated that under low temperature NH3-SCR reaction conditions that mobilized copper ions can travel through zeolite windows and form transient ion pairs that participate in an O2-mediated Cu(I) → Cu(II) redox step.48 This type of behavior was not reported before and might also have an influence on our understanding of the active site for the methane-to-methanol reaction, and suggests that there may be a highly dynamic and transient nature to the active site, underscoring the necessity of operando studies to unravel the nature of the active site in action. The direct consequence for this paper is that we cannot distinguish monomeric Cu(OH)+ sites from dimeric copper species like (Cu2O2)2+ and (Cu2O)2+ under these reaction conditions, though it is likely that both may be present and active. As is apparent from our turn over numbers (TON), only a small fraction of the copper participates in this reaction.
UV-vis-NIR diffuse reflectance spectroscopy
An additional set of measurements were performed on a more advanced spectrophotometer, which allowed us to measure the samples on a UV-vis-NIR DRS spectrophotometer in the full spectral range of 4000–50000 cm−1, but operando measurements are not possible using this spectrophotometer. Using UV-vis-NIR DRS spectroscopy the state of the copper inside the zeolite framework can be determined. UV-vis-NIR DRS was measured on both hydrated and dry O2 activated Cu-exchanged zeolites (Fig. 5 and Fig. S4, ESI†). Giordanino et al.11 assigned transitions in the range of 20000–11000 cm−1 to d–d transitions, and the transitions between 50000 and 29000 cm−1 to CT transitions, and their band positions can be found in Table 3.46 In hydrated form, it is clear that after the ion exchange with copper, a large portion of the copper is in the Cu2+ isolated state, which is characterized by a Cu2+ d–d transition at ∼12000 cm−1 and a charge transfer band at 47000 cm−1.49 The band at ∼39000 cm−1 is normally attributed to the formation of CuxOy species, and with increasing ion-exchange levels we see an increase in this UV-vis band, and especially for Cu-1.50-Na and Cu-0.93-Na samples.50 These CuxOy species are not active in the SCR of NOx and are responsible for nonselective ammonia oxidation. Depending on the ion exchange procedure, this ∼39000 cm−1 band may or may not be present in the synthesized zeolites, (meaning the presence of more CuxOy species) but it gives a good starting point for methane-to-methanol activation studies, since it is not fully known which copper species are required for this reaction. Some bulk-like CuO species can be seen in the range 35000–40000 cm−1.26 Due to the removal of water as ligands around the copper, the spectra change significantly upon dry oxygen activation. The d–d quadruplets (20000, 16570, 13680 and 11400 cm−1) are due to highly distorted Cu2+ sites upon dry oxygen activation. Weak bands/shoulders arising at around ∼32000 and ∼29000 cm−1 are found upon dry O2 activation together with a dark blue color upon dry O2 activation, something that was earlier observed by Gao et al.51 and Giordanino et al.11 They suggested that the dark blue color and bands are due to double O-bridged di-copper formation upon the dry O2 activation, and when water is present again, it goes back to hydrated Cu2+ monomers.
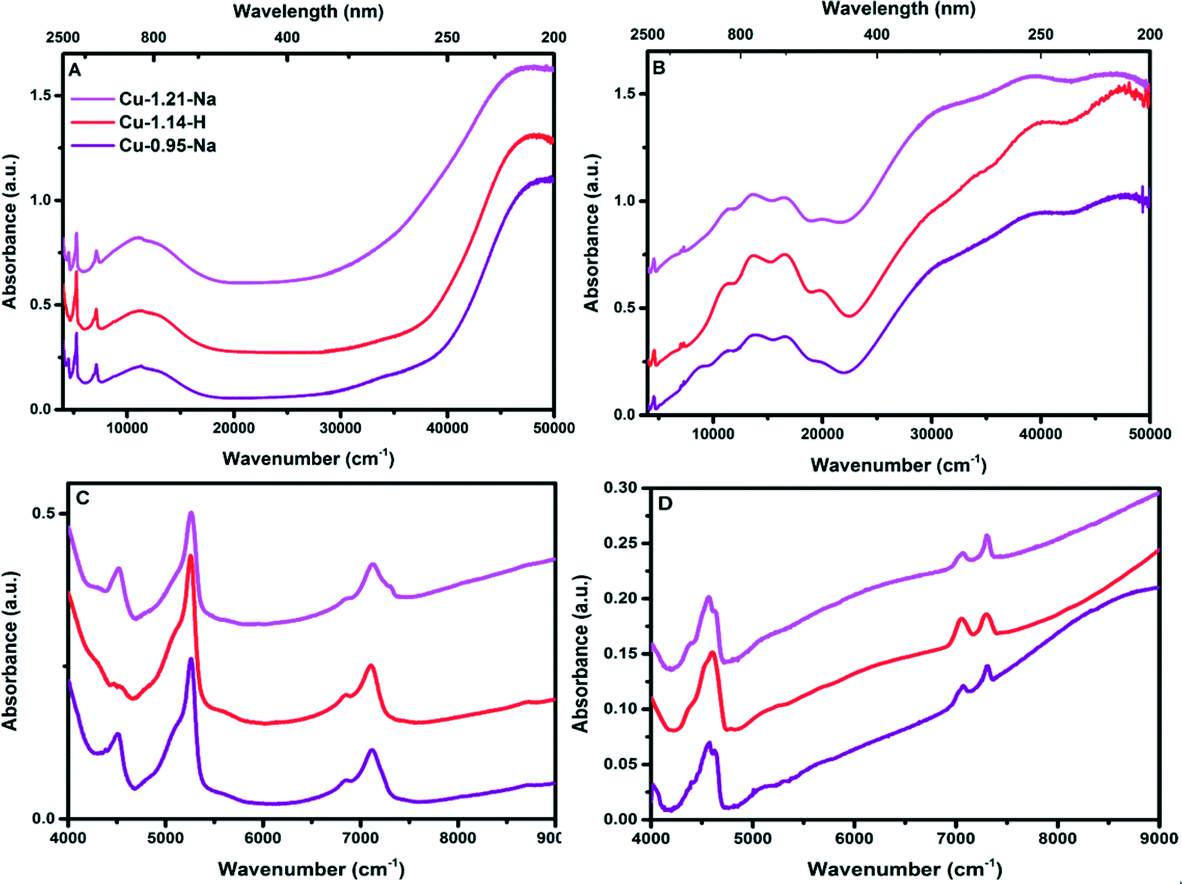 | ||
| Fig. 5 (A) UV-vis-NIR DRS spectra of Cu-SSZ-13 in hydrated form. B) UV-vis-NIR DRS spectra of Cu-SSZ-13 after dehydration using dry O2 at 450 °C for 2 h. C) and D) NIR zoom in of the UV-vis-NIR DRS spectra of the Cu-exchanged zeolite C) hydrated spectra, D) dehydrated spectra. The UV-vis-NIR-DRS spectra of all samples can be found in Fig. S4 (ESI†). | ||
| Sample | Transitions (cm−1) | |||||||
|---|---|---|---|---|---|---|---|---|
| a d–d transition. b Ligand-to-metal charge transfer. c Charge transfer. These bands are based on the spectra presented in Fig. 5 and S4 (ESI). | ||||||||
| Cu-SSZ-13 hydrated | 12000a |
48000b |
39000 |
|||||
| Cu-SSZ-13 O2 activated | 20000 |
16570 |
13680 |
11400 |
48300 |
39470 |
34000 |
29400 |
| Cu-SSZ-13 (O2 activated)11 | 19700a |
16500a |
13600a |
11000a |
48000b |
40500c |
32000c |
29000c |
It has also been proposed that the extra bands at ∼29000 cm−1, in the case of Cu-SSZ-13, are due to the presence of either highly distorted CT transitions, or planar or bis(μ-η2:η2 peroxo) di-copper species ([Cu2(μ-η2:η2-O2)]2+).20 Combining these hypotheses with our results suggests that Cu-dimers might be the active site for methanol activation. Grundner et al., suggested that for Cu-MOR a broad band at 31000–32000 cm−1 belongs to a proposed trinuclear CuxOy complex, which is proposed to be the active site.25 We doubt the trinuclear CuxOy complex would fit in the SSZ-13 cage, and in all our samples no clear band at 31000–32000 cm−1 could be detected, making it unlikely the trinuclear CuxOy complex is responsible for the absorptions noted in the spectral region for Cu-SSZ-13 (29000 cm−1). We do not find any evidence for the formation of mono(μ-oxo) dicopper species (25000 cm−1) from UV-vis-NIR analysis on O2 activated Cu-SSZ-13 samples as well as in situ measurements during O2 activation, in agreement with Giordano et al.11,52
A more detailed view on the NIR region of the UV-vis-DRS spectrum can be found by comparing Fig. 5C and D and S4C and D,† as well as Table 4. This is the region where overtones and combination bands appear,11 which is a useful area if one wants to focus on the OH groups of the supports, as well as any C–H overtone vibrations which might arise during the addition of methane. In the hydrated state of the Cu-SSZ-13 spectra, the NIR region is dominated by the different combination and overtone bands of water and OH groups belonging to the zeolite. The pronounced band at 5240 cm−1 is normally assigned to the bending of bulk water (ν01OH + δ01H2O). All NIR overtone and combination bands are summarized in Table 4.53 The band at around 4540 cm−1 is ascribed to an OH combination band (ν01O1H + δ01O1H). During the oxygen activation, bands appearing and disappearing in the NIR region can easily be assigned to removal of water from the pores of the framework of the Cu-exchanged zeolite as bands for bulk water and water coordinated to copper are diminishing.
| NIR abs. (cm−1) | Assigned to ref. 53, 54 | NIR abs. (cm−1) | Assigned to ref. 53, 54 |
|---|---|---|---|
| 4546 | ν 01O1H + δ01O1H | 5980 | ν symCH3 (ν1) |
| 5060 | ν + δ01H2O adsorbed on Cu2+ | 6065 | ν a-symCH3 (ν1) |
| 5248 | ν 01OH + δ01H2O bending bulk water | 5213 | ν + δ01H2O |
| 6838 | ν 02H2O adsorbed on Cu2+ | 4200 | νCHx (ν +δ) |
| 7070 | ν 02OH (silanol) | 4300 | νCHx (ν + δ) |
| 7122 | ν 02O1H (Brønsted)/bulk water (∼7020) | ||
| 7313 | ν 02OH terminal (silanol) |
During the operando experiment, He activation instead of O2 activation leads a much less pronounced 29000 cm−1 band, as is evident from Fig. 6. Together with less pronounced 29000 cm−1 band, the d-d region also shows a much lower absorption. This could very well be due to auto-reduction of the Cu2+ (d9) species towards Cu+ (d10) species, which would not give a d–d transition.
 | ||
| Fig. 6 Dehydration of the Cu-1.14-H zeolite monitored by UV-vis-NIR DRS. The sample was thermally treated by flowing 100 ml min−1 of either 100% He or O2 for 2 h at 450 °C. Δabs = 0.12. | ||
A new set of measurements were performed in a different catalytic reactor, for which it was possible to isolate it from the outside atmosphere after reaction and cooling, allowing us to measure the samples on a UV-vis-NIR DRS spectrophotometer in the full spectral range of 4000–50000 cm−1. The resulting spectra are shown in Fig. 7. For these sets of in situ experiments, the samples were first oxidized in pure O2 at 450 °C for 2 h, then a UV-vis-NIR DRS spectrum was taken at RT, and consequently the same samples were exposed to methane at 200 °C for 2 h, without exposure to the atmosphere. Using this approach, we found that after the addition of methane a decrease of intensity in the absorption band at ∼29000 cm−1 occurred, but together with this a few new absorption bands arose in the NIR region. The new vibrations in the NIR can be found in Fig. 7B, and can all be assigned to CHx species. The absorptions at 5980 and 6065 cm−1 were assigned to CH3 sym- and anti-symmetrical overtone vibrations (Table 4), showing that CH3 groups are present on the Cu-exchanged zeolite. Together with the CH3 overtone vibrations we also observe bands appearing in the 4200–4300 cm−1 range, which we assign to the combination bands of different CHx vibrations.54 Another interesting band is around 5213 cm−1, which can either be assigned to water or C![[double bond, length as m-dash]](https://www.rsc.org/images/entities/char_e001.gif) O.54 CO is very unlikely since all the CH bonds must be broken, which would require a high energy input, and would most likely result in over-oxidation of methane into either CO or CO2. However, for Co-ZSM-5 formaldehyde was detected by Beznis et al., so CO cannot be ruled out completely,55 though we could not observe any formaldehyde formation. According to Kulkarni et al., Cu(CH3)(H2O), is an intermediate in the activation of methane on the Cu(OH)+ site, and here we show experimental evidence for this proposed intermediate.27 Combining this with the previously observed Cu-dimers after O2-activation, both active sites are consistent with the results, but cannot be distinguished by UV-vis spectroscopy alone.
O.54 CO is very unlikely since all the CH bonds must be broken, which would require a high energy input, and would most likely result in over-oxidation of methane into either CO or CO2. However, for Co-ZSM-5 formaldehyde was detected by Beznis et al., so CO cannot be ruled out completely,55 though we could not observe any formaldehyde formation. According to Kulkarni et al., Cu(CH3)(H2O), is an intermediate in the activation of methane on the Cu(OH)+ site, and here we show experimental evidence for this proposed intermediate.27 Combining this with the previously observed Cu-dimers after O2-activation, both active sites are consistent with the results, but cannot be distinguished by UV-vis spectroscopy alone.
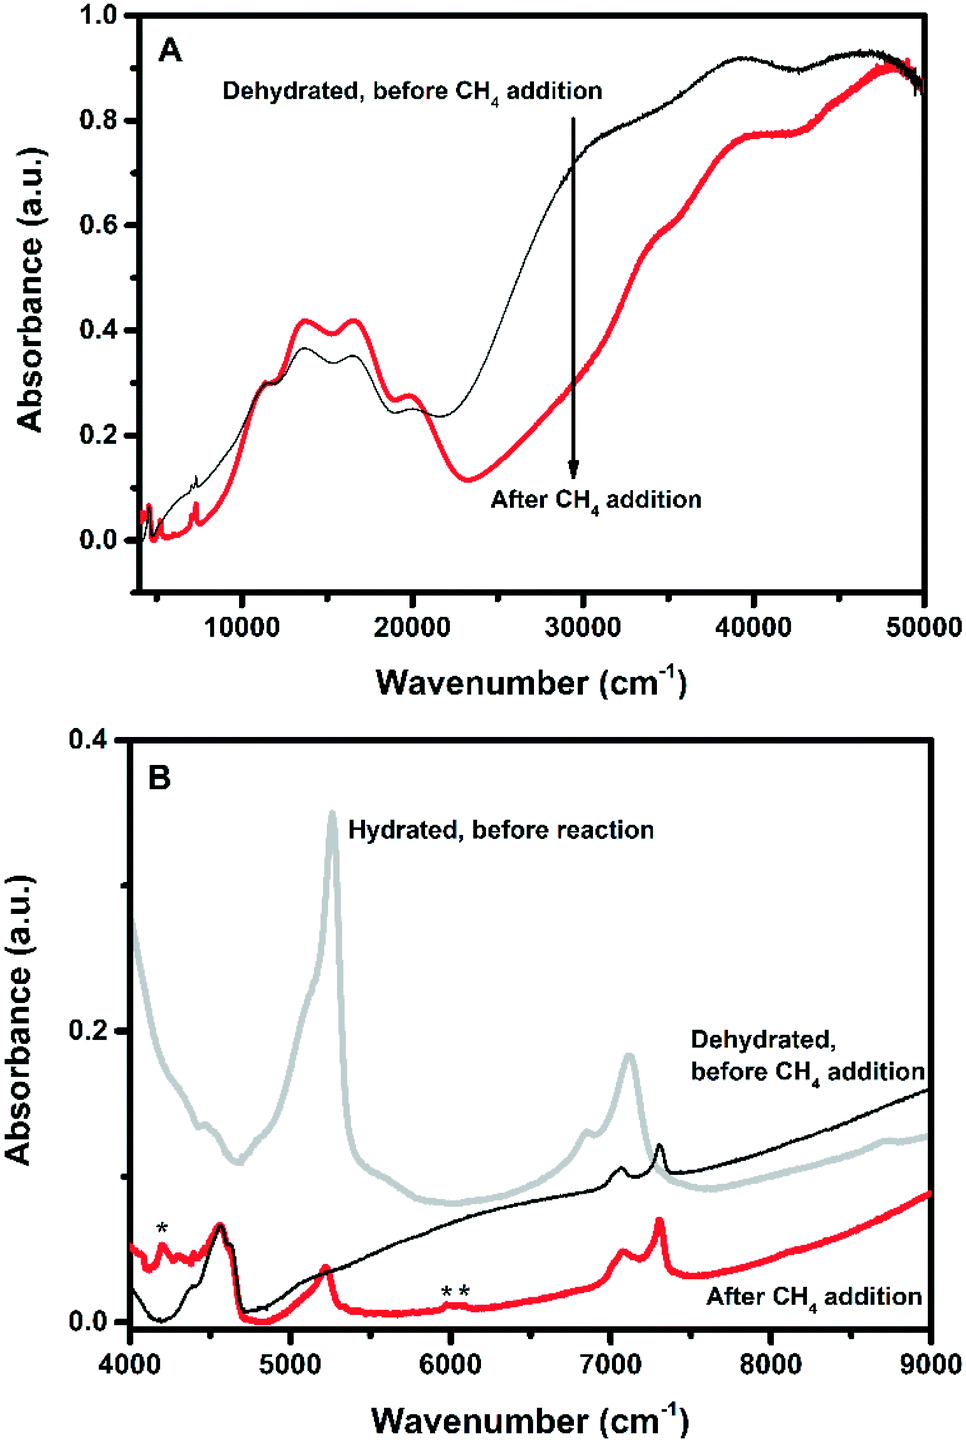 | ||
| Fig. 7 (A) UV-vis-NIR DRS spectra of Cu-1.21-Na after dehydration using dry O2 at 450 °C for 2 h, and after addition of methane at 200 °C for 1 h. B) Near infrared (NIR) region of the spectra before and after methane addition at 200 °C for 1 h. Bands designated * are due to the CH3 symmetrical and anti-symmetrical overtone vibrations, showing that at this point in the reaction, CH3 is present on the Cu-exchanged zeolites. As a reference one spectrum was added before methane addition. See Table 4 for the assignments of all NIR bands and Fig. S5 (ESI†) for the remaining samples. | ||
Linking UV-vis and FT-IR spectroscopy to methanol production
In order to differentiate between planar or bis(μ-η2:η2 peroxo) di-copper species or [Cu(OH)]+, in situ FT-IR was performed during O2 activation. Using this approach, we are able to differentiate between the different species responsible for the 29000 cm−1 UV-vis absorption as [Cu(OH)]+ should show an OH vibration (if indeed present), while the dicopper species should not. Fig. 8 shows the OH region of the spectrum of a selection of Cu-exchanged zeolites thermally treated by flowing either 100% He or 100% O2 for 2 h at 450 °C. The main difference observed between these experiments is the additional band appearing at 3654 cm−1 only with O2 activation, which has previously been assigned to [CuOH]+ species by Borfecchia et al.,56 showing that upon O2 activation at 450 °C [Cu(OH)]+ species are formed. As discussed previously, these species may be an intermediate to the Cu-dimer sites given the dynamic environment at these reaction conditions. Interestingly, very recently Gao et al. also showed that for NH3-SCR both Cu2+ as well as [Cu(OH)]+ ions are active centers during the low temperature NH3-SCR reaction.47 If we then compare the intensity of this 3654 cm−1 band (after normalization) vs. the methanol production (Fig. 9) it seems that the Cu-exchanged zeolites which produce the most methanol also show the highest band intensity, possibly indicating that this is related to the active site for this reaction, possibly as an intermediate. After measuring both the reactivity and detailed UV-vis results, the amount of methanol produced per gram material was compared with the absolute intensity of the band at 29000 cm−1 (Fig. 9), as well as the band intensity at 3654 cm−1. For both sets of data we observe a general increase in methanol production as both the absolute intensity of the 29000 cm−1 band increases, or as the 3654 cm−1 band intensity increases. This directly links methanol production to the 29000 cm−1 UV-vis band and to the FT-IR 3654 cm−1 vibration, and strengthens the hypothesis that this 29000 cm−1 band is related to the active site for methane activation. In order to further support the link between the FT-IR results and the UV-vis-NIR DRS results, similar experiments were performed using 100% He and 100% O2, and the results are shown in Fig. 6. In this figure, it is clearly visible that the UV-vis band at 29000 cm−1 has a much lower intensity after treatment in He. The increase of the Cu–OH-IR band intensity with increasing methanol production reinforces that Cu(OH)+ is an active site, as was theoretically shown using DFT by Kulkarni et al.,27 or at least an intermediate to the active site, as was also suggested by Pappas et al.42
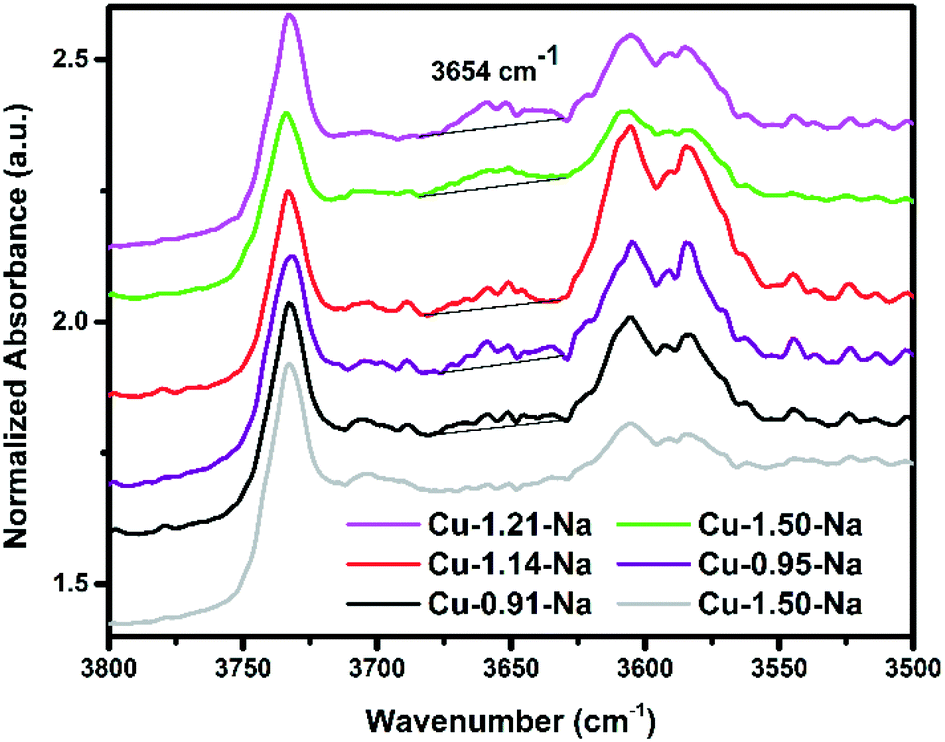 | ||
| Fig. 8 Dehydration of the zeolite monitored by in situ FTIR spectroscopy, spectra normalized to self-supporting wafer weight. The samples were thermally treated by flowing 100 ml min−1 of either 100% He (red spectrum) or O2 (all other spectra), for 2 h at 450 °C. FT-IR spectra taken at 150 °C. The band at 3654 cm−1 is assigned to [CuOH]+, which is only observed after heating in O2.56 | ||
 | ||
| Fig. 9 μmol methanol produced per gram Cu-exchanged zeolite vs. the absolute absorbance height of the 29000 cm−1 band after dehydration (bottom axis, squares) in O2 at 450 °C, as well as the height of the 3654 cm−1 FT-IR band (top axis, triangles). The absorbance at 29000 cm−1 was taken after setting 0 abs at 4200 cm−1 in Fig. S4B,† while for the FT-IR data the height of the peak at 3654 cm−1 was used. Baselines of the FT-IR are seen in Fig. 8. | ||
Conclusions
Cu-exchanged SSZ-13 zeolites, which perform well in the NH3-SCR reaction at 200 °C, also show a high activity in the methane-to-methanol reaction, and vice versa, leading us to believe that there is a common active site for both reactions. Both a mono-nuclear site or a dimeric copper active site are consistent with the observation of this study, most importantly the FT-IR vibration at 3654 cm−1 and a UV-vis-NIR absorption band at 29000 cm−1, as witnessed from operando and in situ UV-vis-NIR DRS spectroscopy. Furthermore, we found that increasing the pre-oxidation temperature from 450 °C to 550 °C resulted in a 15% increase in methanol production, as well an increase of the 29000 cm−1 UV-vis absorption band, reinforcing the hypothesis that this CT transition may be related to the active site for methane activation. After methane is added, this site becomes a Cu(CH3)(H2O)/Cu(CH3)(OH) intermediate species, as is supported by the analysis of the NIR region. Water is needed to liberate methanol from the active site, and subsequent re-oxidation is needed to regenerate the active site, making this a stepwise reaction and not a true catalytic reaction. The NIR region is especially useful in assigning overtone vibrations, such as CH3 (4200 cm−1) and –H2O (5248 cm−1), and resulted in the detection of a Cu–CH3–H2O/OH intermediate.
Conflicts of interest
There are no conflicts to declare.Acknowledgements
B. M. W. thanks the Netherlands Organization for Scientific Research (NWO-CW) for a TOP research grant. J. S. has received funding from the European Union's Horizon 2020 research and innovation programme under the Marie Sklodowska-Curie grant agreement No. 702149. Helen de Waard (Utrecht University, UU) is thanked for the ICP-OES measurements. Sachem Inc. is thanked for providing the template (ZeoGen 2825) used in the synthesis of zeolite SSZ-13.References
- M. J. da Silva, Fuel Process. Technol., 2016, 145, 42–61 CrossRef.
- P. Tang, Q. Zhu, Z. Wu and D. Ma, Energy Environ. Sci., 2014, 7, 2580 CAS.
- A. I. Olivos-Suarez, À. Szécsényi, E. J. M. Hensen, J. Ruiz-Martinez, E. A. Pidko and J. Gascon, ACS Catal., 2016, 2965–2981 CrossRef CAS.
- C. Hammond, S. Conrad and I. Hermans, ChemSusChem, 2012, 5, 1668–1686 CrossRef CAS PubMed.
- V. Arutyunov, Catal. Today, 2013, 215, 243–250 CrossRef CAS.
- Z. Zakaria and S. K. Kamarudin, Renewable Sustainable Energy Rev., 2016, 65, 250–261 CrossRef CAS.
- E. T. C. Vogt, G. T. Whiting, A. Dutta Chowdhury and B. M. Weckhuysen, Adv. Catal., 2015, 58, 143–314 Search PubMed.
- M. H. Groothaert, P. J. Smeets, B. F. Sels, P. A. Jacobs and R. A. Schoonheydt, J. Am. Chem. Soc., 2005, 127, 1394–1395 CrossRef CAS PubMed.
- M. J. Wulfers, S. Teketel, B. Ipek and R. F. Lobo, Chem. Commun., 2015, 51, 4447–4450 RSC.
- Z.-J. Zhao, A. Kulkarni, L. Vilella, J. K. Nørskov and F. Studt, ACS Catal., 2016, 6, 3760–3766 CrossRef CAS.
- F. Giordanino, P. N. R. Vennestrøm, L. F. Lundegaard, F. N. Stappen, S. Mossin, P. Beato, S. Bordiga and C. Lamberti, Dalton Trans., 2013, 42, 12741–12761 RSC.
- P. J. Smeets, R. G. Hadt, J. S. Woertink, P. Vanelderen, R. A. Schoonheydt, B. F. Sels and E. I. Solomon, J. Am. Chem. Soc., 2010, 132, 14736–14738 CrossRef CAS PubMed.
- J. S. Woertink, P. J. Smeets, M. H. Groothaert, M. A. Vance, B. F. Sels, R. A. Schoonheydt and E. I. Solomon, Proc. Natl. Acad. Sci. U. S. A., 2009, 106, 18908–18913 CrossRef CAS PubMed.
- N. V. Beznis, B. M. Weckhuysen and J. H. Bitter, Catal. Lett., 2010, 138, 14–22 CrossRef CAS.
- C. L. McMullin, A. W. Pierpont and T. R. Cundari, Polyhedron, 2013, 52, 945–956 CrossRef CAS.
- T. Sheppard, H. Daly, A. Goguet and J. M. Thompson, ChemCatChem, 2016, 8, 562–570 CrossRef CAS PubMed.
- V. L. Sushkevich, D. Palagin, M. Ranocchiari and J. A. van Bokhoven, Science, 2017, 356, 523–527 CrossRef CAS PubMed.
- M. Ravi, M. Ranocchiari and J. A. van Bokhoven, Angew. Chem., Int. Ed., 2017, 56, 16464–16483 CrossRef CAS PubMed.
- P. J. Smeets, M. H. Groothaert and R. A. Schoonheydt, Catal. Today, 2005, 110, 303–309 CrossRef CAS.
- P. Vanelderen, R. G. Hadt, P. J. Smeets, E. I. Solomon, R. A. Schoonheydt and B. F. Sels, J. Catal., 2011, 284, 157–164 CrossRef CAS PubMed.
- S. Grundner, W. Luo, M. Sanchez-Sanchez and J. A. Lercher, Chem. Commun., 2016, 52, 2553–2556 RSC.
- G. Li, P. Vassilev, M. Sanchez-Sanchez, J. A. Lercher, E. J. M. Hensen and E. A. Pidko, J. Catal., 2016, 338, 305–312 CrossRef CAS.
- P. Vanelderen, B. E. R. Snyder, M.-L. Tsai, R. G. Hadt, J. Vancauwenbergh, O. Coussens, R. A. Schoonheydt, B. F. Sels and E. I. Solomon, J. Am. Chem. Soc., 2015, 137, 6383–6392 CrossRef CAS PubMed.
- P. Tomkins, A. Mansouri, S. E. Bozbag, F. Krumeich, M. B. Park, E. M. C. Alayon, M. Ranocchiari and J. A. van Bokhoven, Angew. Chem., Int. Ed., 2016, 55, 5467–5471 CrossRef CAS PubMed.
- S. Grundner, M. A. C. Markovits, G. Li, M. Tromp, E. A. Pidko, E. J. M. Hensen, A. Jentys, M. Sanchez-Sanchez and J. A. Lercher, Nat. Commun., 2015, 6, 7546 CrossRef PubMed.
- A. M. Beale, F. Gao, I. Lezcano-Gonzalez, C. H. F. Peden and J. Szanyi, Chem. Soc. Rev., 2015, 44, 7371–7405 RSC.
- A. R. Kulkarni, Z.-J. Zhao, S. Siahrostami, J. K. Nørskov and F. Studt, ACS Catal., 2016, 6, 6531–6536 CrossRef CAS.
- B. Ipek, M. J. Wulfers, H. Kim, F. Göltl, I. Hermans, J. P. Smith, K. S. Booksh, C. M. Brown and R. F. Lobo, ACS Catal., 2017, 4291–4303 CrossRef CAS.
- A. M. Beale, I. Lezcano-González, W. A. Slawinksi and D. S. Wragg, Chem. Commun., 2016, 52, 6170–6173 RSC.
- D. Wang, F. Gao, C. H. F. Peden, J. Li, K. Kamasamudram and W. S. Epling, ChemCatChem, 2014, 6, 1579–1583 CrossRef.
- F. Gao, N. M. Washton, Y. Wang, M. Kollár, J. Szanyi and C. H. F. Peden, J. Catal., 2015, 331, 25–38 CrossRef CAS.
- T. Zhang, F. Qiu and J. Li, Appl. Catal., B, 2016, 195, 48–58 CrossRef CAS.
- T. A. Nijhuis, S. J. Tinnemans, T. Visser and B. M. Weckhuysen, Phys. Chem. Chem. Phys., 2003, 5, 4361–4365 RSC.
- E. C. Nordvang, E. Borodina, J. Ruiz-Martínez, R. Fehrmann and B. M. Weckhuysen, Chem. – Eur. J., 2015, 21, 17324–17335 CrossRef CAS PubMed.
- E. Borodina, F. Meirer, I. Lezcano-González, M. Mokhtar, A. M. Asiri, S. A. Al-Thabaiti, S. N. Basahel, J. Ruiz-Martinez and B. M. Weckhuysen, ACS Catal., 2015, 5, 992–1003 CrossRef CAS.
- S. Zeng, Y. Wang, S. Ding, J. J. H. B. Sattler, E. Borodina, L. Zhang, B. M. Weckhuysen and H. Su, J. Power Sources, 2014, 256, 301–311 CrossRef CAS.
- J. J. H. B. Sattler, I. D. Gonzalez-Jimenez, L. Luo, B. A. Stears, A. Malek, D. G. Barton, B. A. Kilos, M. P. Kaminsky, T. W. G. M. Verhoeven, E. J. Koers, M. Baldus and B. M. Weckhuysen, Angew. Chem., Int. Ed., 2014, 53, 9251–9256 CrossRef CAS PubMed.
- P. A. Jacobs, W. de Wilde, R. A. Schoonheydt, J. B. Uytterhoeven and H. Beyer, J. Chem. Soc., Faraday Trans. 1, 1976, 72, 1221 RSC.
- P. A. Jacobs, M. Tielen, J.-P. Linart, J. B. Uytterhoeven and H. Beyer, J. Chem. Soc., Faraday Trans. 1, 1976, 72, 2793 RSC.
- S. E. Bozbag, E. M. C. Alayon, J. Pecháček, M. Nachtegaal, M. Ranocchiari and J. A. van Bokhoven, Catal. Sci. Technol., 2016, 6, 5011–5022 CAS.
- B. Ipek and R. F. Lobo, Chem. Commun., 2016, 52, 13401–13404 RSC.
- D. K. Pappas, E. Borfecchia, M. Dyballa, I. A. Pankin, K. A. Lomachenko, A. Martini, M. Signorile, S. Teketel, B. Arstad, G. Berlier, C. Lamberti, S. Bordiga, U. Olsbye, K. P. Lillerud, S. Svelle and P. Beato, J. Am. Chem. Soc., 2017, 139, 14961–14975 CrossRef CAS PubMed.
- J. H. Kwak, R. G. Tonkyn, D. H. Kim, J. Szanyi and C. H. F. Peden, J. Catal., 2010, 275, 187–190 CrossRef CAS.
- S. J. Schmieg, S. H. Oh, C. H. Kim, D. B. Brown, J. H. Lee, C. H. F. Peden and D. H. Kim, Catal. Today, 2012, 184, 252–261 CrossRef CAS.
- R. Oord and B. M. Weckhuysen, in Zeolites and Zeolite-Like Materials, ed. B. F. Sels and L. M. Kustov, Elsevier, Amsterdam, 2016, pp. 433–450 Search PubMed.
- D. Wang, L. Zhang, J. Li, K. Kamasamudram and W. S. Epling, Catal. Today, 2013, 231, 64–74 CrossRef.
- F. Gao, D. Mei, Y. Wang, J. Szanyi and C. H. F. Peden, J. Am. Chem. Soc., 2017, 139, 4935–4942 CrossRef CAS PubMed.
- C. Paolucci, I. Khurana, A. A. Parekh, S. Li, A. J. Shih, H. Li, J. R. Di Iorio, J. D. Albarracin-Caballero, A. Yezerets, J. T. Miller, W. N. Delgass, F. H. Ribeiro, W. F. Schneider and R. Gounder, Science, 2017, 5630, eaan5630 Search PubMed.
- S. T. Korhonen, D. W. Fickel, R. F. Lobo, B. M. Weckhuysen and A. M. Beale, Chem. Commun., 2011, 47, 800–802 RSC.
- A. El-Trass, H. ElShamy, I. El-Mehasseb and M. El-Kemary, Appl. Surf. Sci., 2012, 258, 2997–3001 CrossRef CAS.
- F. Gao, E. D. Walter, M. Kollar, Y. Wang, J. Szanyi and C. H. F. F. Peden, J. Catal., 2014, 319, 1–14 CrossRef CAS.
- A. Sainz-Vidal, J. Balmaseda, L. Lartundo-Rojas and E. Reguera, Microporous Mesoporous Mater., 2014, 185, 113–120 CrossRef CAS.
- W. Hanke and K. Möller, Zeolites, 1984, 4, 244–250 CrossRef CAS.
- G. Socrates, Infrared and Raman characteristic group frequencies, John Wiley & Sons Ltd, Chichester, England, 2004 Search PubMed.
- N. V. Beznis, A. N. C. van Laak, B. M. Weckhuysen and J. H. Bitter, Microporous Mesoporous Mater., 2011, 138, 176–183 CrossRef CAS.
- E. Borfecchia, K. A. Lomachenko, F. Giordanino, H. Falsig, P. Beato, A. V. Soldatov, S. Bordiga and C. Lamberti, Chem. Sci., 2014, 6, 548–563 RSC.
Footnote |
| † Electronic supplementary information (ESI) available. See DOI: 10.1039/c7cy02461d |
| This journal is © The Royal Society of Chemistry 2018 |