
 Open Access Article
 This Open Access Article is licensed under a
 Creative Commons Attribution 3.0 Unported Licence
Enhancing the capacity of oxygen carriers for selective oxidations through phase cooperation: bismuth oxide and ceria–zirconia†
Martin S. C.
Chan
 *,
Herme G.
Baldovi
and
J. S.
Dennis
*,
Herme G.
Baldovi
and
J. S.
Dennis
Department of Chemical Engineering and Biotechnology, University of Cambridge, CB2 3RA, UK. E-mail: mscc3@cam.ac.uk
First published on 17th January 2018
Abstract
Oxygen carriers are a class of materials, typically solid oxides, that can reversibly store and release oxygen for a variety of applications in energy and chemical processes, e.g. chemical looping combustion (CLC) and chemical looping air separation (CLAS). In recent years, growing interest in these materials have been focused on their use in chemical looping selective oxidations. A method for enhancing the oxygen-carrying capacity of oxygen carriers for use in selective oxidations is presented. In this approach, one material that is selective and active in the reaction is deposited on the surface of a second material acting as a reservoir of oxygen and as a support. Here, the approach has been investigated using the selective combustion of hydrogen in the presence of ethylene, an important step in the oxidative dehydrogenation of ethane. Bismuth oxides, supported on a range of ceria–zirconia materials, were made into particulate oxygen carriers and studied for their activity, selectivity and oxygen-storage capacity. STEM-EDS imaging showed that the bismuth phase was spread uniformly over the surface of the nanocrystalline particles. XPS measurements indicated that the surface was enriched with bismuth oxide. It was found that the presence of ceria in the support supplied lattice oxygen additional to that provided by the bismuth oxide, without affecting the selectivity of bismuth oxide towards the combustion of H2. In other words, the surface chemistry was decoupled from the bulk properties of the support, thus simplifying the design and formulation of selective oxygen carriers. This demonstrates a readily-applicable generic approach for the design of oxygen carriers for selective oxidations.
1 Introduction
Selective oxidation reactions constitute an important class of reactions undertaken industrially for the production of organic intermediates. The predominant approach is to perform these reactions catalytically over transition metal oxides by co-feeding the organic reactant with the oxidant, typically molecular oxygen. Despite many decades of active research using this approach, reactions touted to be of large industrial and economic significance, such as the oxidative coupling of methane (OCM) and the oxidative dehydrogenation (ODH) of light alkanes, have yet to be implemented on an industrial scale.1,2 A chemical looping mode of operation, sometimes referred to as ‘cyclic’, ‘redox’ or ‘anaerobic’ mode, has been suggested by several workers,3–8 but has often been overlooked in favour of operating in steady state with co-feed of the organic molecule and gaseous oxygen for its simplicity in implementation.Considerable research has been undertaken on the application of chemical looping for the combustion of carbonaceous fuels.9–11 The principle relies on the use of an oxygen carrier material (typically a transition metal oxide). The carrier oxidises the fuel in one reactor, becoming reduced in the process. The reduced carrier is then conveyed to a second reactor where it is reoxidised with the air reactor, before being returned to the fuel reactor to complete the cycle. This method of combustion has the key advantage of producing a pure stream of CO2, undiluted with N2, ready for capture and storage in the Earth, with minimal energy penalty compared to other separation technologies such as amine scrubbing or oxy-fuel combustion.10,12 However, the general idea of conveying solid lattice oxygen to a reaction, in the absence of gaseous oxygen, can be extended to selective oxidations. For chemical looping selective oxidation, the fuel would be substituted for some organic feed, and the flue gases would be replaced with valuable chemical products, as shown in Fig. 1.
 | ||
| Fig. 1 Schematic diagram of chemical looping selective oxidation for organic syntheses. | ||
Using chemical looping to supply oxygen has substantial advantages for selective oxidations, owing largely to the complete substitution of gaseous oxygen for lattice oxygen. In conventional oxidation using gaseous oxygen or air, the requirement to operate below the explosion limit requires substantial recycle of reactants and, should there be a lack of mixedness, presents a safety hazard, or, at least, an opportunity for partial oxidation of the feed to unwanted carbon oxides. Using chemical looping to convey the oxygen as lattice oxygen to the reaction would achieve an inherent separation between the air and organic streams, offering the advantages of (i) safety, as the risk of forming explosive mixtures is minimised, (ii) eliminating the need to operate in oxygen-lean conditions, allowing for higher single-pass conversions and decreasing the need for recycling, (iii) potentially improved selectivities, and (iv) avoiding the need to purify gaseous oxygen or the organic product from diluents such as nitrogen. In the light of these advantages, interest in chemical looping as a technology for the production of chemicals has been gradually increasing.13–18
An important example of a semi-commercial application of this technology is Dupont's process for oxidising n-butane to maleic anhydride, undertaken in a circulating fluidised bed (CFB).4 Although this process has seen significant improvement since its conception in the 1980s,19 vanadium pyrophosphate is still used as the oxygen carrier and suffers from a low oxygen-carrying capacity, of the order of 0.2 wt% (kg O/kg carrier). Oxygen carriers used for combustion typically range from 5–25 wt%. For chemical syntheses, lower capacities necessitate lower partial pressures of reactant, otherwise the carrier quickly becomes severely reduced which tends to cause coking. Lower capacities might, to some extent, be compensated for by adjusting operating parameters such as using a higher solid circulation rate (as in circulating fluidised beds) or higher frequency of cycling (as in packed bed reactors) but at an economic trade-off with higher operating costs. Higher capacities are therefore advantageous for chemical looping operation.20
In general, a suitable oxygen carrier needs to be (i) highly active, (ii) highly selective, (iii) highly stable with respect to repeated cycles of redox, (iv) have a sufficiently high oxygen-carrying capacity, and (v) be sufficiently cheap to manufacture. The problem is compounded because the selectivity and activity of the material might change substantially as its oxidation state alters with progress of the reaction (e.g. combustion may be prominent when the carrier is fully oxidised, whereas coking may occur when the carrier is deeply reduced).
For some reactions, one material may not possess all relevant properties, and so here we propose the use of structured composite materials for kinetically-controlled selective oxidations by controlling the chemical potential of oxygen supplied to the site of the reaction. The surface is decorated with selective active sites, presented by one component. This selective phase is stabilised on an active support, e.g. a solid electrolyte, that can provide additional lattice oxygen to the active sites. Lattice oxygen may be drawn from the electrolyte itself if it is reducible. The hypothesis is that gas preferentially reacts with the selective phase, which, in turn, is regenerated with oxygen from the electrolyte either by bulk diffusion or by reverse spillover at the triple phase boundary. The resulting synergistic composite is then both selective and stable, performing better than the sum of the separate components, enabled by phase cooperation.21,22 Side reactions of the gas with the electrolyte may be much slower than with the selective active sites or be physically inhibited by the selective phase acting as a barrier. This approach is easier than screening for a single material with all the required properties.
In this work, we demonstrate this proposed concept for a model reaction scheme, chosen to be the selective combustion of hydrogen in the presence of ethylene. This reaction has had some historical interest in the context of the oxidative dehydrogenation of light alkanes.5,23 This reaction was chosen because it is possible to analyse rapidly and quantitatively the gaseous products H2O and CO2. Accordingly, the reactions during the reduction step in the chemical looping cycle are reactions (1) and (2), with reoxidation described by reaction (3) (applicable for a Bi-based oxygen carrier):
 | (1) |
 | (2) |
 | (3) |
For the selective combustion of hydrogen in the presence of hydrocarbons, bismuth oxide24 and doped ceria1,25 have previously been demonstrated to be selective carriers. Bismuth oxide and metallic bismuth have low melting points (817 °C and 272 °C, respectively) which makes them prone to deactivation. Stabilisation with a support is therefore necessary, but this decreases the gravimetric oxygen-carrying capacity if it is inert. A possible candidate active support is ceria, which is stable and conducts oxide ions but needs to be doped to be selective. These dopants could be Bi or W.23,25 Zirconia is often mixed with ceria to increase its stability and oxygen-carrying capacity at a given temperature.26,27 A combination of bismuth oxide supported on ceria–zirconia has been shown to be active, selective and stable,6 but the effect of the support on the innate selectivity of bismuth has not been established. The effect of the composition of the support was also not established. Ceria is also interesting because it has similar lattice parameters to those of certain polymorphs of bismuth oxide, thereby promoting phase cooperation.22 The present work explores the effect of an active support on the selectivity. Accordingly, a range of ceria–zirconia supported bismuth oxides were prepared, and their performances for reactions 1 and 2 were evaluated in a packed bed reactor in chemical looping mode.
2 Experimental
2.1 Preparation of oxygen carriers
The oxygen carriers were composed of 25 wt% Bi2O3 supported on CexZr1−xO2−δ. The ceria–zirconia supports were synthesised using a citrate-gel method;28 the resulting particles were subsequently wet impregnated with a bismuth nitrate solution and calcined. Briefly, stoichiometric quantities of Ce(NO3)3·6H2O (Sigma-Aldrich, purity 99% trace metals basis), ZrO(NO3)2·xH2O (Sigma-Aldrich, purity 99%, 35.9 wt% ZrO2) and citric acid (Sigma-Aldrich, purity ≥99.5%) were dissolved in reverse osmosis water with an acid to metal ion ratio of 2![[thin space (1/6-em)]](https://www.rsc.org/images/entities/char_2009.gif) :1. The metal ion concentration was 1 M. The mixture was then heated in an oven to dryness at 120 °C for 12 h, forming a xerogel, which was subsequently calcined in a furnace at 200 °C for 1 h. The resulting brown gel was crushed and calcined again at 600 °C for 3 h, yielding a fine powder of CexZr1−xO2−δ. Bismuth was then added to the supports by wet impregnation. Thus, Bi(NO3)3·5H2O (Sigma-Aldrich, purity ≥98%) was dissolved in pH 0 nitric acid (Fisher Scientific) to prevent precipitation. The acidified bismuth nitrate solution (bismuth concentration 0.477 M) was then mixed with the ceria–zirconia support in a ratio of 3 mL of solution per gram of support, with ultrasonication in a bath for 10 min to aid mixing. The slurry was then heated in an oven at 120 °C to dryness for 12 h, followed by calcination in a furnace at 600 °C for 3 h. For experiments in a packed bed, the powders were pelletised by compression at 100 MPa, crushed, then sieved to a sieve size range of 212–300 μm. Five oxygen carriers were synthesised in this study and are denoted Bi25CexZr where x = [0, 25, 50, 75, 100] refers to the mole percent of ceria in the ceria–zirconia support (e.g. 25 wt% Bi2O3 supported on Ce0.50Zr0.50O2−δ is denoted as Bi25Ce50Zr). The loading of 25 wt% Bi2O3 was chosen to ensure the support was covered by Bi2O3.
:1. The metal ion concentration was 1 M. The mixture was then heated in an oven to dryness at 120 °C for 12 h, forming a xerogel, which was subsequently calcined in a furnace at 200 °C for 1 h. The resulting brown gel was crushed and calcined again at 600 °C for 3 h, yielding a fine powder of CexZr1−xO2−δ. Bismuth was then added to the supports by wet impregnation. Thus, Bi(NO3)3·5H2O (Sigma-Aldrich, purity ≥98%) was dissolved in pH 0 nitric acid (Fisher Scientific) to prevent precipitation. The acidified bismuth nitrate solution (bismuth concentration 0.477 M) was then mixed with the ceria–zirconia support in a ratio of 3 mL of solution per gram of support, with ultrasonication in a bath for 10 min to aid mixing. The slurry was then heated in an oven at 120 °C to dryness for 12 h, followed by calcination in a furnace at 600 °C for 3 h. For experiments in a packed bed, the powders were pelletised by compression at 100 MPa, crushed, then sieved to a sieve size range of 212–300 μm. Five oxygen carriers were synthesised in this study and are denoted Bi25CexZr where x = [0, 25, 50, 75, 100] refers to the mole percent of ceria in the ceria–zirconia support (e.g. 25 wt% Bi2O3 supported on Ce0.50Zr0.50O2−δ is denoted as Bi25Ce50Zr). The loading of 25 wt% Bi2O3 was chosen to ensure the support was covered by Bi2O3.
2.2 Characterisation
A thermogravimetric analyser (TGA/DSC1, Mettler Toledo) was used to measure the oxygen-carrying capacity of the samples by temperature-programmed reduction (TPR). The TPR in diluted H2 was performed at a heating rate of 10 °C min−1 from 150 °C to 600 °C, followed by holding at 600 °C for 10 min. Approximately 40 mg of freshly-calcined sample was placed in a 70 μL alumina crucible within the reaction chamber. The sample was initially dried for 10 minutes at 600 °C in a flow of Ar (50 mL min−1, all volumetric flow rates reported were measured at 293 K and 1 atm), followed by the TPR with an additional flow of 5 vol% H2 in N2 (50 mL min−1). The oxygen-carrying capacity was calculated by assuming that the change in mass during reduction was solely due to the carrier losing lattice oxygen. A subsequent temperature-programmed oxidation (TPO) confirmed that the original mass was recovered.Powder X-ray diffraction (XRD) was used to analyse the crystalline phases of the oxygen carriers. Measurements were made at atmospheric conditions in a diffractometer (Empyrean, PANalytical) using Cu-Kα radiation. The reference patterns used to identify the phases were ICSD-60900 (m-ZrO2), ICSD-85322 (t-ZrO2), ICSD-88759 (CeO2), ICSD-94229 (α-Bi2O3), ICSD-417638 (β-Bi2O3), ICSD-98144 (δ-Bi2O3).
X-ray photoelectron spectrometry (XPS) was used to analyse the surface composition of the oxygen carriers. The spectrometer (ESCALAB 250Xi, Thermo Fisher Scientific) was equipped with an Al-Kα (1486.6 eV) X-ray source, and the analysis was conducted under an ultrahigh vacuum (<10−10 mbar). Binding energies were calibrated using the C(1s) peak (284.6 eV).
Nitrogen physisorption isotherms were measured at −196 °C using a Micromeritics ASAP 2020 instrument. Approximately 0.10 g of sample was used, which was degassed under vacuum at 150 °C for 1 h prior to the measurements. The isotherms were modelled using the Brunauer, Emmett and Teller (BET) method.29
Transmission electron microscopy (TEM) was used to analyse the morphology of the oxygen carriers. The samples were prepared by ultrasonically dispersing the powdered oxygen carriers in deionised water. A droplet of this transparent suspension was loaded onto holey carbon film on a 400 mesh copper grid (Agar Scientific), followed by drying in a vacuum oven at 80 °C. High-resolution TEM (HRTEM) images were obtained using a Tecnai F20 system at 200 kV with a high brightness field emission gun (FEG). High angle annular dark field (HAADF) scanning TEM (STEM) was coupled with energy-dispersive X-ray spectroscopy (EDX), performed with an Oxford EDX detector, to obtain elemental maps of the materials.
2.3 Packed bed reactor
The downflow packed bed reactor consisted of an 8 mm i.d., 560 mm long quartz tube with a sintered disc fixed 255 mm from the bottom, mounted vertically. The tube was inserted into the bore of an electrically-heated furnace, the ends of which were plugged with insulating refractory fibres. The output of the furnace was controlled by a type N thermocouple with a mineral-insulated Nicrobell D sheath inserted into the bed. The bed was packed above the sintered disc, with a bottom layer of 3 g of coarse SiC (Alfa Aesar, 46 grit) to position the active bed in the isothermal region of the furnace, then a middle layer with the carrier (diluted with SiC to eliminate limitations on heat transfer), then finally another layer of 2.5 g of SiC on top to preheat the feed. Both ends of the quartz tube were connected to Swagelok Ultra-Torr® vacuum fittings and sealed with fluorocarbon FKM O-rings. All upstream tubing was metal with compression fittings to minimise any ingress of moisture and oxygen. The line from the reactor outlet to the housing of the humidity sensor was trace heated to prevent condensation of moisture.The feed gases to the reactor were supplied from cylinders (Air Liquide), and consisted of separate cylinders of (i) 5.4 vol% ethylene, (ii) 4.81 vol% H2, (iii) 5.03 vol% O2, and (iv) pure N2 (purity >99.998%). The balance gas was always N2. Gas flows were manipulated by calibrated rotameters. The gas analysis was accomplished by a set of online analysers in series. These were, in order from upstream to downstream: for H2O (IST, HYT 271, capacitive polymer humidity and temperature sensor), H2 (ABB, EL3020 Caldos27, thermal conductivity), CO, CO2 (ABB, EL3020 Uras26, NDIR), and O2 (ABB, EL3020 Magnos206, paramagnetic). A drying tube packed with CaCl2 was fitted between the humidity sensor and thermal conductivity sensor to remove moisture. Offline gas chromatography (GC) equipped with a flame ionization detector (FID) was used to measure CH4, C2H6 and C2H4 (Agilent, 6850), with separation achieved by a porous layer open tubular column (Agilent, GS-GasPro). The FID signals were calibrated using external standards from certified gas mixtures. The gas samples were withdrawn through a septum seal on the reactor exhaust line.
In the integral bed experiments, 0.10 g of the carrier, diluted with 0.80 g of SiC, was loaded into the packed bed to measure selectivity and activity. The chemical looping operation consisted of two stages: (i) reduction in a mixture of 2.5 vol% H2, 2.5 vol% C2H4, (ii) oxidation in 5 vol% O2, with nitrogen purges between stages. The operating temperature ranged from 450 to 550 °C. The reducing feed was an equimolar mixture of H2 and C2H4 to emulate the products from a catalytic dehydrogenation process. C2H6 was omitted for simplicity because it has been shown to be much less reactive than C2H4.5 Each stage progressed until no further reaction was observed. The hydrogen and carbon molar balances between the feed and the products were always within ±5%. A control was performed at 550 °C in which the reactor was packed with only SiC: no detectable conversions of H2 or C2H4 were measured. All packed bed experiments were analysed using standard diagnostic criteria for heat and mass transfer limitations: axial dispersion;30,31 bed dilution;32 particle external33 and internal mass transfer;34 particle external and internal heat transfer and bed radial heat transfer.35 It was revealed that the only limitation on the observed rates of reaction were at higher conversions due to the supply of reactant. The oxygen-carrying capacity of the materials was calculated by integrating the oxygenated products in the off-gas, using:
 | (4) |
For kinetic measurements, the packed bed reactor (n.b. a fluidised bed reactor was unsuitable because the prepared particles were too friable) was operated in differential mode, i.e. the conversion of the feed was less than 10% at all times, to minimise axial gradients in chemical composition. This was achieved by varying the flow rate and the mass of the carrier loaded into the bed; the residence time here was much smaller than in the integral bed experiments. Because of the short bed lengths, the oxygen carrier in these experiments was pelletised to 90–150 μm sieve diameter (with 120 grit SiC, Alfa Aesar, used as the inert diluent) to minimise the influence of bed dilution on the measured kinetics, by increasing the bed length:particle diameter ratio.32 In a typical experiment, the bed was packed and heated to the desired temperature (in the range 450–550 °C). A cycle consisted of an oxidation step in 5 vol% O2, then a subsequent purge in N2 for 3 min, then a reduction step in 4.81 vol% H2 until no products were detected. The molar flowrate of the evolved steam during the reduction step gave a measure of the kinetics at that particular temperature. For any temperature, the cycle was repeated to check for deactivation of the carrier; deviation in the measured activity (viz. the apparent first order rate constant for the combustion of H2 at zero conversion of the carrier) was usually less than 5%. The temperature was then ramped to a higher setpoint to measure the apparent activation energy. At the end of the series of experiments, deactivation of the carrier was checked again by repeating an earlier experiment; deviation in the measured activity was usually less than 10%.
The concentration profiles of steam, from the differential bed, were deconvoluted from the response of the humidity sensor by using a first order lag model. Thus, the deconvoluted mole fraction of steam was calculated using:
 | (5) |
 | (6) |
The response time of the sensor tmix was generally greater than the characteristic reaction time by at least a factor of 5 (further details in the ESI†). Practical limitations on tmix arose because of significant pressure drops along the bed at higher flow rates – flow rates above 500 mL min−1 were not used because the pressure drop exceeded 0.2 bar.
The corrected mole fraction of steam was used to calculate the specific rate of reaction, r, at time ti, using:
 | (7) |
The conversion of the solid, XO, was calculated using:
 | (8) |
The peak conversion of H2, XH2, was calculated using:
 | (9) |
The peak conversion of C2H4, XC2H4, was calculated on a C-mole basis from experiments where only C2H4 was fed, using:
 | (10) |
The rate constant for the combustion of species i, ki, was calculated from the peak conversion Xi using:
 | (11) |
3 Results
3.1 Characterisation
Table 1 shows the characterisation of the oxygen carriers by N2-physisorption and TGA. Before impregnation with 25 wt% Bi2O3 (but after the first calcination at 600 °C), the surface areas generally increased with an increase in Zr content, with the exception of the sample of pure zirconia. After impregnation and the final calcination at 600 °C, a significant amount of area was lost, possibly due to either the low melting point of pure Bi2O3 at 817 °C facilitating sintering, or the hot concentrated nitric acid destroying the internal pore structure during impregnation. This resulted in a low surface area in the final product. The oxygen-carrying capacity of Bi25Ce0Zr was measured by TGA to be 2.44 wt%, which is sufficient to verify the bismuth loading of 25 wt%, corresponding to 2.58 wt%. The oxygen-carrying capacities showed that the addition of Ce increased the capacity, as expected. However, the precise values of the capacities when measured by TGA were different to those measured in the packed bed experiments. This was because of both the different temperature (TPR up to 600 °C in the TGA, and isothermal at 450–550 °C in the packed bed) and the sample in the TGA having undergone only a single cycle. In the packed bed experiments, the capacity displayed in the first cycle tended to be smaller (as low as 92% of the second cycle) than in subsequent cycles. Nevertheless, both reactors were generally in agreement, showing that intermediate ceria–zirconia compositions had a higher capacity.| BET surface area (m2 g−1) | Oxygen-carrying capacity (g O/g carrier, %) | ||
|---|---|---|---|
| Before impregnation | After impregnation | ||
| Bi25Ce0Zr | 3.7 | 2.5 | 2.44 |
| Bi25Ce25Zr | 45.6 | 3.7 | 3.84 |
| Bi25Ce50Zr | 39.8 | 5.2 | 3.38 |
| Bi25Ce75Zr | 33.3 | 7.2 | 2.54 |
| Bi25Ce100Zr | 11.1 | 7.6 | 2.66 |
Fig. 2 shows the X-ray diffraction patterns for the materials before and after impregnation with 25 wt% Bi2O3. It can be seen that the supports were apparently present in the fluorite phase (but the broad peaks meant that phases of lower symmetry cannot be excluded27), with the exception of the ZrO2 sample which presented both monoclinic and tetragonal phases. The peak positions shift with the addition of zirconia because the smaller size of the Zr4+ cation compared to the Ce4+ cation decreases the lattice parameter. Upon the addition of bismuth oxide, some samples presented additional peaks of low intensity which were attributed to α-Bi2O3. It was also found that β-Bi2O3 was present in Bi25Ce0Zr (i.e. 25 wt% Bi2O3 supported on ZrO2), consistent with previous reports.37,38 For the samples containing ceria, the low intensities of the bismuth phases could have been owing to a combination of (i) bismuth forming amorphous layers not detectable by diffraction, (ii) the doping of bismuth into the ceria or ceria–zirconia lattice, or (iii) broad overlapping peaks. There is also evidence of shifted peak positions upon the addition of Bi2O3, most apparent for the pure CeO2 support, suggesting doping of the fluorite structure.
 | ||
| Fig. 2 Powder X-ray diffraction patterns of the freshly calcined samples of (a) support and (b) supports impregnated with 25 wt% Bi2O3. Only peaks unique to each phase are marked. The apparent missing peaks at higher 2θ in the ceria–zirconia samples were likely to have been caused by low signal-to-noise ratios, owing to peak-broadening. | ||
Table 2 summarises the near-surface (depth ≲ 10 nm) elemental compositions of the oxygen carriers, as measured by XPS. There was a deviation in the XPS measurements from the mean composition, because XPS is a surface-sensitive technique. It can be seen that (a) the surface is enriched with Bi, as expected from the impregnation procedure, and also (b) the Ce:Zr ratio is less than the bulk ratio, in agreement with other workers.6Table 2 also shows the results for Bi25Ce75Zr reduced in H2, showing a lower amount of Bi than in the freshly-calcined sample; this has also been reported by other workers.6
| XPS measurements | Mean composition | |||||
|---|---|---|---|---|---|---|
| Bi mol% | Ce mol% | Zr mol% | Bi mol% | Ce mol% | Zr mol% | |
| Bi25Ce0Zr | 32 | 0 | 68 | 15.0 | 0 | 85.0 |
| Bi25Ce25Zr | 35 | 5.2 | 59 | 16.2 | 20.9 | 62.8 |
| Bi25Ce50Zr | 38 | 11 | 51 | 17.4 | 41.3 | 41.3 |
| Bi25Ce75Zr | 47 | 23 | 31 | 18.6 | 61.0 | 20.3 |
| Bi25Ce100Zr | 69 | 31 | 0 | 19.8 | 80.2 | 0 |
| Reduced Bi25Ce75Zr | 19 | 33 | 48 | 18.6 | 61.0 | 20.3 |
TEM images were obtained for Bi25Ce50Zr. In Fig. 3a, it can be seen that the samples were composed of nanocrystalline particles. Fringe patterns were also visible, with an interplanar spacing of 0.30 nm corresponding to the (111) plane of ceria–zirconia. Under these ex situ conditions, amorphous material can also be seen on the surface. Fig. 3b shows EDS maps, confirming that Bi was homogeneously dispersed over the surface of each particle. The mean metal composition in Fig. 3b was found to be: 40% Ce, 37% Zr and 24% Bi. This differed from Table 2 because EDS is not as surface-sensitive because the incident electrons penetrate to a much greater depth, whereas photoelectrons in XPS can only escape from near the surface. This means that the XPS measurement is more relevant in this context of heterogeneous catalysis.
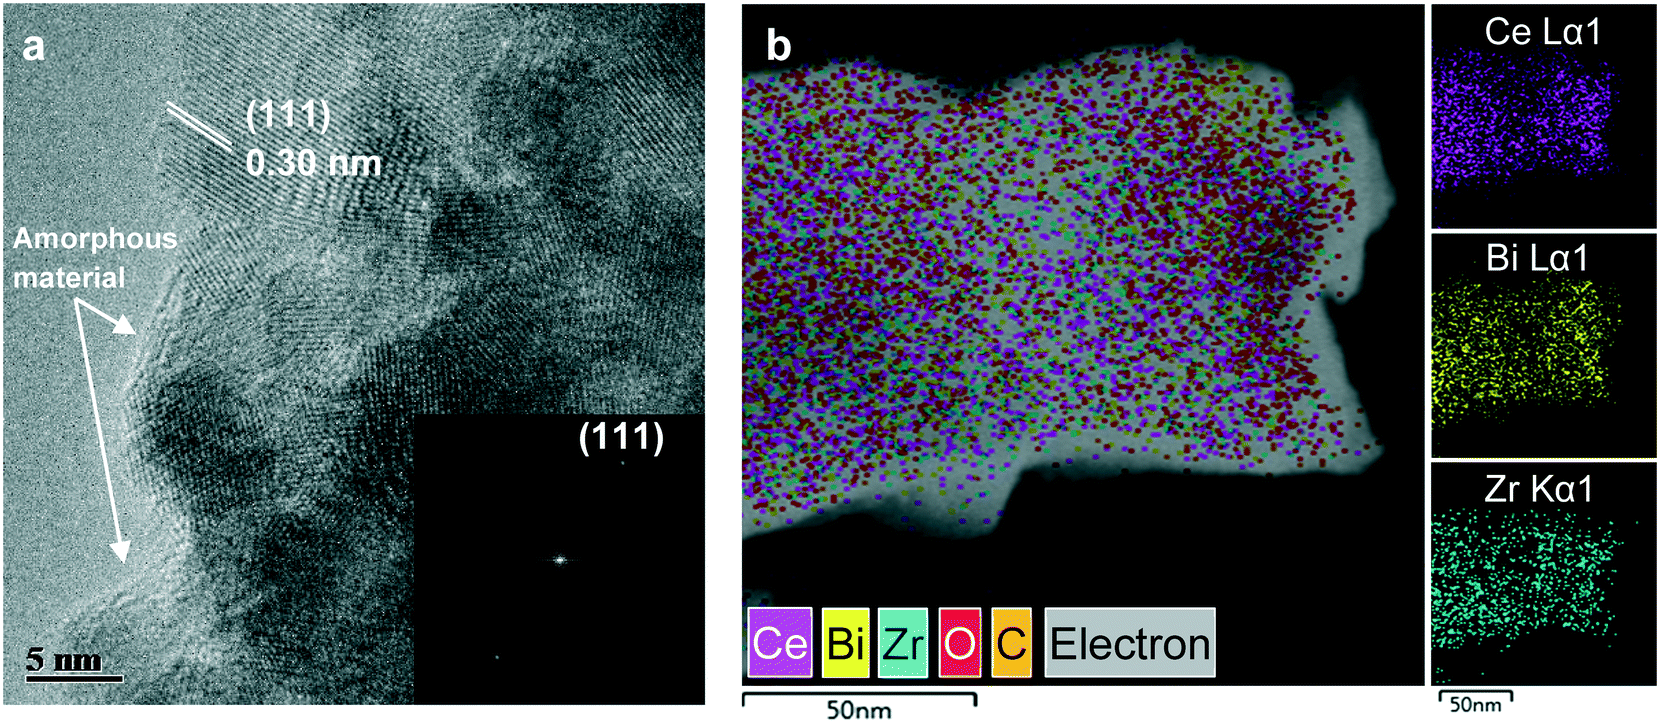 | ||
| Fig. 3 TEM images of fresh samples of Bi25Ce50Zr. (a) HRTEM image with fringe patterns corresponding to the (111) plane of ceria–zirconia. Inset: Fast Fourier transform (FFT). (b) HAADF-STEM image and EDS elemental maps of Bi Lα1, Ce Lα1 and Zr Kα1. | ||
3.2 Packed bed reactor
 | ||
| Fig. 4 Concentration profile at the reactor outlet during a typical cycle, here shown for 0.10 g of Bi25Ce0Zr at 550 °C, 1 atm. Feed gases: 2.5 vol% C2H4, 2.5 vol% H2 during reduction, 5.0 vol% O2 during oxidation, with a purge of N2 in between stages. Total flows were constant at 100 mL min−1 as measured at 293 K and 1 atm. CO2 signals were small and close to the resolution of the data acquisition (0.01 vol%). | ||
The oxygen carriers differed in their activities and in their oxygen-carrying capacities. Fig. 5 shows that as the Ce content of the support increased, the conversion of H2 increased. Also shown are the conversions of C2H4 from a separate experiment where only 5.4 vol% C2H4 was fed to the reactor. The conversions were significantly higher than in the case where H2 was co-fed with the ethylene. This shows that the activity towards the combustion of C2H4 was strongly dependent on the composition of the gas. Nonetheless, the degree of oxidation of the ethylene is substantially less than that of H2, as seen in Fig. 5. Fig. 6 shows that the oxygen-carrying capacity of each sample increased with temperature, and is higher for the intermediate ratios of Ce:Zr, consistent with existing studies.26 Bi25Ce0Zr displayed a capacity consistent with its loading of 25 wt% Bi2O3, i.e. 0.25 × 10.3 = 2.58 wt%, which again confirms the loading of bismuth (pure Bi2O3 has a capacity of 10.3 wt%). The supports were able to contribute additional lattice oxygen with the bismuth oxide without adversely affecting the selectivity, despite ceria–zirconia itself not being selective.6,25 The capacity of a bismuth-free sample, Ce0.75Zr0.25O2, was found to be 1.40 wt% at 550 °C, so the expected oxygen-capacity of the composite carrier with the addition of 25 wt% Bi2O3, assuming an ideal mixture, would then be (0.75 × 1.40) + (0.25 × 10.3) = 3.63 wt%. This is consistent with the measured value shown in Fig. 6 of 3.67 wt%, which confirms that the oxygen-carrying capacity of the ceria–zirconia phase is not affected by the addition of bismuth. Furthermore, the selectivity of the oxygen contained in the support was enhanced by the presence of a selective surface; this was apparent when comparing the amount of CO2 evolved per mass of support with and without Bi2O3, which were 18 and 34 [μmol CO2]/[g Ce0.75Zr0.25O2], respectively, despite both supports releasing the same total amount of oxygen. Lastly, the sample with pure ceria as the support did not contribute much additional lattice oxygen, despite being the most active; the lack of zirconia meant that bulk ceria was less reducible.
 | ||
| Fig. 5 Activities of the Bi25CexZr carriers during the reduction stage of the packed bed experiments. Conditions: 0.10 g of carrier, 1 atm. Feed gas: 2.5 vol% C2H4, 2.5 vol% H2, at a total flow of 100 mL min−1 as measured at 293 K and 1 atm. Note that the conversion of C2H4 corresponds to experiments where only 5.4 vol% C2H4 (and no H2) is fed. | ||
 | ||
| Fig. 6 Oxygen-carrying capacities of the Bi25CexZr carriers measured in the packed bed experiments. Conditions: 0.10 g of carrier, 1 atm. Feed gas: 2.5 vol% C2H4, 2.5 vol% H2, at a total flow of 100 mL min−1 as measured at 293 K and 1 atm. | ||
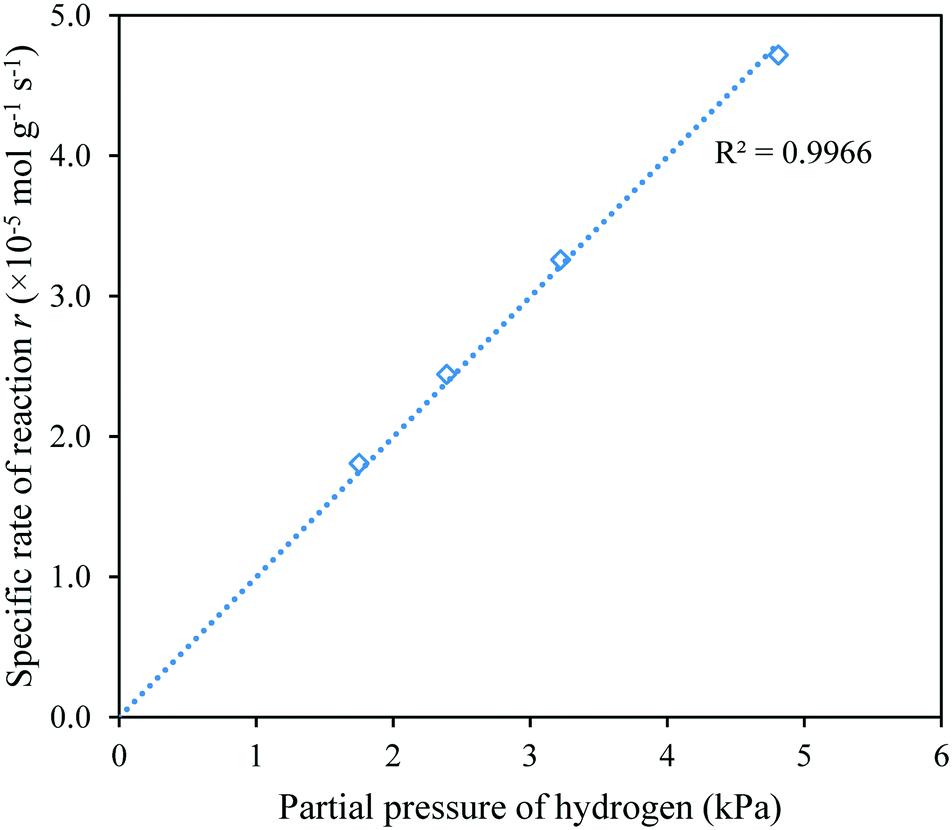 | ||
| Fig. 7 Variation of the specific rate of reaction with the partial pressure of hydrogen, shown for Bi25Ce75Zr. | ||
Fig. 8 shows how the rates of reaction varied with the conversion of the oxygen carriers. In all samples except Bi25Ce100Zr, an initial period of constant rate of reaction can be observed for up to 30% conversion of the solid. As the solid conversion increases, the rate falls because the reaction becomes starved of lattice oxygen. The overall form of the curves of r against XO is largely similar. The response of the sensor became more significant for the most active samples, Bi25Ce75Zr and Bi25Ce100Zr, indicated by the maxima being reached at higher values of XO (i.e. greater than ∼10%). The possible influence of the response of the sensor on the measured kinetics is examined further in the ESI.†
 | ||
| Fig. 8 Variation of the specific rate of reaction, r, with the conversion of a differential bed of oxygen carrier, XO. Legend entries denote values of the ratio of the mass of oxygen carrier to the total molar flow rate, W/F, at each temperature: + 450 °C, △ 475 °C, × 500 °C, □ 525 °C, ◇ 550 °C. The feed gas was 4.81 vol% H2 in N2. The conversion of H2 was <10%, and the effectiveness factor was estimated to be unity in all cases. (a) Bi25Ce0Zr, (b) Bi25Ce25Zr (c) Bi25Ce50Zr (d) Bi25Ce75Zr (e) Bi25Ce100Zr. | ||
The maximum rates of reaction in Fig. 8 were used to calculate the apparent first order rate constants according to eqn (11). These rate constants are shown in the Arrhenius plot in Fig. 9 and in Table 3. These linear fits only use T ≤ 500 °C for Bi25Ce75Zr and T ≤ 475 °C for Bi25Ce100Zr because of convolution with the sensor at the higher temperatures for these samples. It can be seen that the apparent activation energies do not vary significantly for any of the samples (with the exception of Bi25Ce75Zr), which suggests a similar rate-determining step. The similar selectivities in these bismuth-containing samples, also shown in Table 3, also suggest a common active site.
 | ||
| Fig. 9 Arrhenius plot showing the variation of the rate constant for the combustion of H2, kH2, with temperature, T for the supported bismuth oxide oxygen carriers. Legend entries refer to x in Bi25CexZr. The linear fits only use T ≤ 525 °C for Bi25Ce75Zr and T ≤ 500 °C for Bi25Ce100Zr, due to convolution with the response time at higher temperatures. | ||
| E a, H2 kJ mol−1 | k H2 × 109 mol Pa−1 g−1 s−1 | k C2H4 × 1011 mol Pa−1 g−1 s−1 |
|
|
|---|---|---|---|---|
| Bi25Ce0Zr | 82 ± 8 | 8.9 | 2.0 | 441 |
| Bi25Ce25Zr | 83 ± 5 | 12 | 3.0 | 410 |
| Bi25Ce50Zr | 87 ± 3 | 19 | 4.5 | 417 |
| Bi25Ce75Zr | 96 ± 3 | 45 | 7.6 | 589 |
| Bi25Ce100Zr | 80 ± 10 | 61 | 15 | 411 |

4 Discussion
The similarity in the selectivities, activation energies, and form of the curves of rate vs. solid conversion, independent of the composition of the support, indicates that the gas was reacting with the same solid component in all the samples, Bi2O3. This similarity may be caused by Bi2O3 wetting the ceria–zirconia surface, as suggested by de Graaf et al. (2004).6 XPS shows that the surface composition is enriched with Bi and depleted with Ce; a higher ratio of Bi to Ce would be favourable for maintaining the selectivity (because Bi active sites are selective, whereas Ce active sites are not). TEM images also shows that bismuth was spread homogeneously over the particles. The result is that the most abundant exposed active sites are on Bi2O3, as opposed to CeO2, which explains the similar selectivities. If the rate-limiting step occurs during the gas–solid reaction (as opposed to, say, transport of ions across the Bi2O3-support interface or in the bulk of the support), then this would also lead to similar apparent activation energies. This apparent independence of the surface reaction with the bulk properties of the support is beneficial because this simplifies the design and formulation of oxygen carriers. A significant dependence would have removed a degree of freedom in the design process. Where strong metal–support interaction exists, this might limit (but not completely exclude all) the range of possible oxygen carriers – a set of oxygen carriers might exist conferring strong metal–support interaction.Enhanced oxygen-carrying capacities were observed for the samples with a mixture of ceria and zirconia as the support. This enhancement, in combination with consistently high values of selectivity, demonstrates a synergistic effect between the selective bismuth oxide phase and the ceria–zirconia phase. The cyclic stability and oxygen-carrying capacity of ceria–zirconia complemented the selectivity and capacity of bismuth oxide, resulting in a composite material that performed better than either material in isolation. This synergy may be described as ‘phase cooperation’22 and is likely to have been facilitated by similar lattice parameters. The lattice parameters for the potentially relevant structures are similar; 5.4112 Å (fluorite), 5.6446 Å (tetragonal, c-axis), and 5.6549 Å (fluorite), for CeO2, β-Bi2O3, and δ-Bi2O3, respectively. In general, this could be readily applied in the design of selective oxygen carriers for chemical syntheses. This presents a solution to previous attempts at a chemical looping arrangement, which have, in some cases, been beset by poor oxygen-carrying capacities.20,39
5 Conclusions
The oxygen-donating capacity of an oxygen carrier consisting of bismuth oxide supported on ceria–zirconia was enhanced by the support. It was found that intermediate ratios of ceria–zirconia had higher oxygen-carrying capacities, and that this extra capacity did not significantly detract from the innate selectivity of the bismuth oxide for the combustion of H2 over C2H4. The selectivity of the surface was apparently decoupled from the bulk properties of the support. This demonstrates a potential solution in increasing the capacity of oxygen carriers for chemical syntheses; a selective phase may be deposited on an oxygen carrier without significant detriment to the function of either material. The first iteration in developing a formulation may simply be to select an existing catalyst, viable in conventional co-feeding mode, to deposit on the surface of a suitable oxygen carrier material. This approach would be easier than screening for a single material that possesses all the required properties.Conflicts of interest
There are no conflicts to declare.Acknowledgements
Dr H. F. Greer is acknowledged for help with the TEM imaging. Mr C. M. Amey is acknowledged for help with the XPS analysis. Ms T. E. Bell and Dr L. Torrente-Murciano are acknowledged for help with the N2-physisorption measurements. Dr E. Marek and Dr S. A. Scott are acknowledged for help with the TGA. MSCC acknowledges funding from an EPSRC Doctoral Training Grant and from an ICheme Andrew Fellowship.References
- J. Beckers and G. Rothenberg, Green Chem., 2010, 12, 939 RSC.
- M. M. Bhasin, J. H. McCain, B. V. Vora, T. Imai and P. R. Pujadó, Appl. Catal., A, 2001, 221, 397–419 CrossRef CAS.
- D. Creaser, B. Andersson, R. R. Hudgins and P. L. Silveston, Chem. Eng. Sci., 1999, 54, 4437–4448 CrossRef CAS.
- G. S. Patience and R. E. Bockrath, Appl. Catal., A, 2010, 376, 4–12 CrossRef CAS.
- J. G. Tsikoyiannis, D. L. Stern and R. K. Grasselli, J. Catal., 1999, 184, 77–86 CrossRef CAS.
- E. A. de Graaf, A. Andreini, E. J. M. Hensen and A. Bliek, Appl. Catal., A, 2004, 262, 201–206 CrossRef CAS.
- G. E. Vrieland and C. B. Murchison, Appl. Catal., A, 1996, 134, 101–121 CrossRef CAS.
- W. Kuang, Y. Fan, K. Chen and Y. Chen, J. Catal., 1999, 186, 310–317 CrossRef CAS.
- A. Lyngfelt, Appl. Energy, 2014, 113, 1869–1873 CrossRef CAS.
- J. Dennis and S. Scott, Fuel, 2010, 89, 1623–1640 CrossRef CAS.
- L.-S. Fan, L. Zeng, W. Wang and S. Luo, Energy Environ. Sci., 2012, 5, 7254 CAS.
- J. Wolf, M. Anheden and J. Yan, Fuel, 2005, 84, 993–1006 CrossRef CAS.
- L. M. Neal, S. Yusuf, J. A. Sofranko and F. Li, Energy Technol., 2016, 4, 1200–1208 CrossRef CAS.
- E. Y. Chung, W. K. Wang, S. G. Nadgouda, D. S. Baser, J. A. Sofranko and L.-S. Fan, Ind. Eng. Chem. Res., 2016, 55, 12750–12764 CrossRef CAS.
- V. Fleischer, P. Littlewood, S. Parishan and R. Schomäcker, Chem. Eng. J., 2016, 306, 646–654 CrossRef CAS.
- S. N. Khadzhiev, N. Y. Usachev, I. M. Gerzeliev, E. P. Belanova, V. P. Kalinin, V. V. Kharlamov, A. V. Kazakov, S. A. Kanaev, T. S. Starostina and A. Y. Popov, Pet. Chem., 2015, 55, 651–654 CrossRef CAS.
- A. H. Elbadawi, M. S. Ba-Shammakh, S. Al-Ghamdi, S. A. Razzak, M. M. Hossain and H. I. de Lasa, Chem. Eng. Sci., 2016, 145, 59–70 CrossRef CAS.
- Y. Gao, L. M. Neal and F. Li, ACS Catal., 2016, 6, 7293–7302 CrossRef CAS.
- R. M. Contractor, H. E. Bergna, H. S. Horowitz, C. M. Blackstone, U. Chowdhry and A. W. Sleight, in Studies in Surface Science and Catalysis, Academic Press Inc., 1988, vol. 38, pp. 645–654 Search PubMed.
- A. Godefroy, G. S. Patience, R. Cenni and J.-L. Dubois, Chem. Eng. Sci., 2010, 65, 261–266 CrossRef CAS.
- R. K. Grasselli, Top. Catal., 2002, 21, 79–88 CrossRef CAS.
- R. K. Grasselli, Catal. Today, 2014, 238, 10–27 CrossRef CAS.
- J. Beckers, A. F. Lee and G. Rothenberg, Adv. Synth. Catal., 2009, 351, 1557–1566 CrossRef CAS.
- R. K. Grasselli, D. L. Stern and J. G. Tsikoyiannis, Appl. Catal., A, 1999, 189, 1–8 CrossRef CAS.
- G. Rothenberg, E. A. de Graaf and A. Bliek, Angew. Chem., Int. Ed., 2003, 42, 3366–3368 CrossRef CAS PubMed.
- T. Kim, J. M. Vohs and R. J. Gorte, Ind. Eng. Chem. Res., 2006, 45, 5561–5565 CrossRef CAS.
- T. Montini, M. Melchionna, M. Monai and P. Fornasiero, Chem. Rev., 2016, 116, 5987–6041 CrossRef CAS PubMed.
- J. Kaspar, P. Fornasiero, G. Balducci, R. Di Monte, N. Hickey and V. Sergo, Inorg. Chim. Acta, 2003, 349, 217–226 CrossRef CAS.
- S. Brunauer, P. H. Emmett and E. Teller, J. Am. Chem. Soc., 1938, 60, 309–319 CrossRef CAS.
- D. E. Mears, Chem. Eng. Sci., 1971, 26, 1361–1366 CrossRef CAS.
- H. Gierman, Appl. Catal., 1988, 43, 277–286 CrossRef CAS.
- R. J. Berger, J. Pérez-Ramírez, F. Kapteijn and J. A. Moulijn, Chem. Eng. Sci., 2002, 57, 4921–4932 CrossRef CAS.
- G. F. Froment, J. De Wilde and K. Bischoff, Chemical reactor analysis and design, Wiley, Hoboken, NJ, 3rd edn, 2011 Search PubMed.
- M. A. Vannice, Kinetics of Catalytic Reactions, Springer US, Boston, MA, 2005 Search PubMed.
- D. E. Mears, J. Catal., 1971, 20, 127–131 CrossRef CAS.
- B. Fornberg, Math. Comput., 1988, 51, 699–699 CrossRef.
- X. L. Chen and W. Eysel, J. Solid State Chem., 1996, 127, 128–130 CrossRef CAS.
- Č. Jovalekić, M. Zdujić, D. Poleti, L. Karanović and M. Mitrić, J. Solid State Chem., 2008, 181, 1321–1329 CrossRef.
- R. M. Contractor, Chem. Eng. Sci., 1999, 54, 5627–5632 CrossRef CAS.
Footnote |
| † Electronic supplementary information (ESI) available: Calculations of rates of heat and mass transfer, and their qualification with standard diagnostic criteria for the measurement of kinetics. Limitation of the sensor response time on the measured kinetics. Calculation of oxygen-free composition from XPS. Data supporting this work are available from http://www.repository.cam.ac.uk. See DOI: 10.1039/c7cy01992k |
| This journal is © The Royal Society of Chemistry 2018 |