 Open Access Article
Photocatalytic degradation of the herbicide imazapyr: do the initial degradation rates correlate with the adsorption kinetics and isotherms?†
M. Faycal
Atitar
 a,
Asmae
Bouziani
 b,
Ralf
Dillert
 ac,
Mohamed
El Azzouzi
b and
Detlef W.
Bahnemann
 *ad
*ad
aInstitut für Technische Chemie, Leibniz Universität Hannover, Callinstrasse 3, D-30167 Hannover, Germany. E-mail: bahnemann@iftc.uni-hannover.de
bUniversity Mohammed V-Agdal, Faculty of Science, Av. Ibn Batouta, BP 1014 Rabat, Morocco
cLaboratorium für Nano- und Quantenengineering, Gottfried Wilhelm Leibniz Universität Hannover, Schneiderberg 39, 30167 Hannover, Germany
dLaboratory of Photoactive Nanocomposite Materials, Department of Photonics, Faculty of Physics, Saint-Petersburg State University, Ulianovskaia str. 3, Peterhof, Saint-Petersburg, 198504, Russia
First published on 14th December 2017
Abstract
The objective of this work is to correlate the photocatalytic degradation of the herbicide imazapyr in aqueous suspensions of the commercially available Evonik Aeroxide TiO2 P25 with the dark adsorption phenomena considering both the equilibrium state and the kinetics of adsorption. The results of this study show that the adsorption of imazapyr onto the TiO2 surface is a second-order reaction and satisfies the criteria required by the Langmuir model. The adsorbed amount of imazapyr is found to be high at pH 3 and to decrease with increasing pH. The kinetics of the photocatalytic degradation of imazapyr were analysed taking into account the effect of the pH as well as of the catalyst mass concentration. However, special attention was focussed on the influence of the reactant concentration on the reaction rate. The Langmuir–Hinshelwood model fitting revealed that the apparent adsorption constant obtained under irradiation is significantly larger than the adsorption constant obtained in the dark. The initial reaction rates of the photocatalytic imazapyr degradation were larger than the initial adsorption rates of the probe molecule on the TiO2 surface. It is therefore concluded that the photocatalytic imazapyr degradation does not follow necessarily a Langmuir–Hinshelwood mechanism despite the fact that a rate law having the mathematical form of the Langmuir–Hinshelwood rate law was successfully used to describe the observed dependence of the initial reaction rates on the initial concentrations. A Langmuir–Hinshelwood mechanism for the photocatalytic imazapyr degradation is compatible only with the additional assumption that the rate constant of adsorption increases by irradiation with UV light.
Introduction
TiO2 photocatalysts in their different forms and polymorphs have attracted considerable attention in the past decades because they are highly photo-reactive, cheap, non-toxic, chemically and biologically inert, and photo-stable. These properties allow possible applications for the purification of polluted water and air, the development of self-cleaning super-hydrophilic surfaces, and the conversion of energy.1–3 In the past 25 years great advances have been made turning TiO2 photocatalysis into an interesting issue not only for industrial applications but also for fundamental research. However, there are still several issues, approaches, and mechanisms in the field of photocatalysis that remain unclear.The photocatalytic reaction is assumed to occur on the surface of the photocatalyst, and therefore a large adsorption capacity is expected to favour the reaction kinetics.4 Both the organic compound being degraded and the TiO2 surface affect the adsorption process and the photocatalytic reaction. Furthermore, it was reported that a pre-adsorption of reactants onto the TiO2 surface in the dark preceding the photocatalytic reaction results in a more efficient interfacial electron transfer process.5,6 Bahnemann et al. have used laser flash photolysis experiments to investigate the kinetics of the interfacial electron transfer between an excited semiconductor and electron donor and/or acceptor molecules present in the surrounding aqueous phase. These authors found that the adsorption of the probe compounds dichloroacetate and thiocyanate on the TiO2 surface prior to the band gap excitation was a prerequisite for efficient hole scavenging.7
Friedmann et al. have discussed the parameters affecting the kinetics and mechanisms of the photocatalytic process. These parameters can be subdivided into those that are intrinsic to the photocatalytic material and those that are extrinsic being influenced by the surrounding environment and conditions (e.g., pH, ionic strength, and the nature of the solvent). All these parameters mentioned before affect the adsorption rate and type, as well as the photocatalytic reaction rate. However, the specific mode of action of a given parameter on the photocatalytic performance of a TiO2 sample is difficult to characterize since many of the before mentioned parameters are coupled.4
The assessment of the reaction kinetics is fundamental to evaluate and compare the performance of the catalyst. Furthermore, kinetic analysis can also be employed to prove the validity of a proposed mechanism.8,9 The interpretation of the results of the kinetics studies of TiO2 photocatalytic systems for water treatment and the elucidation of the underlying mechanisms have relied largely on the Langmuir–Hinshelwood (classical or modified) rate laws. Details of this kinetics with its underlying adsorption model (Langmuir–Hinshelwood mechanism) have been critically discussed in several publications.1,10–18
It seems that most authors suppose that a heterogeneous photocatalytic reaction is a bimolecular reaction between two species present on the surface of the photocatalyst. The substrate to be oxidized, of course, is one of the surface-bound species while either a valence band hole or an OH radical on the surface of the semiconductor is the second species. For a batch system the rate law is then to be written as
 | (1) |
 , nox and nos being the concentration of the probe molecule dissolved in the aqueous phase, the irradiation time, the volume of the suspension, the reaction rate constant (in mol−1 s−1), the total amount of the oxidizing species in the whole reaction volume, and the total amount of adsorbed probe molecules (both in mol), respectively. Using a pseudo-steady state approach,11,12 this rate law can be written as
 | (2) |
 | (3) |
Eqn (2) with eqn (3) corresponds to the rate law as derived for a thermal catalytic reaction which proceeds according to the “Langmuir–Hinshelwood single-site mechanism”.19 At this point, it should be noted that in 1926 Hinshelwood, and later Schwab, interpreted this rate late in its mathematically equivalent form  (derived for catalytic reactions of gases on surfaces) on the basis of the Langmuir adsorption isotherm.20–24 In 1931, Schwab also pointed out that this rate law is also suitable to analyse the kinetics of catalytic reactions of organic compounds in colloidal solutions of metals.24 In 1939, Gopala Rao expressly referred to the Langmuir adsorption isotherm to explain the experimentally observed photocatalytic oxidation kinetics of ammonia in irradiated TiO2 suspension.25
It is usually assumed that the photocatalytic process is a two-step process comprising a fast adsorption/desorption equilibrium and subsequently a slow surface step, i.e.,  . Consequently, the kinetic parameter KLH becomes equal to the Langmuir adsorption constant KL = ka/kd, which is determined from the adsorption isotherms. However, eqn (3) shows that the parameter KLH is less than or equal to KL. Accordingly, only a few authors have reported experimental KLH values being larger than the corresponding KL values.26–35
It is understood that the derived equation assumes that the adsorption rate of the probe molecules is always larger than the reaction rate, i.e., the reaction is not inhibited by mass transfer.
Papers reporting about the correlation between the photocatalytic degradation rate of an organic substrate and both its adsorption isotherms and adsorption kinetics are rare.31,36–39 Therefore, we have carried out respective investigations with imazapyr [2-(4-isopropyl-4-methyl-5-oxo-2-imidazolin-2-yl) nicotinic acid] as the probe molecule. Imazapyr is a non-selective herbicide used for the control of weeds.40 Many researchers have investigated the photocatalytic degradation of imazapyr covering the influence of several operating parameters using commercial TiO2 powders, mainly P25. The effect of the pH of the suspension, the temperature, the addition of electron acceptors such as potassium persulfate and hydrogen peroxide, as well as the presence of heavy metals on the imazapyr degradation kinetics have been studied.40–43
Recently Atitar et al. have investigated the adsorption of imazapyr onto the TiO2 surface by means of ATR-FTIR spectroscopy. The authors have concluded that the favoured binding mode of imazapyr to the TiO2 surface is the bridging mode via the carboxylic group. Besides of that, the authors proposed that the bridging oxygen in the neighbourhood of the adsorbed species serves as trap for a hole generated upon the absorption of UV light.44 But it has been reported by Carrier et al. that also OH radicals play an important role in the photocatalytic degradation of imazapyr. The authors have determined the primary position for OH radical (being besides other properties an electrophilic species) attack on imazapyr by means of electron density calculations, and reported that this attack occurs preferably at the atoms with the largest electron density. Furthermore, these authors have presented a detailed degradation pathway of imazapyr.42
However, the importance of the adsorption for the overall photocatalytic process is still doubtful. No uniform information concerning the optimum pH for the photocatalytic degradation of imazapyr using TiO2 could be extracted from the literature. The highest degradation rates have been reported to occur at pH 3,44 and at pH 3.8;42 other research groups have reported a maximum value at pH 4,43 and at pH 4.3,41 respectively.
The aim of this work is to find a possible correlation between the photocatalytic degradation rate and the adsorption behaviour of imazapyr at the TiO2 surface. Therefore, the kinetics of the photocatalytic oxidation of imazapyr as well as the kinetics of the imazapyr adsorption in the dark have been investigated at different pH values to reveal the role of the adsorption of imazapyr onto the TiO2 surface in the photocatalytic degradation process.
Experimental section
Materials
Imazapyr (Pestanal, purity >99%) was purchased from Sigma-Aldrich (Germany). All solvents used for HPLC (high performance liquid chromatography) analysis were chromatography grade and were also obtained from Sigma-Aldrich (Germany); all other chemicals were of analytical grade and used without any further purification. The water used in all experimental runs was deionized water (resistivity = 18.2 MΩ cm) collected from a Sartorius Arium 611 deionizer.The commercial photocatalyst used in this study was Evonik Aeroxide P25 (mainly anatase with a rutile content of ca. 20%, a primary particle size of around 21 nm, and a BET surface area of 50 m2 g−1).
Methods
All photocatalytic degradation experiments were performed using a Pyrex-Glass® cylindrical reactor irradiated from the top with an assembly of six UV-A lamps (Philips Cleo 15 W; emission, 300 < λ < 400 nm; λmax = 365 nm) under continuous stirring. A scheme of the experimental set-up is shown in chapter SI-2 in the ESI.† For the kinetic studies, samples were taken at regular time intervals and were analyzed after filtration by high performance liquid chromatography (HPLC). The temperature (21 ± 1 °C) remained constant during the experimental runs.
All experimental runs to investigate the adsorption kinetics, the adsorption isotherms, and the photodegradation kinetics were performed in 2–3 replicates. This allows values to be obtained with an experimental error ≤10%. This error is considered to be the sum of all random experimental errors including the HPLC instrument error and the error intrinsic to mathematical calculations from the experimental concentration vs. time plots.
Results
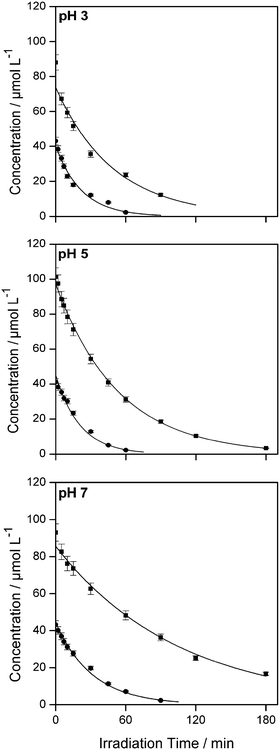
Fig. 1 shows a typical experimental dataset of the photocatalytic decomposition of imazapyr. The data points of all experimental runs were well fitted using an exponential decay model. Thus, the reaction rate rr of the photocatalytic oxidation of imazapyr can obviously be described by a first order rate law,
 | (4) |
 | (5) |
The influence of the initial concentration of the solute on the actual photocatalytic degradation rate of most organic compounds is usually rationalized employing a Langmuir–Hinshelwood type rate law
 | (6) |
Inserting the eqn (4) in 6 yields with Ct = Ce,0 at t = 0
 | (7) |
 | (8) |
| pH | 3 | 5 | 7 |
|---|---|---|---|
| Experimental conditions: 20 ≤ C0 ≤ 200 μmol L−1, TiO2 P25, Cc = 2.5 g L−1, V = 100 mL. | |||
| k r/μmol L−1 min−1 | 2.97 | 2.95 | 1.24 |
| K LH/10−3 L μmol−1 | 56.5 | 38.3 | 129 |
| R 2 | 0.987 | 0.982 | 0.971 |
From a mathematical point of view the relation  holds when the condition KLHCt ≪ 1 is fulfilled. With this boundary condition the Langmuir–Hinshelwood type rate law (eqn (6)) can be approximated by an apparent first-order rate law as it is given in eqn (4). With the KLH-values given in Table 1 and the initial imazapyr concentrations employed in this study (Ce,0 > 15 μmol L−1) the product KLHCt is calculated to be always larger than 0.55 at t = 0. The imazapyr concentration must therefore become considerably smaller until the condition for first-order kinetics is fulfilled. The first-order kinetics observed here (Fig. 1) thus obviously do not correspond to the assumption of the limiting case of the Langmuir–Hinshelwood kinetics.
 | (9) |
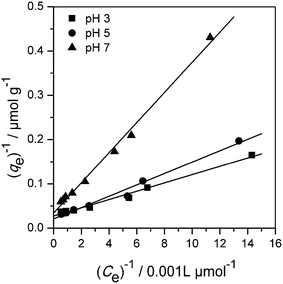
Fig. 3 shows the amount of imazapyr adsorbed at the TiO2 surface plotted versus the concentration of the probe molecule in the aqueous phase after the adsorption equilibrium has been established. Langmuir–Hinshelwood kinetics which has been employed above to describe the time course of the imazapyr concentration during photocatalytic degradation experiments are based on the assumption that the absorption of the probe molecule can be described by the Langmuir adsorption isotherm
 | (10) |
 | (11) |
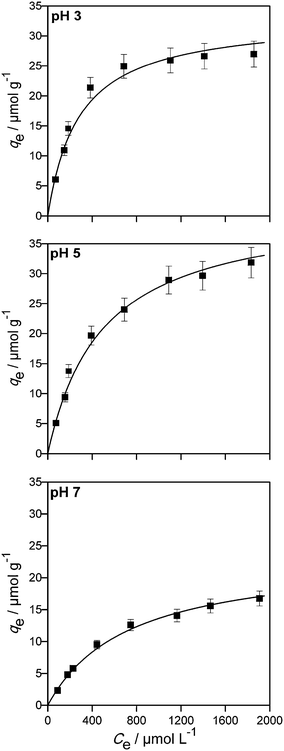 | ||
| Fig. 3 Adsorption isotherms of imazapyr onto Aeroxide TiO2 P25 at different pH values. The lines have been calculated employing eqn (10) and the data given in Table 2. Experimental conditions: 100 ≤ C0 ≤ 2000 μmol L−1, TiO2 P25, Cc = 5.0 g L−1, V = 100 mL. | ||
| pH | 3 | 5 | 7 |
|---|---|---|---|
| Experimental conditions: 100 ≤ C0 ≤ 2000 μmol L−1, TiO2 P25, Cc = 5 g L−1, V = 100 mL. | |||
| q m/μmol g−1 | 30.8 | 40.0 | 22.8 |
| K L/10−3 L μmol−1 | 4.52 | 2.23 | 1.46 |
| R 2 | 0.997 | 0.987 | 0.993 |
| K LH/KL | 12.5 | 17.1 | 88.4 |
The analysis of the experimental data employing the Freundlich model of adsorption resulted also in good fitting of the experimental data (0.915 ≤ R2 ≤ 0.996, see chapter SI-5†). However, the Langmuir model was slightly better than the Freundlich model.
The Langmuir isotherm model was found suitable to describe the imazapyr adsorption equilibrium (0.987 ≤ R2 ≤ 0.997). The maximum monolayer capacity of adsorbent qm increased with increasing the pH value from pH 3 to pH 5, and decreased again at pH 7. The Langmuir adsorption constant KL is a measure for the affinity between adsorbate and adsorbent with its reciprocal value yielding the concentration at which half of the maximum adsorption capacity of the adsorbent is reached.48 The constant KL decreased with increasing the pH from 3 to 7, indicating that the adsorption density was higher at a lower pH.
It becomes obvious that the values for KLH which have been calculated from the concentration vs. time plots of the photocatalytic degradation experiments (Table 1) are larger by a factor 10−100 than the values for the adsorption constant KL at all pH values studied here (Table 2).
With the values for the maximum capacity of the adsorbent, qm, given in Table 2 and the known surface area of the photocatalyst (50 m2 g−1), the amount of adsorbed molecules per unit area is calculated as 0.616 μmol m−2 (0.37 molecule per nm2), 0.800 μmol m−2 (0.48 molecule per nm2) and 0.456 μmol m−2 (0.27 molecule per nm2) at pH 3, pH 5 and pH 7, respectively. With the surface area and the density of the photocatalyst (ρ = 3.8 × 10⁶ g m−3 for anatase), a radius of 15.8 nm is calculated for a single photocatalyst particle. Consequently, a single photocatalyst particle with a surface area of approximately 3100 nm2 will be fully covered by 1162, 1509 and 860 imazapyr molecules at pH 3, pH 5 and pH 7, respectively. One imazapyr molecule on the surface thus demands an area between 2.1 and 3.2 nm2. These values are in reasonable agreement with the values calculated from the geometry of an imazapyr molecule.
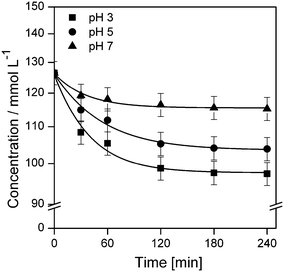 | ||
| Fig. 5 Plot of imazapyr concentration vs. time during the adsorption onto TiO2 P25 at different pH values. Experimental conditions: C0 = 126.5 μmol L−1, Cc = 5 g L−1, V = 20 mL. | ||
The obtained experimental data have been analysed using a pseudo-second order kinetic model. The pseudo second order equation based on adsorption equilibrium capacity is expressed by
 | (12) |
 is the pseudo-second-order rate constant (g μmol−1 min−1).49–51 Integration with the initial condition qt = 0 at t = 0 results in
 | (13) |
The plots of the fitted experimental data are presented in Fig. 6. The calculated values of qe and  as well as the correlation coefficients are summarized in Table 3. Based on the obtained correlation coefficient values, it is concluded that the pseudo-second order model describes well the adsorption kinetics of imazapyr onto TiO2. The Lagergreen pseudo-first order model50,52,53 was also used for the analysis of the experimental data (see chapter SI-6†), but the best accordance between the experimental and the calculated values was obtained with the pseudo-second-order kinetic model.
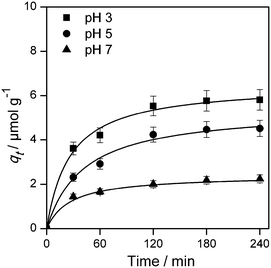 | ||
| Fig. 6 Plot of the amount of adsorbed species (qt) vs. contact time at different pH value fitted to the pseudo-second order rate law given in eqn (13). Experimental conditions: C0 = 126.5 μmol L−1, TiO2 P25, Cc = 5 g L−1, V = 20 mL. | ||
Discussion
It has been assumed that the dark adsorption as well as the structure of the adsorbate play an important role for the photocatalytic degradation of imazapyr.42,44 The favoured mode of adsorption as a bridged surface complex44 followed by the direct hole oxidation of the carboxyl moiety by means of the photo-Kolbe reaction is one of the degradation pathways where adsorption is assumed to play an important role.42,44 However, the latter is not the main pathway in the overall photocatalytic process. Carrier et al. have reported that OH radicals can attack the atoms directly at the position of the largest electron density in the imazapyr molecule.42 These species (i.e., OH radicals) can be generated through the oxidative pathway by the reaction of valence band holes with H2O/OH− being present at the photocatalyst surface, and/or through the reductive pathway by the reaction of conduction band electrons with adsorbed molecular oxygen. The latter is usually neglected in the photocatalytic degradation of organic pollutants and is considered to play an important role in case of imazapyr photodegradation.In this work, the reaction rates, the adsorption rates and the adsorption isotherms were determined at three different pH values with the aim of obtaining further insights into the mechanism underlying the photocatalytic degradation of imazapyr. The inorganic ions H+, K+, NO3−, and ClO4− have been added to the aqueous TiO2 suspensions to establish the desired pH value and to keep constant the ionic strength. It is known that inorganic ions might interact with the photocatalyst surface, thus, affecting the adsorption and the photocatalytic degradation of organic probe molecules.54–58 It is, therefore, understood that the quantitative results presented here may be particularly dependent on the kind and concentration of the added anions. However, it has been reported that NO3− and ClO4− interact only weakly with the TiO2 surface and have only little effect on the rate of the photocatalytic degradation.55–58 In the following discussion, it is therefore assumed that the abovementioned ions do not significantly influence the kinetics of the photocatalytic degradation nor the adsorption kinetics and the adsorption equilibrium.
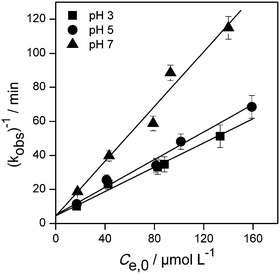
The photodegradation kinetics of imazapyr in TiO2 suspensions have been modeled employing a Langmuir–Hinshelwood type rate law (eqn (2)) which is a manifestation of the general case of saturation-type kinetics. The plots of the reciprocal rate constants vs. the reciprocal initial equilibrium concentrations Ce,0 are shown in Fig. 2. The linear relationships indicate that the degradation kinetics under UV irradiation can be described by a Langmuir–Hinshelwood type rate law. The fitting parameters kr and KLH derived from this Fig. 2 are summarized in Table 1.
The analysis of the adsorption data obtained in the dark, using the Langmuir adsorption isotherms, shows a good accordance between the experimental and the calculated data. This implies that the TiO2 and the imazapyr are strongly interacting. It is worth to note that the Langmuir model assumes the adsorption energy to be uniform over the whole surface and that there is no interaction between the adsorbed species. Furthermore, only chemical interactions are considered. Thus only monolayers of the adsorbate can be formed on the surface of the adsorbent. The results of the adsorption experiments indicate that the maximum monolayer capacity of the adsorbent qm is 30 μmol g−1 at pH 3, and increases to reach 40 μmol g−1 at pH 5. Moreover, it decreases to 23 μmol g−1 at pH 7.
With the data given in Table 2 and assuming an initial equilibrium imazapyr concentration of 100 μmol L−1 in the liquid phase it is calculated that the amount of imazapyr adsorbed at the TiO2 surface in the dark is decreasing from 9.6 μmol g−1 at pH 3 to 2.9 μmol g−1 at pH 7. If the amount of the organic molecules (imazapyr) adsorbed on the surface of the photocatalyst is decisive for the rate of the photocatalytic degradation, it is expected that the photocatalytic degradation rate as well as the rate of imazapyr adsorption follows the same trend: at pH 3, the rates should therefore be the highest and the rates should decrease with increasing pH. In fact, this decrease of the rates with increasing pH was observed for both, the photocatalytic degradation and the adsorption, in the experimental runs performed here (Table S1 and Fig. S2†).
Taking into account that the probe molecule imazapyr exhibits five distinct species with three pKa values (1.88, 3.60 and 10.80) (cf.Scheme 1) and TiO2 has a pH dependent surface charge, any interaction between the probe molecule and the photocatalyst surface can be explained assuming attractive and repulsive forces between these species. In the range between pH 2 and pH 4 the neutral imazapyr molecule is interacting with the positively charged TiO2 surface possibly via the COOH group by dissociative adsorption. Moderate acidic conditions between pH 4 and pH 6 lead to a strong electrostatic interaction between the positively charged TiO2 surface and the organic solutes that mainly exist in their deprotonated negatively charged form (cf.Scheme 1). However, at a pH > pHzpc = 6.9 (TiO2 P25)59 both imazapyr as well as the TiO2 surface are negatively charged resulting in a substantial repulsion between these species retarding adsorption which in turn will significantly negatively affect the photocatalytic degradation. Carrier et al. as well as Osajima et al. have concluded that the dependence of the degradation rate on the pH of the suspension is due to these interactions between imazapyr species and the TiO2 surface.40,42 Additionally, the interaction is found to be more favourable between the deprotonated imazapyr molecule IV in Scheme 1 and the protonated TiO2 surface as TiOH2+.40,44
Thus, the pH dependence of the determined rates for the adsorption and the photocatalytic degradation on the basis of electrostatic interactions between imazapyr and the TiO2 surface can be explained. This explanation does not contradict the assumption that the probe molecule is photocatalytically degraded by a Langmuir–Hinshelwood mechanism. However, this mechanism presupposes that the rate of the photocatalytic reaction rate is smaller than or equal to the rate of imazapyr adsorption (rr ≤ ra, cf.eqn (2) in combination with eqn (3)). But the adsorption equilibria in the dark were only established after more than two hours (Fig. 5).
To perform the comparison between these rates, the initial reaction rates, rr,0, of the imazapyr degradation have been calculated considering the concentration of the photocatalyst in the aqueous suspension (Table S4†). The initial adsorption rates of imazapyr, ra,0, have been calculated using the pseudo-second order equation (eqn (12)) with the initial condition qt = 0 at t = 0. The amount of the adsorbed substrate qe in the initial equilibrium was calculated employing eqn (10) and the parameters of the Langmuir isotherm (Table 2):
 | (14) |
The calculation of the initial adsorption rates has been performed for different initial imazapyr concentrations (chapter SI-8†) to reveal the correlation to the initial degradation rate, as well as the effect of the initial concentration of imazapyr. However, the comparison of the initial imazapyr degradation rates with the initial imazapyr dark adsorption rates at different pH values (Fig. 7) shows that the initial photocatalytic reactions are always faster than the dark adsorption. In other words, the initial photocatalytic degradation rate of imazapyr was found to be 2–3 times larger than its initial adsorption rate obtained in the dark.
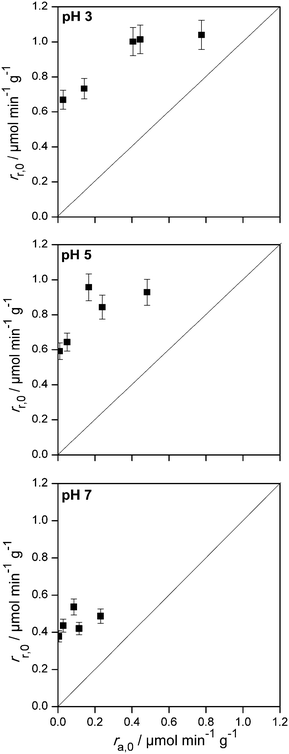 | ||
| Fig. 7 Initial photocatalytic degradation rate vs. initial dark adsorption rate of imazapyr at different pH values. | ||
If one does not want to abandon the idea that the photocatalytic degradation reaction occurs according to an Langmuir–Hinshelwood mechanism, one must demand that the rate constant of the adsorption under irradiation with UV light is drastically increasing. This would inevitably also result in a value for KLH determined experimentally under exposure to UV light being greater than the value of KL determined from adsorption isotherms in the dark.
In fact, it was found here that the kinetic parameters KLH are significantly greater than the adsorption constants KL for all investigated pH values (KLH/KL ≥ 12.5, cf.Table 2). A ratio KLH/KL > 1 (i.e., KLH > KL) has also been observed for other probe molecules such as salicylic acid and other substituted benzoic acids,26,31 phenol,27 4-chlorophenol,28,33,34 di- and tri-substituted phenols,32,34,35 acetophenone,30 and eosin.29
Matthews has explained the observation of KLH > KL suggesting that reactions between freely diffusing OH radicals and the organic substrate occur in the suspension in addition to the surface reaction.27 Some authors have suggested this discrepancy to be due to photoadsorption followed by a fast photoreaction of the probe molecule on the TiO2 surface.26,29 Other authors have attributed this observation to a redistribution of the electrons under irradiation possibly altering the adsorption sites and thus the substrate-surface interaction.30,35 Ollis has assumed that sites associated with the photocatalytic reaction are different to those where dark adsorption occurs. Possibly, the reactive adsorption sites are only produced under irradiation.12 The possibility that these new adsorption sites are formed by deaggregation of titanium dioxide clusters which are known to be present in aqueous suspensions should not be excluded. Deaggregation is decreasing the cluster size and increasing the available surface area of the photocatalyst,60,61 and possibly yields new high-energy surfaces. It has been shown for very small particles that the dark adsorption constant depends on the particle diameter.62–64 This has been rationalized with a driving force to decrease the total free energy by adsorption of molecules from the surrounding environment.62 The experimental results presented here can only be reconciled with a Langmuir–Hinshelwood mechanism by assuming light-induced changes of the photocatalyst surface which have a significant effect on the adsorption of the probe molecule.
Conclusion
The adsorption kinetics and the adsorption–desorption equilibrium of imazapyr in TiO2 aqueous suspensions have been studied in the dark. Adsorption equilibria were only established after more than two hours in the dark. The dark adsorption of imazapyr has been successfully described by a Langmuir adsorption isotherm; the maximum coverage of the surface was found to be pH-dependent. The kinetics of the adsorption in the dark was described employing a pseudo-second order rate law.The rate of the photocatalytic degradation of imazapyr in the presence of TiO2 was also found to be pH-dependent. The observed decrease of the imazapyr concentration during irradiation could be described by a first-order kinetics. The dependence of the initial reaction rate on the initial equilibrium concentration of the probe molecule in the aqueous phase could be described by a Langmuir–Hinshelwood type rate law. However, the Langmuir adsorption constants determined from the adsorption isotherms of imazapyr in the presence of TiO2 in the dark were smaller than the adsorption constant determined from the analysis of the Langmuir–Hinshelwood type kinetics of the photocatalytic degradation of the probe molecule. Under the experimental conditions of this study the rate of the photocatalytic reactions were found to be always higher than the rate of the adsorption of imazapyr in the dark. In other words, the overall rate of the photocatalytic oxidation of imazapyr is not determined by the dark adsorption of the probe molecule onto the TiO2 surface.
Consequently, it can be concluded that imazapyr degradation does not follow necessarily a Langmuir–Hinshelwood mechanism despite the fact that a rate law having the mathematical form of the Langmuir–Hinshelwood rate law can be used successfully to describe the observed dependence of the initial reaction rate on the initial concentration. A Langmuir–Hinshelwood mechanism for the photocatalytic imazapyr degradation is compatible only with the additional assumption that the adsorption–desorption kinetics are also affected by irradiation with UV light, and in particular that the adsorption rate increases significantly.
Conflicts of interest
There are no conflicts to declare.Acknowledgements
Mohamed Faycal Atitar gratefully acknowledges a scholarship from the DAAD in the frame of the Sandwich-Program. Financial support of the BMBF in the framework of an international collaboration between Morocco and Germany is gratefully acknowledged (FKZ: 01DH12028).References
- M. R. Hoffmann, S. T. Martin, W. Choi and D. W. Bahnemann, Chem. Rev., 1995, 95, 69–96 CrossRef CAS.
- J. Schneider, M. Matsuoka, M. Takeuchi, J. Zhang, Y. Horiuchi, M. Anpo and D. W. Bahnemann, Chem. Rev., 2014, 114, 9919–9986 CrossRef CAS PubMed.
- M. Grätzel, Nature, 2001, 414, 338–344 CrossRef PubMed.
- D. Friedmann, C. Mendive and D. Bahnemann, Appl. Catal., B, 2010, 99, 398–406 CrossRef CAS.
- R. W. Matthews, Chem. & Ind., 1988, 4, 28–30 Search PubMed.
- T. Tachikawa, M. Fujitsuka and T. Majima, J. Phys. Chem. C, 2007, 111, 5259–5275 CAS.
- D. W. Bahnemann, M. Hilgendorff and R. Memming, J. Phys. Chem. B, 1997, 101, 4265–4275 CrossRef CAS.
- G. Camera-Roda, V. Augugliaro, A. G. Cardillo, V. Loddo, L. Palmisano, F. Parrino and F. Santarelli, Catal. Today, 2016, 259, 87–96 CrossRef CAS.
- G. Camera-Roda, V. Loddo, L. Palmisano and F. Parrino, Catal. Today, 2017, 281, 221–230 CrossRef CAS.
- C. S. Turchi and D. F. Ollis, J. Catal., 1990, 122, 178–192 CrossRef CAS.
- D. F. Ollis, Top. Catal., 2005, 35, 217–223 CrossRef CAS.
- D. F. Ollis, J. Phys. Chem. B, 2005, 109, 2439–2444 CrossRef CAS PubMed.
- A. Mills and S. Le Hunte, J. Photochem. Photobiol., A, 1997, 108, 1–35 CrossRef CAS.
- A. V. Emeline, V. K. Ryabchuk and N. Serpone, J. Phys. Chem. B, 2005, 109, 18515–18521 CrossRef CAS PubMed.
- D. Monllor-Satoca, R. Gómez, M. González-Hidalgo and P. Salvador, Catal. Today, 2007, 129, 247–255 CrossRef CAS.
- B. Ohtani, Chem. Lett., 2008, 37, 216–229 CrossRef.
- B. Ohtani, J. Photochem. Photobiol., C, 2010, 11, 157–178 CrossRef CAS.
- B. Ohtani, Electrochemistry, 2014, 82, 414–425 CrossRef CAS.
- H. S. Fogler, Elements of chemical reaction engineering, Prentice Hall international series in the physical and chemical engineering sciences, Pearson Education Internat, Upple Saddle River, NJ, 4th edn, 2011 Search PubMed.
- C. N. Hinshelwood, The kinetics of chemical change in gaseous systems, Clarendon Press, Oxford, 1st edn, 1926 Search PubMed.
- G.-M. Schwab, in Ergebnisse der Exakten Naturwissenschaften, Springer Berlin Heidelberg, Berlin, Heidelberg, 1928, pp. 276–341 Search PubMed.
- G.-M. Schwab and E. Pietsch, Z. Phys. Chem., Abt. B, 1928, 1, 385 Search PubMed.
- G.-M. Schwab and E. Pietsch, Z. Elektrochem. Angew. Phys. Chem., 1929, 35, 135–141 CAS.
- G.-M. Schwab, Katalyse vom Standpunkt der Chemischen Kinetik, Springer Berlin Heidelberg, Berlin, Heidelberg, 1931 Search PubMed.
- G. Gopala Rao, Z. Phys. Chem., Abt. A, 1939, 184, 377–384 Search PubMed.
- J. Cunningham and G. Al-Sayyed, J. Chem. Soc., Faraday Trans., 1990, 86, 3935–3941 RSC.
- R. W. Matthews and S. R. McEvoy, J. Photochem. Photobiol., A, 1992, 64, 231–246 CrossRef CAS.
- A. Mills and S. Morris, J. Photochem. Photobiol., A, 1993, 71, 75–83 CrossRef CAS.
- F. Zhang, J. Zhao, T. Shen, H. Hidaka, E. Pelizzetti and N. Serpone, Appl. Catal., B, 1998, 15, 147–156 CrossRef CAS.
- Y. Xu and C. H. Langford, J. Photochem. Photobiol., A, 2000, 133, 67–71 CrossRef CAS.
- S. M. Ould-Mame, O. Zahraa and M. Bouchy, Int. J. Photoenergy, 2000, 2, 59–66 CrossRef CAS.
- E. Kusvuran, A. Samil, O. M. Atanur and O. Erbatur, Appl. Catal., B, 2005, 58, 211–216 CrossRef CAS.
- A. Mills, J. Wang and D. F. Ollis, J. Phys. Chem. B, 2006, 110, 14386–14390 CrossRef CAS PubMed.
- E. Pino and M. V. Encinas, J. Photochem. Photobiol., A, 2012, 242, 20–27 CrossRef CAS.
- E. P. Melián, O. G. Díaz, J. M. D. Rodríguez, J. Araña and J. P. Peña, Appl. Catal., A, 2013, 455, 227–233 CrossRef.
- H. Y. Chen, O. Zahraa, M. Bouchy, F. Thomas and J. Y. Bottero, J. Photochem. Photobiol., A, 1995, 85, 179–186 CrossRef CAS.
- D. Chakrabortty and S. Sen Gupta, J. Environ. Sci., 2013, 25, 1034–1043 CrossRef CAS.
- D. Chakrabortty and S. Sen Gupta, Indian J. Chem. Technol., 2015, 22, 34–41 Search PubMed.
- N. Haddou, M. R. Ghezzar, F. Abdelmalek, S. Ognier and A. Addou, Plasma Sci. Technol., 2013, 15, 915–922 CrossRef.
- J. A. Osajima, H. M. Ishiki and K. Takashima, Monatsh Chem., 2008, 139, 7–11 CrossRef CAS.
- P. Pizarro, C. Guillard, N. Perol and J. M. Herrmann, Catal. Today, 2005, 101, 211–218 CrossRef CAS.
- M. Carrier, N. Perol, J.-M. Herrmann, C. Bordes, S. Horikoshi, J. O. Paisse, R. Baudot and C. Guillard, Appl. Catal., B, 2006, 65, 11–20 CrossRef CAS.
- G. Kaichouh, N. Oturan, M. A. Oturan, A. El Hourch and K. El Kacemi, Environ. Technol., 2008, 29, 489–496 CrossRef CAS PubMed.
- M. F. Atitar, R. Dillert and D. W. Bahnemann, J. Phys. Chem. C, 2017, 121, 4293–4303 CAS.
- H. Al-Ekabi and N. Serpone, J. Phys. Chem., 1988, 92, 5726–5731 CrossRef CAS.
- G. Mills and M. R. Hoffmann, Environ. Sci. Technol., 1993, 27, 1681–1689 CrossRef CAS.
- J. Cunningham, G. Al-Sayyed, P. Sedlak and J. Caffrey, Catal. Today, 1999, 53, 145–158 CrossRef CAS.
- A. F. Alkaim, T. A. Kandiel, F. H. Hussein, R. Dillert and D. W. Bahnemann, Catal. Sci. Technol., 2013, 3, 3216 CAS.
- Y. Ho and G. McKay, Process Biochem., 1999, 34, 451–465 CrossRef CAS.
- H. Qiu, L. Lv, B. Pan, Q. Q. Zhang, W. Zhang and Q. Q. Zhang, J. Zhejiang Univ., Sci., A, 2009, 10, 716–724 CrossRef CAS.
- Y. S. Ho, J. C. Y. Ng and G. McKay, Sep. Purif. Methods, 2000, 29, 189–232 CrossRef CAS.
- S. Lagergren, K. Sven. vetensk.akad. handl., 1898, 24, 1–39 Search PubMed.
- Y. S. Ho, Scientometrics, 2004, 59, 171–177 CrossRef CAS.
- M. Lindner, D. W. Bahnemann, B. Hirthe and W.-D. Griebler, J. Sol. Energy Eng., 1997, 119, 120–125 CrossRef CAS.
- M. Abdullah, G. K. C. Low and R. W. Matthews, J. Phys. Chem., 1990, 94, 6820–6825 CrossRef CAS.
- V. Subramanian, V. G. Pangarkar and A. A. C. M. Beenackers, Clean Products and Processes, 2000, 2, 149–156 CrossRef.
- S. Bendjabeur, R. Zouaghi, O. N. Kaabeche and T. Sehili, Int. J. Chem. React. Eng., 2017, 15, 4 Search PubMed.
- J. Farner Budarz, A. Turolla, A. F. Piasecki, J.-Y. Bottero, M. Antonelli and M. R. Wiesner, Langmuir, 2017, 33, 2770–2779 CrossRef PubMed.
- P. K. Dutta, A. K. Ray, V. K. Sharma and F. J. Millero, J. Colloid Interface Sci., 2004, 278, 270–275 CrossRef CAS PubMed.
- C. Wang, R. Pagel, D. W. Bahnemann and J. K. Dohrmann, J. Phys. Chem. B, 2004, 108, 14082–14092 CrossRef CAS.
- C.-Y. Wang, R. Pagel, J. K. Dohrmann and D. W. Bahnemann, C. R. Chim., 2006, 9, 761–773 CrossRef CAS.
- H. Zhang, R. L. Penn, R. J. Hamers and J. F. Banfield, J. Phys. Chem. B, 1999, 103, 4656–4662 CrossRef CAS.
- J. M. Pettibone, D. M. Cwiertny, M. Scherer and V. H. Grassian, Langmuir, 2008, 24, 6659–6667 CrossRef CAS PubMed.
- H. M. Lu, Z. Wen and Q. Jiang, Chem. Phys., 2005, 309, 303–307 CrossRef CAS.
Footnote |
| † Electronic supplementary information (ESI) available. See DOI: 10.1039/c7cy01903c |
| This journal is © The Royal Society of Chemistry 2018 |

