
 Open Access Article
 This Open Access Article is licensed under a Creative Commons Attribution-Non Commercial 3.0 Unported Licence
Automated calculation of thermal rate coefficients using ring polymer molecular dynamics and machine-learning interatomic potentials with active learning
I. S.
Novikov
a,
Y. V.
Suleimanov
 *bc and
A. V.
Shapeev
*a
*bc and
A. V.
Shapeev
*a
aSkolkovo Institute of Science and Technology, Skolkovo Innovation Center, Nobel St. 3, Moscow 143026, Russia. E-mail: a.shapeev@skoltech.ru
bComputation-based Science and Technology Research Center, Cyprus Institute, 20 Kavafi Street, Nicosia 2121, Cyprus
cDepartment of Chemical Engineering, Massachusetts Institute of Technology, Cambridge, Massachusetts 02139, USA. E-mail: ysuleyma@mit.edu
First published on 9th November 2018
Abstract
We propose a methodology for the fully automated calculation of thermal rate coefficients of gas phase chemical reactions, which is based on combining ring polymer molecular dynamics (RPMD) and machine-learning interatomic potentials actively learning on-the-fly. Based on the original computational procedure implemented in the RPMDrate code, our methodology gradually and automatically constructs the potential energy surfaces (PESs) from scratch with the data set points being selected and accumulated during the RPMDrate simulation. Such an approach ensures that our final machine-learning model provides a reliable description of the PES that avoids artifacts during exploration of the phase space by RPMD trajectories. We tested our methodology on two representative thermally activated chemical reactions studied recently by RPMDrate at temperatures within the interval of 300–1000 K. The corresponding PESs were generated by fitting to only a few thousand automatically generated structures (less than 5000) while the RPMD rate coefficients showed deviation from the reference values within the typical convergence error of RPMDrate. In future, we plan to apply our methodology to chemical reactions that proceed via complex-formation thus providing a completely general tool for calculating RPMD thermal rate coefficients for any polyatomic gas phase chemical reaction.
1 Introduction
Accurate and efficient computation of thermal chemical reaction rate coefficients represents one of the most challenging problems for modern theoretical physical chemistry. Rigorous quantum dynamics calculations scale exponentially with the dimensionality of the system and are therefore limited to chemical reactions involving just a few atoms.1 The classical description of chemical reactivity allows practical simulations of polyatomic systems, but the problem is complicated at low temperatures, at which quantum-mechanical effects of nuclear motions such as zero-point energy, tunneling, and resonance effects become critically important (though the contribution of the latter effects to thermal rate coefficients is less studied).2 Recently, it has been demonstrated that ring polymer molecular dynamics (RPMD)3,4 provides a systematically accurate approach for calculating thermal rate coefficients in multifarious scenarios.5 This semiclassical method scales “classically” with the number of atoms and is based on the isomorphism between the quantum statistical mechanics of the physical system and the classical statistical mechanics of a fictitious ring polymer consisting of nbeads copies (beads) of the original system connected by harmonic springs.6 RPMD is exact in the high-temperature limit as it converges to classical molecular dynamics. It has also been shown that RPMD rate-theory gives a lower bound to RPMD transition state theory, which describes an instantaneous quantum flux from reactants to products7 and describes fluctuations around the instanton geometry (in the deep-tunnelling regime),8 thus explaining why RPMD provides reliable estimates of the quantum rate coefficient at low temperatures. A general computational procedure for calculating RPMD rate coefficients for polyatomic chemical reactions was developed9 and implemented in the RPMDrate code.10 Its application to various gas phase chemical reactions proved that the method is very accurate for estimating thermal rate coefficients even in the most challenging benchmark cases.9,11–15Despite the instantaneous success of RPMDrate code,16 the current version is restricted to a limited number of chemical reactions for which the underlying potential energy surfaces (PESs) are available in an analytical form. For the code to become a generally useful tool, efficient ways to couple RPMD with electronic structure evaluations are required. In principle, a PES can be calculated “on-the-fly”, but even with the most advanced supercomputers, it is extremely CPU-intensive and is generally limited to fairly short propagation times. This challenge has been partially solved by approximating a limited number of quantum-mechanical calculations (typically tens of thousands), constructing a PES using the permutation invariant polynomial-neural network (PIP-NN) method.17–19 However, during preliminary RPMDrate simulations for several polyatomic systems, convergence issues were detected due to artifacts in the PIP-NN PESs resulting from a lack of points in data sets in certain areas (see, e.g., the supporting information file of ref. 20). As compared to classical trajectories that are normally used for verification of the PESs, RPMD trajectories provide more enhanced sampling of the phase space by using ring polymer beads, which can enter the potential artifact zones.
During the past few years, the application of machine learning to constructing PESs has gained a lot of attention.21–48 The methods are based on neural networks,21–33,45,46,48 Gaussian processes,34–38 and other methods.39,40 Also, closely related are energy-free (i.e., non-conservative) machine-learning force fields.41–43 Among these is the moment tensor potential (MTP).39,49 We use the MTP as an interatomic interaction model in this work.
The goal of this work is to propose an algorithm for automatically constructing an approximation to the reference PES for any given molecular system for the subsequent calculation of RPMD thermal rate coefficients. The main challenge in automatically constructing such an approximation is to automatically assemble the training set that can be used to fit a good potential. A natural idea would be to use RPMDrate itself to sample the needed configurations for training, but the original version of RPMDrate requires a fitted potential to run. This seems to be a vicious circle: we need a training set in order to fit a potential, while we need a potential in order to sample a relevant training set. We resolve this challenge by applying the active learning (AL) approach, proposed in ref. 50 for linearly parametrized potentials and extended to nonlinearly parametrized models in ref. 49 and 51. The idea of the approach is to let RPMDrate sample the needed configurations, and for each configuration, decide on-the-fly whether a potential can yield reliable energies and forces or if it needs to be trained on this configuration. The underlying algorithm for choosing configurations for training is based on a D-optimality criterion for selecting the configurations in the training set (after computing its energy and forces using an ab initio potential). The core of this criterion is the so-called maxvol algorithm, proposed in ref. 52. We refer to the combined approach as AL-MTP (active-learning moment tensor potential).
In this paper, we propose and test a combination of AL-MTP and RPMDrate for predicting chemical reaction thermal rate coefficients. For the present study, we have selected two exemplifying systems, namely, OH + H2 → H + H2O and CH4 + CN → CH3 + HCN, recently studied using RPMDrate.53,54 The RPMD rate coefficients and the corresponding analytical PESs54,55 for these chemical reactions were readily available to us at the time we started this project. As our main purpose is to demonstrate the feasibility of our new approach, we consider these PESs as ab initio models and compare the rate coefficients predicted by these models to the ones calculated using the MTPs. We emphasize that although the practical purpose would be to fit machine-learning PESs to accurate quantum-mechanical models and hence calculate accurate reaction rates, the purpose of this work is to test the accuracy of our approach and hence we fit our PESs to the existing accurate and efficient PESs for which we can compute the reaction rates used as a reference for our models.
2 Methodology
2.1 Machine-learning interatomic potential
 . Each contribution is further expanded as a linear combination of basis functions Bα,
 | (1) |
 | (2) |
 | (3) |
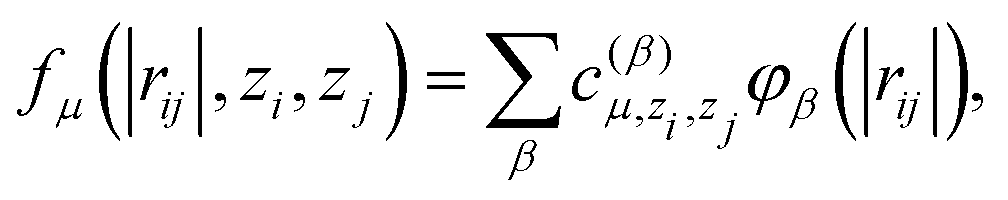
 is another set of parameters to be fitted and φβ are the radial basic functions (expressed through the Chebyshev polynomials and ensuring a smooth cut-off to 0 for r > Rcut). One can think of the functions fμ as the ones that define the shells of neighboring atoms, while the coefficients
  express the relative weights of atomic species zj in the μ-th shell of the i-th atom.
We then construct our basis functions Bα as different contractions of the moment tensor descriptors (2) to a scalar, such as
| B0(ri) = M0,0(ri), |
| B1(ri) = M0,0(ri)M1,0(ri), |
| B2(ri) = M0,2(ri):M1,2(ri),… |
 and hence we denote the MTP energy of a configuration x by E = E(θ;x).
 | (4) |

In order to find the active set, we use the so-called maxvol algorithm proposed in ref. 52. For a configuration x*, we then define its extrapolation grade γ(x*) as the maximum, by the absolute value, a factor by which the above determinant can increase if we try to replace each x(i) by x*. We emphasize that γ(x*) does not depend on the ab initio data, it depends only on the geometric information of the configuration x*. Thus, it is not necessary to carry out ab initio calculations to calculate the extrapolation grade.
In order to formulate our active learning algorithm, we introduce two thresholds: γth and Γth, 1 < γth < Γth. These thresholds define the bounds of permissible extrapolation. Thus, our AL algorithm can be systemized as follows:
• For each configuration x* occurring in the RPMDrate simulation, we calculate γ(x*). If γ(x*) < γth, then x* will not be added to the training set. Otherwise, there are two possibilities:
(a) γth ≤ γ(x*) < Γth. In this case, we think of γ(x*) as sufficiently high for x* to be added to the training set, but not too high to terminate the RPMDrate simulation. Hence, in this case, we mark (save to a file) the configuration x* and proceed with the RPMDrate simulation.
(b) γ(x*) ≥ Γth. In this case, the extrapolation grade is too high, therefore we add x* to the training set and terminate the RPMDrate simulation. We then update the active set with the marked configurations, calculate their ab initio energies and forces, add them to the training set, refit the potential, and repeat the entire RPMDrate simulation from the beginning.
As a result, our algorithm will restart RPMDrate several times until the training set covers the needed region in the phase space. We emphasize that the potential is fixed at each RPMDrate run, thus ensuring that the code samples a proper canonical ensemble at each run.
Through the algorithm described above, our potential is trained in a fully automatic manner, removing the need for tedious manual analysis of the quality of the PES being constructed. The scheme of our AL-MTP algorithm is shown in Fig. 1.
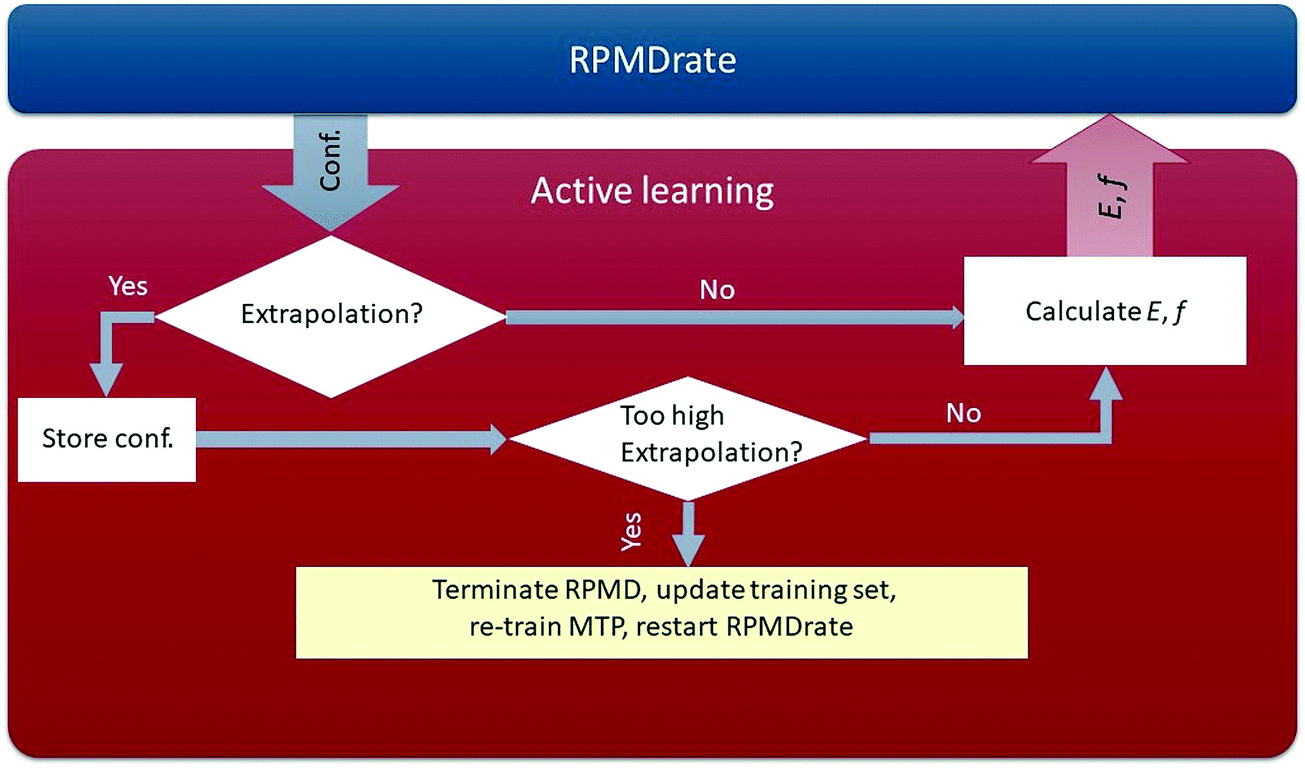 | ||
| Fig. 1 Active learning scheme. The RPMDrate code generates a configuration for which we calculate an extrapolation grade. If the grade is low, we calculate the energy and forces for this configuration and continue the RPMDrate simulation. Otherwise, if the grade is high, but not too high to terminate the RPMDrate run, we mark (save to a file) the configuration and proceed with the RPMDrate run. Finally, if the extrapolation grade is too high, we terminate RPMDrate, update the training set, re-train the potential and restart the entire RPMDrate calculation. | ||
2.2 Application to OH + H2 → H + H2O and CH4 + CN → CH3 + HCN
We apply our AL algorithm in combination with MTPs to the calculation of RPMD rate coefficients for the following two representative chemical reactions: OH + H2 → H + H2O and CH4 + CN → CH3 + HCN. Below, we show that the AL-MTP algorithm is capable of the accurate prediction of chemical reaction rate coefficients for various temperatures and different numbers of ring polymer beads for both systems.We study the first reaction, OH + H2 → H + H2O, at T = 300 K and T = 1000 K with nbeads = 1 at both temperatures, nbeads = 128 at the low temperature and nbeads = 16 at the high temperature. We run the second reaction, CH4 + CN → CH3 + HCN, at T = 300 K and T = 600 K with the same number of ring polymer beads at the low and the high temperatures as for the first reaction.
The remaining input parameters for the RPMDrate simulations are similar to those used in numerous studies of thermally activated chemical reactions.5 In order to obtain the PMF profiles for both chemical reactions, we divide the interval −0.05 ≤ ξ ≤ 1.05 into 111 windows of width 0.01. The umbrella force constant was set to ki = 2.72 ((T/K) eV) for each window centered at ξi, i = 1,…,111. In every window, we run 80 constrained RPMD trajectories with the sampling period of 50 ps and the equilibration period of 15 ps. Finally, the propagation time step was set to equal 0.0001 ps.
For the calculation of κ, we choose slightly different parameters depending on the chemical reaction. For the OH + H2 system, all the calculations (except the computation with nbeads = 128) are carried out along 20![[thin space (1/6-em)]](https://www.rsc.org/images/entities/char_2009.gif) 000 unconstrained child trajectories (Ntotalchild) with the equilibration time of 10 ps (tequilibration) and 100 child trajectories per one initially constrained configuration (Nchild). All the unconstrained child trajectories run for tchild = 0.05 ps with the time step dt = 0.00005 ps. For the case of nbeads = 128, we increase the number of unconstrained child trajectories up to 25000 and the time step is set to 0.0001 ps. For the CH4 + CN system, we take the following parameters: Ntotalchild = 50000, tequilibration = 5 ps, Nchild = 100, tchild = 0.06 ps, and dt = 0.0001 ps.
000 unconstrained child trajectories (Ntotalchild) with the equilibration time of 10 ps (tequilibration) and 100 child trajectories per one initially constrained configuration (Nchild). All the unconstrained child trajectories run for tchild = 0.05 ps with the time step dt = 0.00005 ps. For the case of nbeads = 128, we increase the number of unconstrained child trajectories up to 25000 and the time step is set to 0.0001 ps. For the CH4 + CN system, we take the following parameters: Ntotalchild = 50000, tequilibration = 5 ps, Nchild = 100, tchild = 0.06 ps, and dt = 0.0001 ps.
As mentioned above, we consider the potentials described in ref. 54 and 55 as ab initio models for the present exemplifying study. The potential for the OH + H2 → H + H2O reaction was developed using Neural Network (NN) fitting55 and is denoted as NN1 PES. Another potential, applied for the CH4 + CN system, is a combination of various semi-empirical potentials54 including 34 parameters that were obtained after fitting this potential on the data set, describing the stationary points, the reaction path and the reaction swath. For simplicity, we shall call this potential CH4 + CN PES though we note that its original abbreviation is different (PES2017). We also note that the previous RPMD studies using these PESs demonstrated very good agreement with the experimental measurements of rate coefficients.53,54
We fit the MTP with 92 basis functions Bα, 4 radial functions fμ and 12 radial basis functions φβ. This results in approximately 300 and 500 MTP parameters for OH + H2 and CH4 + CN, respectively. We choose Rcut = 4 and 6 Å, respectively, for these systems. The active learning was performed with γth = 2 and Γth = 10, thus the interval of high but permissible grades is [2,10).
As described above, we need to compute kQTST (the first step of RPMDrate) and κ (the second step of RPMDrate). In order to obtain kQTST, we focus only on the region connecting the reactants with the transition state (i.e., ξ ∈ (−0.05, 1.05)). During the second step – computation of κ – the RPMD trajectories visit the products region, i.e., ξ > 1.05. The geometries of the configurations in the reactant and product regions are different and, thus, we use a slightly different MTP for the calculation of kQTST and κ trained on two data sets. More precisely, during the first RPMDrate step, we form the reactant set (kQTST set) that consists of configurations selected from the reactant region and learn on-the-fly the first MTP. During the second RPMDrate step, we start from the MTP and the training set derived after the first step, update the training set with the additional configurations (the product set, or, κ set) and learn on-the-fly the second MTP. Thus, the two MTPs differ by their training sets—the first training set is a subset of the second one. Having computed kQTST and κ, respectively, by these two MTPs, we obtain the final RPMD rate coefficient.
3 Results and discussion
The PMF profiles W(ξ) for the OH + H2 and CH4 + CN reactions are plotted in Fig. 2 and 3, respectively. For both reactions and two representative temperatures, the results obtained using MTPs are close to the ab initio profiles; the difference is less than 0.3 kcal mol−1. Time-dependent κ values obtained by the MTP and ab initio models for the OH + H2 and CH4 + CN reactions are shown in Fig. 4 and 5, respectively. Similar to the PMF profiles, the results obtained using MTP are in very good agreement with the ab initio counterparts. The values of the centroid density TST rate coefficient kQTST, the ring polymer recrossing factor κ and the RPMD rate coefficient kRPMD are also summarized for the OH + H2 and CH4 + CN reactions in Tables 1 and 2, respectively. The agreement with the previous RPMD rate coefficients is very good; the relative root-mean-square deviation between MTP and the reference rate coefficients is about 20% or less and is comparable to the typical convergence error of the RPMDrate computational procedure.7,10 | ||
| Fig. 2 Comparison of potential of mean force profiles for the OH + H2 → H + H2O reaction calculated by the moment tensor potential (MTP) PES and NN1 (reference PES) at various temperatures and numbers of beads. | ||
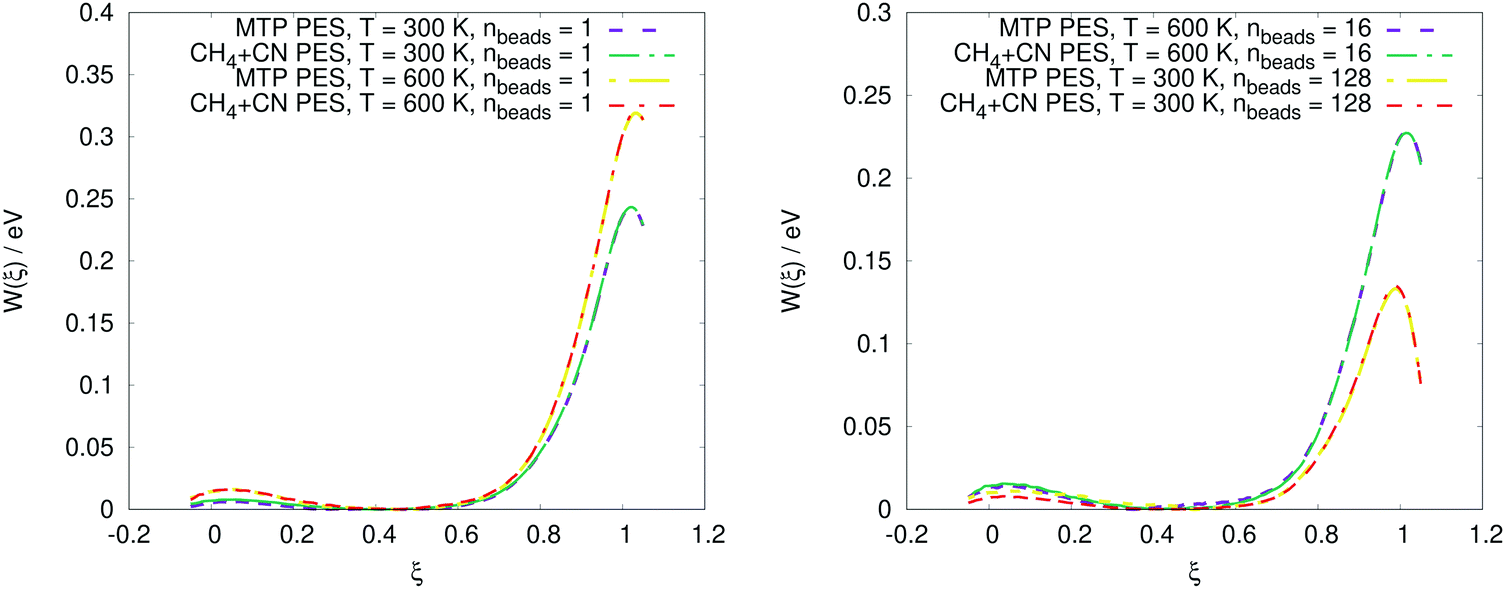 | ||
| Fig. 3 Comparison of potential of mean force profiles for the CH4 + CN → CH3 + HCN reaction calculated by the moment tensor potential (MTP) PES and CH4 + CN (reference PES) at various temperatures and numbers of beads. | ||
 | ||
| Fig. 4 Comparison of the time-dependent ring polymer transmission coefficients for the OH + H2 → H + H2O reaction calculated by the moment tensor potential (MTP) PES and NN1 (reference PES) at various temperatures and numbers of beads. | ||
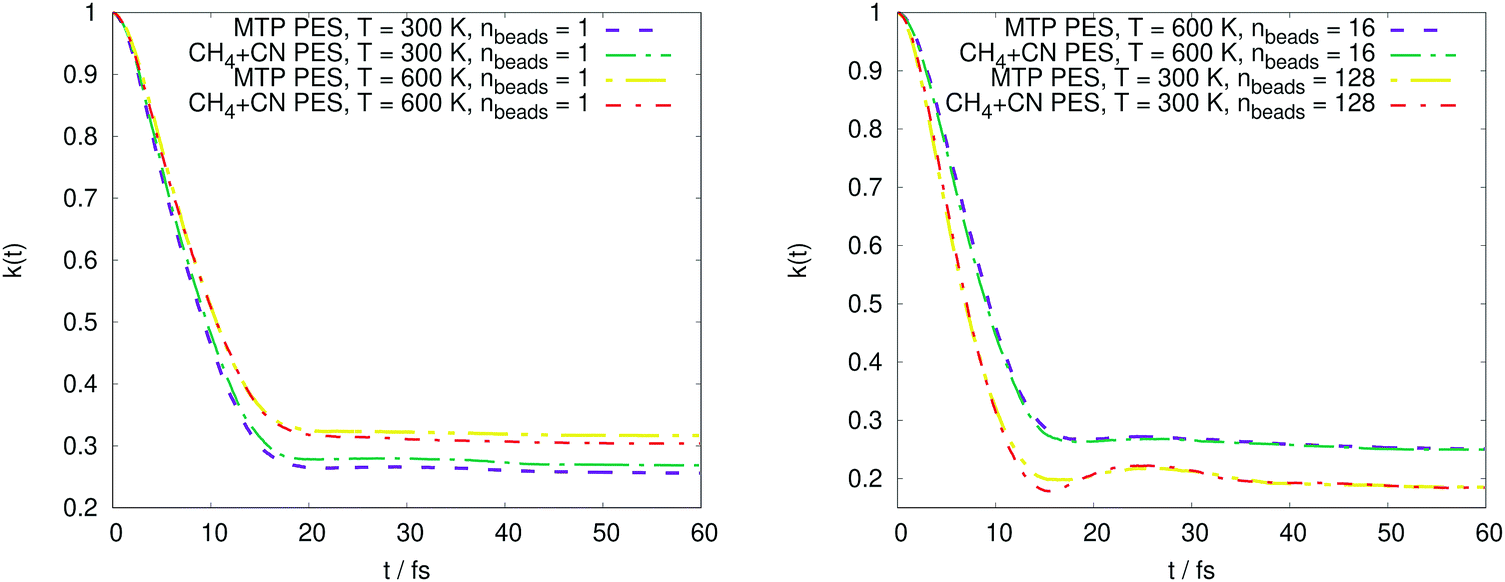 | ||
| Fig. 5 Comparison of the time-dependent transmission coefficients for the CH4 + CN → CH3 + HCN reaction obtained by moment tensor potential (MTP) and CH4 + CN (reference PES) at various temperatures and numbers of beads. | ||
| T = 300 K | T = 300 K | T = 1000 K | T = 1000 K | |
|---|---|---|---|---|
| n beads = 1 | n beads = 128 | n beads = 1 | n beads = 16 | |
| k AIQTST (cm3 s−1) | 5.74 × 10⁻¹⁶ | 2.37 × 10⁻¹⁴ | 2.78 × 10⁻¹² | 3.72 × 10⁻¹² |
| k MTPQTST (cm3 s−1) | 5.37 × 10⁻¹⁶ | 1.84 × 10⁻¹⁴ | 2.91 × 10⁻¹² | 3.97 × 10⁻¹² |
| Error (%) | 6.5 | 22.3 | 4.7 | 6.7 |
| κ AI | 0.613 | 0.528 | 0.666 | 0.599 |
| κ MTP | 0.626 | 0.527 | 0.649 | 0.589 |
| Error (%) | 2.1 | 0.2 | 2.6 | 1.7 |
| k AIRPMD (cm3 s−1) | 3.52 × 10⁻¹⁶ | 1.25 × 10⁻¹⁴ | 1.85 × 10⁻¹² | 2.23 × 10⁻¹² |
| k MTPRPMD (cm3 s−1) | 3.36 × 10⁻¹⁶ | 9.70 × 10⁻¹⁵ | 1.89 × 10⁻¹² | 2.34 × 10⁻¹² |
| Error (%) | 4.5 | 22.4 | 2.2 | 4.9 |
| T = 300 K | T = 300 K | T = 600 K | T = 600 K | |
|---|---|---|---|---|
| n beads = 1 | n beads = 128 | n beads = 1 | n beads = 16 | |
| k AIQTST (cm3 s−1) | 1.69 × 10⁻¹³ | 1.13 × 10⁻¹¹ | 6.10 × 10⁻¹² | 3.63 × 10⁻¹¹ |
| k MTPQTST (cm3 s−1) | 1.61 × 10⁻¹³ | 1.35 × 10⁻¹¹ | 6.17 × 10⁻¹² | 3.48 × 10⁻¹¹ |
| Error (%) | 4.7 | 19.5 | 1.1 | 4.1 |
| κ AI | 0.267 | 0.184 | 0.304 | 0.250 |
| κ MTP | 0.256 | 0.185 | 0.317 | 0.251 |
| Error (%) | 4.1 | 0.5 | 4.3 | 0.4 |
| k AIRPMD (cm3 s−1) | 4.51 × 10⁻¹⁴ | 2.08 × 10⁻¹² | 1.85 × 10⁻¹² | 9.07 × 10⁻¹² |
| k MTPRPMD (cm3 s−1) | 4.12 × 10⁻¹⁴ | 2.50 × 10⁻¹² | 1.95 × 10⁻¹² | 8.73 × 10⁻¹² |
| Error (%) | 8.6 | 20.2 | 5.4 | 3.7 |
The number of configurations selected in the reactant region (kQTST set size), the product region (κ set size) and the total training set (kRPMD set size) is reported in Table 3. As can be seen, we select many more configurations from the reactant region than we add from the product region (see Fig. 6). The reason for this is as follows. During the first RPMDrate step, we need to approximate the PMF difference between the reactants and the transition state as accurately as possible due to its exponential contribution to kQTST. Thus, we need to predict the PMF profile across each umbrella window, especially near the transition state. This fact is illustrated in Fig. 7. Indeed, most of the configurations for both systems were selected for ξ ∈ (0.95, 1.05), i.e., near the transition state. Then, it happens that for the purposes of calculating RPMD rate coefficients, a potential that is well-trained in the reactant region needs much less data to be fitted in the product region (only a few bonds significantly differ, while most of the bonds in the molecular systems are the same in both regions).
| OH + H2 → H + H2O | CH4 + CN → CH3 + HCN | ||||||
|---|---|---|---|---|---|---|---|
| T, nbeads | k QTST set size | κ set size | k RPMD set size | T, nbeads | k QTST set size | κ set size | k RPMD set size |
| 300 K, 1 | 1401 | 96 | 1497 | 300 K, 1 | 3348 | 581 | 3929 |
| 300 K, 128 | 1816 | 44 | 1860 | 300 K, 128 | 4138 | 380 | 4518 |
| 1000 K, 1 | 1784 | 123 | 1907 | 600 K, 1 | 3904 | 544 | 4448 |
| 1000 K, 16 | 2014 | 83 | 2097 | 600 K, 16 | 4572 | 320 | 4892 |
 | ||
| Fig. 6 The reactant and product set sizes for the OH + H2 and CH4 + CN systems. For both reactions under various conditions, the largest number of configurations, N, was selected in the reactant region. | ||
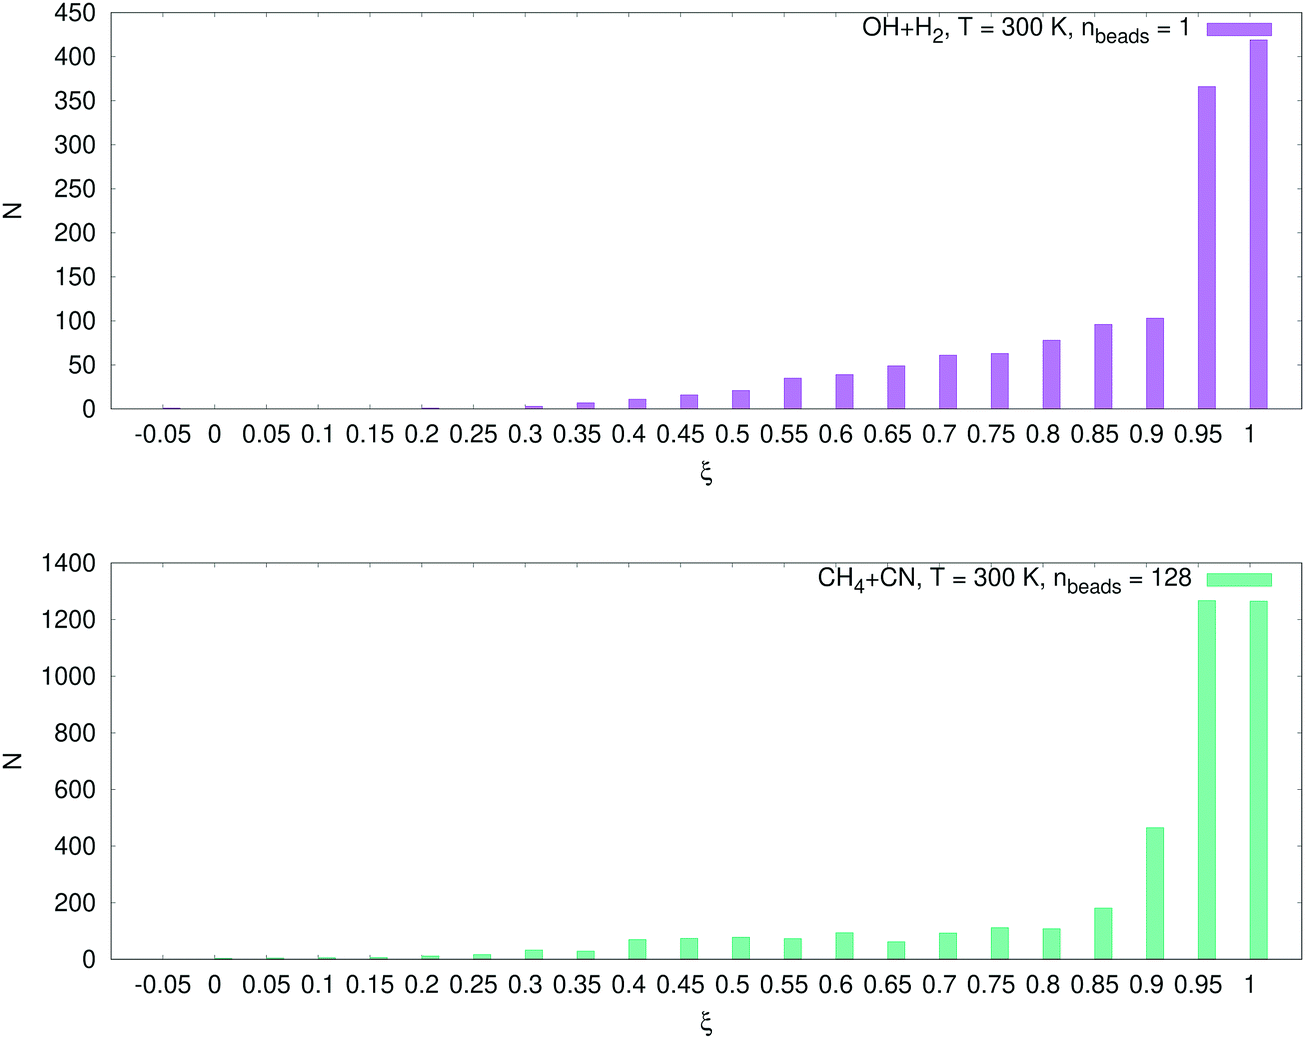 | ||
| Fig. 7 Dependence of the number of configurations on the reaction coordinates for the OH + H2 and CH4 + CN systems. The numbers are given for the intervals (−0.05, 0), (0, 0.05), …, (1, 1.05). The transition state is located near the point ξ = 1, the largest number of configurations N was selected around this point. | ||
The size of a total training set significantly depends on the number of different atomic types in the molecule. Note that the number of parameters 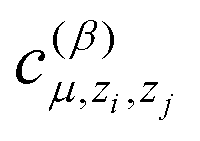 grows as the square of the number of atomic types (as they depend on pairs of types of interacting atoms, (zi,zj)). Thus, there are 2.25 times more coefficients in the potential for the CH4 + CN system than for the OH + H2 one. As can be seen from Table 3, we need approximately 2.25 times more configurations in the training sets for the CH4 + CN system than for the OH + H2 one. This confirms that the number of coefficients grows quadratically with the number of atomic types and thus the proposed algorithms should be applicable for large molecular systems, the direct description of which is problematic due to high dimensionality.
We additionally test how the accuracy improves when the number of MTP parameters increases. This test was done for the CH4 + CN system, T = 300 K, nbeads = 1. In Fig. 8, the PMF profile and the transmission coefficient are plotted for three potentials, with 150, 250, and 500 parameters, respectively. As can be seen, the training set size increases with the number of parameters, and so does the accuracy.
 | ||
| Fig. 8 The dependence of the accuracy of the potential of mean force and transmission coefficient on the number of parameters in moment tensor potentials (150, 250, and 500) and on the dataset size. The potentials are labeled MTP-150, MTP-250, and MTP-500, respectively. The data are for the CH4 + CN system, T = 300 K, and nbeads = 1. The number of data points improves the accuracy of the calculated coefficients. | ||
The remaining two factors that affect the size of our training set are the number of ring polymer beads and the temperature. Increasing the number of ring polymer beads leads to more enhanced phase space exploration thus more configurations are necessary in the training set. The same is valid for the temperature factor: as the temperature increases, the energy dispersion increases and therefore we need more configurations in the dataset in order to describe all possible energy levels. We attribute both correlations to the fact that a higher temperature and higher number of beads imply that we need to sample a larger region in the phase space and therefore collect more configurations for training. In any case, the maximal training set size is less than 5000, thus, we needed to carry out less than 5000 ab initio calculations in order to obtain an MTP for both exemplifying chemical systems considered in the present study.
4 Conclusions
In summary, we propose a fully automated procedure for calculating ring polymer molecular dynamics (RPMD) rate coefficients using the potential energy surface (PES) generated on-the-fly by the moment tensor potentials (MTPs) with active learning (AL). The procedure follows the original Bennett–Chandler factorization implemented in the RPMDrate code, which splits the calculation into two steps—a static (centroid density quantum transition state theory (QTST) rate coefficient) factor and a dynamic (ring polymer transmission coefficient) factor. During each step, the active-learning algorithm automatically accumulates the dataset sample, ensuring that the fit of the PES is appropriate for calculating the RPMD rate coefficient for a given temperature and number of ring polymer beads. In order to determine whether the current point should be added to the training set or not, we calculate the energy gradient with respect to the parameters of the potential and the so-called extrapolation grade. If the extrapolation grade is greater than the lower bound of permissible extrapolation, we mark the current point (save to a file). If the extrapolation grade is greater than the upper bound of permissible extrapolation, we terminate RPMDrate, update the training set using the maxvol algorithm and refit the potential. Such an approach ensures that the final machine-learning PES model avoids artifacts during exploration of the phase space by RPMD trajectories, which have been observed for several PESs fitted by neural networks.20 The methodology is tested on two representative thermally activated chemical reactions, namely, OH + H2 and CH4 + CN, which were previously studied by RPMD.53,54 The deviation of the present RPMD rate coefficients obtained using the AL-MTP approach from the reference values is within the convergence error of the RPMDrate computational procedure.In future, we plan to extend our methodology to chemical reactions that proceed via complex formation in order to propose a completely general tool for calculating RPMD rate coefficients for any polyatomic chemical reaction. In principle, the Bennett–Chandler factorization can also be implemented in this case5 though the contribution from the real-time propagation of the dynamic factor significantly increases leading to possible alterations to the AL-MTP algorithm. This work is currently ongoing. Finally, we would like to note that our AL-MTP approach could be used in calculations of other dynamical properties (such as RPMD diffusion coefficients); the applicability of the algorithm does not depend on a predicted physical quantity.
Conflicts of interest
There are no conflicts to declare.Acknowledgements
The work of I. S. N. and A. V. S. was supported by the Russian Science Foundation (grant number 18-13-00479). Y. V. S. thanks the European Regional Development Fund and the Republic of Cyprus for support through the Research Promotion Foundation (Project Cy-Tera NEA YPODOMH/STPATH/0308/31). We thank Jesus Castillo for providing analytical gradients for the NN1 PES. We also thank our colleagues, Konstantin Gubaev and Evgeny Podryabinkin, for giving advance access to the code implementing AL-MTP. This work was performed, in part, by A. V. S. at the Center for Integrated Nanotechnologies, an Office of Science User Facility operated for the U.S. Department of Energy (DOE) Office of Science by Los Alamos National Laboratory (Contract DE-AC52-06NA25396) and Sandia National Laboratories (Contract DE-NA-0003525).References
- B. Fu, X. Shan, D. H. Zhang and D. C. Clary, Chem. Soc. Rev., 2017, 46, 7625–7649 RSC.
- H. Guo, Int. Rev. Phys. Chem., 2012, 31, 1–68 Search PubMed.
- I. R. Craig and D. E. Manolopoulos, J. Chem. Phys., 2004, 121, 3368–3373 CrossRef CAS PubMed.
- S. Habershon, D. E. Manolopoulos, T. E. Markland and T. F. Miller III, Annu. Rev. Phys. Chem., 2013, 64, 387–413 CrossRef CAS PubMed.
- Y. V. Suleimanov, F. J. Aoiz and H. Guo, J. Phys. Chem. A, 2016, 120, 8488–8502 CrossRef CAS PubMed.
- D. Chandler and P. G. Wolynes, J. Chem. Phys., 1981, 74, 4078–4095 CrossRef CAS.
- T. J. Hele and S. C. Althorpe, J. Chem. Phys., 2013, 139, 084115 CrossRef PubMed.
- J. O. Richardson and S. C. Althorpe, J. Chem. Phys., 2009, 131, 214106 CrossRef PubMed.
- Y. V. Suleimanov, R. Collepardo-Guevara and D. E. Manolopoulos, J. Chem. Phys., 2011, 134, 044131 CrossRef PubMed.
- Y. Suleimanov, J. Allen and W. Green, Comput. Phys. Commun., 2013, 184, 833–840 CrossRef CAS.
- R. Pérez de Tudela, F. J. Aoiz, Y. V. Suleimanov and D. E. Manolopoulos, J. Phys. Chem. Lett., 2012, 3, 493–497 CrossRef PubMed.
- Y. Li, Y. V. Suleimanov, M. Yang, W. H. Green and H. Guo, J. Phys. Chem. Lett., 2012, 4, 48–52 CrossRef PubMed.
- R. Pérez de Tudela, Y. V. Suleimanov, J. O. Richardson, V. Sáez Rábanos, W. H. Green and F. J. Aoiz, J. Phys. Chem. Lett., 2014, 5, 4219–4224 CrossRef PubMed.
- K. M. Hickson, J.-C. Loison, H. Guo and Y. V. Suleimanov, J. Phys. Chem. Lett., 2015, 6, 4194–4199 CrossRef CAS PubMed.
- Y. V. Suleimanov, A. Aguado, S. Gómez-Carrasco and O. Roncero, J. Phys. Chem. Lett., 2018, 9, 2133–2137 CrossRef CAS PubMed.
- http://rpmdrate.cyi.ac.cy/publications/index.html .
- J. Zuo, Y. Li, H. Guo and D. Xie, J. Phys. Chem. A, 2016, 120, 3433–3440 CrossRef CAS PubMed.
- M. Bai, D. Lu, Y. Li and J. Li, Phys. Chem. Chem. Phys., 2016, 18, 32031–32041 RSC.
- J. Zuo, C. Xie, H. Guo and D. Xie, J. Phys. Chem. Lett., 2017, 8, 3392–3397 CrossRef CAS PubMed.
- S. S. Kumar, F. Grussie, Y. V. Suleimanov, H. Guo and H. Kreckel, Sci. Adv., 2018, 4 Search PubMed.
- J. Behler and M. Parrinello, Phys. Rev. Lett., 2007, 98, 146401 CrossRef PubMed.
- N. Artrith and A. M. Kolpak, Comput. Mater. Sci., 2015, 110, 20–28 CrossRef CAS.
- J. Behler, Phys. Chem. Chem. Phys., 2011, 13, 17930–17955 RSC.
- J. Behler, J. Phys.: Condens. Matter, 2014, 26, 183001 CrossRef CAS PubMed.
- J. R. Boes, M. C. Groenenboom, J. A. Keith and J. R. Kitchin, Int. J. Quantum Chem., 2016, 116, 979–987 CrossRef CAS.
- P. E. Dolgirev, I. A. Kruglov and A. R. Oganov, AIP Adv., 2016, 6, 085318 CrossRef.
- M. Gastegger and P. Marquetand, J. Chem. Theory Comput., 2015, 11, 2187–2198 CrossRef CAS PubMed.
- S. Manzhos, R. Dawes and T. Carrington, Int. J. Quantum Chem., 2015, 115, 1012–1020 CrossRef CAS.
- S. K. Natarajan, T. Morawietz and J. Behler, Phys. Chem. Chem. Phys., 2015, 17, 8356–8371 RSC.
- N. Lubbers, J. S. Smith and K. Barros, J. Chem. Phys., 2018, 148, 241715 CrossRef PubMed.
- J. S. Smith, O. Isayev and A. E. Roitberg, Chem. Sci., 2017, 8, 3192–3203 RSC.
- B. Kolb, L. C. Lentz and A. M. Kolpak, Sci. Rep., 2017, 7 Search PubMed.
- K. Schütt, P.-J. Kindermans, H. E. S. Felix, S. Chmiela, A. Tkatchenko and K.-R. Müller, Advances in Neural Information Processing Systems, 2017, pp. 992–1002 Search PubMed.
- A. P. Bartók, M. C. Payne, R. Kondor and G. Csányi, Phys. Rev. Lett., 2010, 104, 136403 CrossRef PubMed.
- W. J. Szlachta, A. P. Bartók and G. Csányi, Phys. Rev. B: Condens. Matter Mater. Phys., 2014, 90, 104108 CrossRef.
- V. L. Deringer and G. Csányi, Phys. Rev. B, 2017, 95, 094203 CrossRef.
- V. L. Deringer, C. J. Pickard and G. Csányi, Phys. Rev. Lett., 2018, 120, 156001 CrossRef PubMed.
- A. Grisafi, D. M. Wilkins, G. Csányi and M. Ceriotti, Phys. Rev. Lett., 2018, 120, 036002 CrossRef PubMed.
- A. Shapeev, Multiscale Model. Simul., 2016, 14, 1153–1173 CrossRef.
- A. Thompson, L. Swiler, C. Trott, S. Foiles and G. Tucker, J. Comput. Phys., 2015, 285, 316–330 CrossRef CAS.
- V. Botu and R. Ramprasad, Phys. Rev. B: Condens. Matter Mater. Phys., 2015, 92, 094306 CrossRef.
- Z. Li, J. R. Kermode and A. De Vita, Phys. Rev. Lett., 2015, 114, 096405 CrossRef PubMed.
- I. Kruglov, O. Sergeev, A. Yanilkin and A. R. Oganov, Sci. Rep., 2017, 7, 8512 CrossRef PubMed.
- S. Chmiela, H. E. Sauceda, K.-R. Müller and A. Tkatchenko, arXiv preprint arXiv:1802.09238, 2018.
- L. Zhang, J. Han, H. Wang, R. Car and E. Weinan, Phys. Rev. Lett., 2018, 120, 143001 CrossRef PubMed.
- K. Ryczko, K. Mills, I. Luchak, C. Homenick and I. Tamblyn, Comput. Mater. Sci., 2018, 149, 134–142 CrossRef CAS.
- K. Kanamori, K. Toyoura, J. Honda, K. Hattori, A. Seko, M. Karasuyama, K. Shitara, M. Shiga, A. Kuwabara and I. Takeuchi, Phys. Rev. B, 2018, 97, 125124 CrossRef.
- K. Yao, J. E. Herr, D. W. Toth, R. Mckintyre and J. Parkhill, Chem. Sci., 2018, 9, 2261–2269 RSC.
- K. Gubaev, E. V. Podryabinkin, G. L. Hart and A. V. Shapeev, Comput. Mater. Sci., 2019, 156, 148–156 CrossRef CAS.
- E. V. Podryabinkin and A. V. Shapeev, Comput. Mater. Sci., 2017, 140, 171–180 CrossRef CAS.
- K. Gubaev, E. V. Podryabinkin and A. V. Shapeev, J. Chem. Phys., 2018, 148, 241727 CrossRef PubMed.
- S. Goreinov, I. Oseledets, D. Savostyanov, E. Tyrtyshnikov and N. Zamarashkin, Matrix Methods: Theory, Algorithms And Applications: Dedicated to the Memory of Gene Golub, World Scientific, 2010, pp. 247–256 Search PubMed.
- J. Castillo and Y. Suleimanov, Phys. Chem. Chem. Phys., 2017, 19, 29170–29176 RSC.
- J. Espinosa-Garcia, C. Rangel and Y. V. Suleimanov, Phys. Chem. Chem. Phys., 2017, 19, 19341–19351 RSC.
- J. Chen, X. Xu, X. Xu and D. H. Zhang, J. Chem. Phys., 2013, 138, 154301 CrossRef PubMed.
- D. Chandler, J. Chem. Phys., 1978, 68, 2959–2970 CrossRef CAS.
- C. H. Bennett, Molecular Dynamics and Transition State Theory: The Simulation of Infrequent Events, 1977, ch. 4, pp. 63–97 Search PubMed.
- J. Kästner and W. Thiel, J. Chem. Phys., 2005, 123, 144104 CrossRef PubMed.
- J. Kästner and W. Thiel, J. Chem. Phys., 2006, 124, 234106 CrossRef PubMed.
| This journal is © the Owner Societies 2018 |