
 Open Access Article
 This Open Access Article is licensed under a Creative Commons Attribution-Non Commercial 3.0 Unported Licence
Atomistic modelling of entropy driven phase transitions between different crystal modifications in polymers: the case of poly(3-alkylthiophenes)†
Mosè
Casalegno
 a,
Tommaso
Nicolini‡
a,
Antonino
Famulari
a,
Guido
Raos
a,
Riccardo
Po
b and
Stefano V.
Meille
*a
a,
Tommaso
Nicolini‡
a,
Antonino
Famulari
a,
Guido
Raos
a,
Riccardo
Po
b and
Stefano V.
Meille
*a
aDipartimento di Chimica, Materiali e Ingegneria Chimica “G. Natta”, Politecnico di Milano, via Mancinelli 7, I-20131 Milano (MI), Italy. E-mail: valdo.meille@polimi.it
bResearch Center for Renewable Energies and Environment, Istituto Guido Donegani, Eni S. p. A, Via Fauser 4, I-28100 Novara (NO), Italy
First published on 20th November 2018
Abstract
Polymorphism and related solid-state phase transitions affect the structure and morphology and hence the properties of materials, but they are not-so-well understood. Atomistic computational methods can provide molecular-level insights, but they have rarely proven successful for transitions between polymorphic forms of crystalline polymers. In this work, we report atomistic molecular dynamics (MD) simulations of poly(3-alkylthiophenes) (P3ATs), widely used organic semiconductors to explore the experimentally observed, entropy-driven transition from form II to more common form I type polymorphs, or, more precisely, to form I mesophases. The transition is followed continuously, also considering X-ray diffraction evidence, for poly(3-hexylthiophene) (P3HT) and poly(3-butylthiophene) (P3BT), evidencing three main steps: (i) loss of side chain interdigitation, (ii) partial disruption of the original stacking order and (iii) reorganization of polymer chains into new, tighter, main-chain stacks and new layers with characteristic form I periodicities, substantially larger than those in the original form II. The described approach, likely applicable to other important transitions in polymers, provides previously inaccessible insight into the structural organization and disorder features of form I structures of P3ATs, not only in their development from form II structures but also from melts or solutions.
Understanding and controlling the structural organization of molecular and polymeric solids represent key steps toward their successful exploitation. The crystalline modifications that a given compound may develop often exhibit significantly different physical, chemical, and mechanical properties. These may be desirable or not, depending on the target application. Polymorph control is hence often crucial in fields ranging from pharmaceutics to materials science.1–6
Polymorph interconversion may represent a viable approach to structural control, but it is often poorly understood because the mechanisms through which such transformations occur are difficult to pinpoint. X-ray diffraction and other experimental techniques allow characterizing the initial and final structures, but they are normally unable to capture the stages of transitions at the molecular level. Conversely, computational methods can be effective in this respect, despite the introduction of some necessary approximations. Molecular Dynamics (MD) has often been adopted in modeling studies, due to its ability to account for both the enthalpic and entropic contributions to the stability of crystal forms. Accelerated MD schemes like metadynamics and steered MD have been applied to explore polymorphism in both inorganic and organic systems, such as silica,7 benzene,8 urea,9 5-fluorouracil10 and DL-norleucine,11 while unbiased MD simulations have been performed to model temperature-mediated polymorphic transitions in ternaphthalene12 and other bulk crystals.13
MD simulations14–16 of polymers are nowadays ubiquitous and investigations on conformational and packing disorder within crystal structures,17–19 on transitions in amorphous polymers,20 on polyethylene and polypropylene crystallization,21–24etc. were reported by different groups. However, we are not aware of any clearly stated, successful attempt to model transitions between crystal phases in polymers by atomistic MD. This is due to (i) the presumably exceedingly long simulation times, especially in view of the low probability that a nucleation event may occur to kick-start a transition; (ii) the difficulty in identifying appropriate values of simulation parameters, such as temperature, pressure, etc., triggering the process; and (iii) the not always clear connection between what occurs in silico and in vitro, due to the uncertainties and approximations introduced when setting up the models. These limitations imply that not all phase transitions can be accessible to MD studies. Nevertheless, we report here a successful study demonstrating the rewards and the difficulties of MD approaches to solid-state phase transitions in polymers. The case study we consider is the form II → form I phase transition observed in poly(3-alkylthiophenes) (P3ATs). Our choice of P3ATs is motivated by the importance of these polymers as p-type, hole-transporting organic semiconductors,25–27 with applications to organic solar cells (OSCs),28 perovskite–polymer hybrid solar cells,29,30 thin film transistors (OFETs),31etc.. Over the years they have also been a central subject of our research activity.32–38 The motion of charge carriers in these systems, both along and between different chains, is highly sensitive to molecular packing and local ordering.39–42 In fact it is generally assumed that crystalline domains, with a favourable main chain orientation and stacking, maximizing π–π overlap between adjacent chains, more effectively contribute to charge transport than disordered, amorphous regions. Form II, in the case of P3ATs, has been proposed to crystallize in thin films with chains perpendicular to the substrate,43 whereas form I crystallizes with an edge on or a flat on chain orientation,33,44 implying clearly different charge transport properties in the two polymorphs.43,45 Other morphological features43,44 also differ significantly and this could similarly influence the light-harvesting28 and mechanical properties27 of the two P3AT polymorphs. Indeed features neglected in the present study, like molecular weight, its dispersity, the distribution of chain ends, of tie chains and folds, of crystallite sizes and orientations, may influence the phase transition and the properties of the two phases.
The essential features of the P3AT form I and form II polymorph families are shown in Fig. 1.45,46 Recent evidence indicates that they should be applicable also to polyselenophenes.47 Both polymorphs are characterized by a so-called lamellar structure, in which stacks of parallel polymer main chains alternate with regions in which alkyl side chains segregate, with “lamellar” periodicities often assumed to coincide with the respective d100 periodicities of the two polymorphs. In devices and under normal processing conditions, P3ATs typically adopt form I type layered structures with non-interdigitated side chains. There is broad agreement in the literature34,46,48,49 on additional basic features of form I family structures, namely tight main-chain stacking with a ca. 3.8 Å interchain distance, and a prevailing trans main chain conformation with a 7.8 Å translational periodicity. Atomistically resolved, limit ordered, structural models have been proposed34,49–51 (by some authors identified as form I′) for selected P3HT and P3BT samples crystallized under specific conditions. However, form I structures for a given P3AT, e.g. P3HT, may display widely different features44 depending on regioregularity, molecular mass, thermal treatments, and temperature, with substantial but variable degrees of disorder that, especially at temperatures above 400 K, imply that some form I structures are in essence conformationally disordered mesophases with 2D long range order.34,44,52 For these reasons, we prefer to consider form I as a family of structures rather than a single polymorph.
 | ||
| Fig. 1 Sketches of the form I and form II structural families of P3ATs. The “lamellar” interlayer spacing is indicated as d100 for the form I polymorph, characterized by non-interdigitated side chains: for a given P3AT (e.g. P3HT) the lamellar spacing of form II is about 20% smaller than that of form I. | ||
Form II polymorphs, characterized by ordered and interdigitated side chains, are only obtained under special conditions, or with relatively low molar mass samples. Surprisingly, a number of different studies indicate that, for various P3ATs, form II is the thermodynamically stable polymorph at room temperature.32,33,45,52,53 In the case of P3BT32 the form II crystal structure has been determined by us, while a closely related model was found to apply to P3HT.54 Form II samples of P3ATs melt33,45,52,53 at temperatures substantially below those of form I. Above certain degrees of polymerization,52 form II rapidly reorganizes upon melting into form I structures, metastable down to room temperature. The details of the transition are difficult to establish experimentally, although an interesting mechanism has been proposed for P3BT.55
The unit cells of both P3BT and P3HT form II are shown in Fig. 2. The P3BT form II structure is characterized by a P21/c monoclinic space group with lattice parameters a = 10.76 Å, b = 7.77 Å, c = 9.44 Å, and β = 64.66°.32 A similar unit cell was adapted from ref. 54 for P3HT. The lattice parameters were optimized using the Tinker program,56 minimizing the potential energy associated with the force-field developed by our group.35,36 The final cell parameters for P3HT were a = 12.9 Å, b = 7.80 Å, c = 9.44 Å, and β = 68.40°.
 | ||
| Fig. 2 Views of the crystal structures of P3BT and P3HT form II used in this work. Hydrogen atoms are omitted for clarity. | ||
For each polymer, a supercell was constructed, consisting of 5 × 5 × 5 unit cells along the a, b, and c axes. Periodic boundary conditions were applied along all directions to simulate an infinite periodic crystal. Along the b axis, the polymer chains (fifty overall) consisting of 10 monomers each were linked to their periodic images across the simulation box. Hence polymer molecular weight is assumed essentially infinite, neglecting the effects of molecular weight, its dispersity, and finite crystallite size. Full atomistic simulations based on our force-field35,36 were performed with the package GROMACS 5.0.4.57 The supercells were initially equilibrated for 20 ns at constant temperature (300 K) and pressure (1 bar), thus within the NPT ensemble. The comparison of the calculated lattice parameters with the experimental data32,54,59 further confirmed the force-field reliability (see the ESI† for details).
Starting from the equilibrated room-temperature form II structures, NPT simulations were then performed at higher temperatures in order to explore the possibility of phase transitions. Taking into account that the available experimental data are related to small crystals,32,52,53,58,59 while the simulation setup involves infinite crystals and the preservation of chain alignment, the initial temperature for both systems was set at 500 K – about 100 K higher than the experimental form II melting (see the ESI†). Independent 20 ns runs were then performed at increasing temperature, in 10 K steps. The phase transitions were observed starting at 560 K for P3BT and at 530 K for P3HT. Essentially the same phase transitions also occurred above these temperatures, up to about 600 K.
Fig. 3 illustrates selected snapshots of P3HT. A movie showing the full process is available in the ESI.† Starting from the original form II structure (frame A), side chain interdigitation is gradually lost due to sidechain disordering and lattice expansion along the “lamellar” a axis, leading to a fully non-interdigitated structure (frame B) in which stacks are largely preserved. After about 13 ns, this structure evolves into a metastable, disordered arrangement, through a process characterized by molecular reorientation and displacement, both along the b-axis and in the a–c plane (frame C), with the disruption of the original stacking order. Reorganization of the polymer chains produces tighter new stacks, which hardly appear to evolve further after 40 ns (frame D).
 | ||
| Fig. 3 Snapshots viewed along the main-chain axis illustrating the P3HT form II–form I phase transition at 530 K. Frames were taken at 0 (A), 15 (B), 16 (C), and 40 ns (D). All the chains in a specific stack in the original structure share the same color. | ||
A similar “card shuffling” mechanism was observed for P3BT, as evidenced in Fig. 4. Also in this case, the transition involves the disruption of the original highly ordered structure, followed by the formation of new stacks of non-interdigitated, reoriented, disordered polymer chains.
 | ||
| Fig. 4 Snapshots viewed along the main-chain axis illustrating the P3BT form II–form I phase transition at 560 K. Frames were taken at 0 (A), 10 (B), 13 (C), and 40 ns (D). All the chains in a specific stack in the original structure share the same color. | ||
For both P3BT and P3HT, the simulations render visually apparent that the transition is promoted by the entropy increase on going from form II to form I. At the transition temperature, the latter is a conformationally disordered mesophase in which local order is largely lost and only some degree of long-range order is preserved. During the simulations, the main chain displacements occur simultaneously, suggesting a cooperative mechanism. Under the simulated conditions, even if, at variance with what occurs in real samples, no form I domains or any heterogeneous, nucleation centres are present in the starting systems, the recrystallization process is very rapid and takes only a few nanoseconds.
We already remarked that the integrity of the original stacks is largely preserved up to snapshot C for both P3HT and P3BT in Fig. 3 and 4, respectively, but in the new, layered structures shown in D, the original stacks are fragmented into blocks of a few chains. These blocks assemble into relatively ordered, tighter stacks with a form I type lamellar periodicity. However, a non-negligible percentage (about 10%) of the chains are unable to organize appropriately, at least within the explored simulation set-up and times, and substantially defective domains result. While it is not obvious to identify a 2-chain (or even a 4-chain) unit cell, the orientation of layers and stacks differs from the one in the original form II, whereas the preservation of the main-chain orientation is inherent in the model.
The final structures show typical features of mesophases with some two-dimensional (2D) long-range order, but are locally highly disordered. They are characterized by extensive side-chain and main-chain conformational disorder with a distribution of important deviations of the S–C–C–S dihedral angles from the trans-planar conformation (see Fig. 5).
 | ||
| Fig. 5 The S–C–C–S dihedral angle (left panel, θ = 0° for the trans conformation) in P3HT. The central panel shows that the distribution is monomodal (mode at θ = 0°) in form II at 300 K, but becomes bimodal (modes at ± 40°) after the phase transition at 530 K (right panel). | ||
Fig. 6 highlights the change in the calculated powder diffraction patterns during the phase transition. The change in the diffraction patterns initially involves the loss of the spectral features at higher angles (2θ > 12°), while the position of the most intense reflection associated with the layer periodicity remains substantially unaltered at the early stages of the transition, suddenly shifting to lower angles as the new stacks develop. The change occurs more gradually for P3BT than for P3HT. As the form I type mesophases ripen over time, diffraction patterns remain poorly resolved, consistently with locally disordered structures and with experimental form I diffraction patterns, where usually the peak associated with the (100) reflection is dominant. The position of this diffraction maximum in the final calculated diffraction patterns corresponds to a d-spacing of about 13.2 Å for P3BT and 16.8 Å for P3HT, involving a ca. 20% increase with respect to the initial form II lamellar spacings. This agrees with the expected values for a form I family structure at the transition temperature.
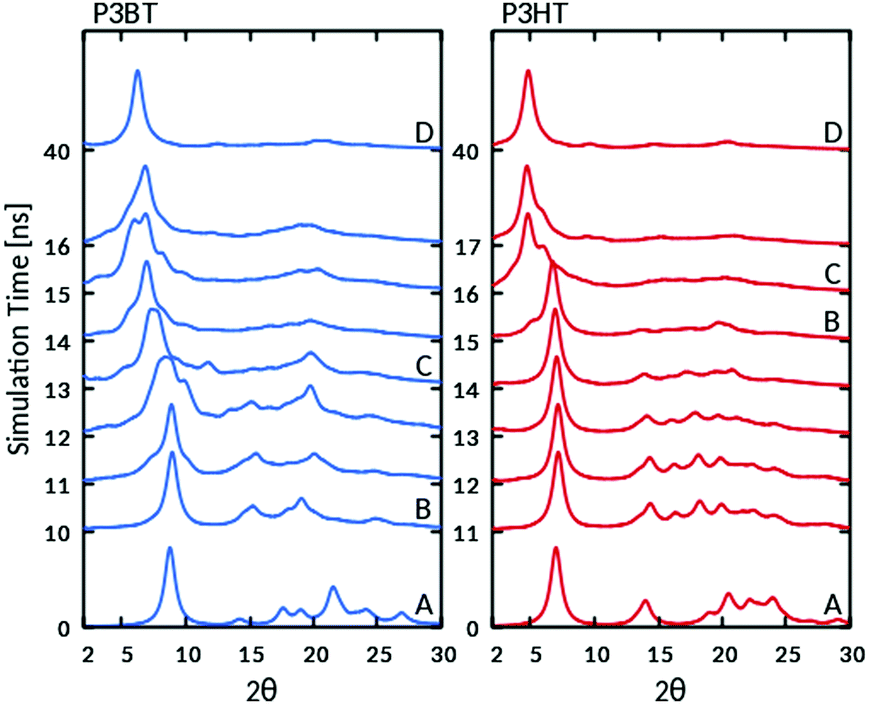 | ||
| Fig. 6 X-ray powder diffraction spectra (λ = 1.5418 Å) for P3BT (left) and P3HT (right), calculated from the MD trajectories during the phase transitions at 560 and 530 K, respectively. Capital letters refer to the snapshots in Fig. 3 (P3HT) and 4 (P3BT) from which patterns were calculated. | ||
In order to further evaluate the correspondence between form I models obtained by simulation starting from form II and experimental form I structures, we also compared their diffraction patterns. To this end, the simulated form I structures were cooled to the temperature at which the experimental patterns were recorded, and equilibrated for 20 ns. Fig. 7 compares calculated (Sim. II/I) with experimental (Exp.) profiles, averaged in order to remove preferred orientation effects (see the ESI† for details). The P3BT spectra are shown at 450 K, where only the more disordered form I is expected to be stable,34 while those for P3HT are at ambient temperature (300 K), where both disordered and more ordered form I family structures may coexist. The most intense diffraction maxima corresponding to the form I layer “periodicity” (along with its successive orders) and the overall appearance of the patterns are in good agreement, but some differences are noticeable at higher angles. These may result because the experimental patterns were not obtained from samples originally crystallized in form II, or because in the simulation the crystallization time was not long enough, or due to hardly avoidable force-field imperfections, or to a combination of effects. Such questions, along with a comparison of the form I type structures developing from form II with available models of P3HT form I38 and P3BT form I′,25 will be extensively discussed in future works.
 | ||
| Fig. 7 Comparison between calculated (Sim. II/I*, bottom) and experimental (Exp., top) X-ray powder diffraction spectra (λ = 1.5418 Å) at 450 K for P3BT (left) and 300 K for P3HT (right). (*) Simulated form I structures cooled to 450 K (P3BT) and 300 K (P3HT), and equilibrated for 20 ns. | ||
Conclusions
Our simulations provide important new insight into the structural organization of the ubiquitous form I of P3ATs, as it develops during crystallization from form II. It is apparent that once “packing disorder islands” arise (see the bottom right corner of Fig. 3 frame D for P3HT, or various peripheral areas of Fig. 4 frame D for P3BT), it is surprisingly hard to anneal them out or to recrystallize them. Thus, although a majority of chains rapidly organizes into stacks and layers with characteristic form I periodicities, groups of chains (ca. 10%) can remain as “oriented amorphous” islands irrespective of how they initially developed, limiting de facto the crystallinity of form I from within, both along the stacking and along the layer directions. Something similar might occur at the interphase with amorphous domains, and the simulations suggest what such interfaces may look like. The simulated behaviour appears to be consistent with widely reported experimental results,44,60 indicating that neither the crystallinity nor the size of P3AT form I domains grows quite as much as would be expected in the annealing processes, but they are limited by local disorder.To our knowledge, this is the first time that an inter-polymorph transition has been detailed at an atomistic level in polymers. Summarizing key features that made this feasible by standard MD simulations, without resorting to biased approaches such as metadynamics we note that the two polymorphs share similar lamellar structures and chain periodicity. Hence only a moderate structural rearrangement is required by the recrystallization process. However, even in our relatively constrained model of infinitely periodic chains, the new form I stacks assemble from blocks of chains originating not from a single stack but from different form II stacks. The main driving force for the transition is the increase in entropy on going from form II to form I (see the ESI†), which is at the transition temperature a 2D mesophase. The cooperative nature of the process suggests that it may occur also in the absence of a nucleation centre, allowing us to detect the transition even in using moderately small simulation supercells, with a size comparable to that of the crystalline domains in real samples.
It is likely that approaches similar to the one described here could be applicable to a variety of polymers, characterized by entropy driven solid–solid phase transitions. Various candidates can be found in the expanding family of polymers with alkyl side chains and conjugated main-chains, used for optoelectronic applications.25,26 Other possibilities involve, as already attempted,17 polymers displaying both ordered crystalline phases and premelting transitions, or else ordered crystalline phases and thermotropic mesophases.61–63 Likely but rarely met requirements for the success of such investigations are reliable crystallographic models of the ordered crystalline phase and effectively validated force-fields for the polymers.
Conflicts of interest
There are no conflicts to declare.Acknowledgements
The authors gratefully acknowledge financial support (PRIN 2015 grant 2015XJA9NT_003) by the Italian Ministry of University and Research (MIUR). Extensive access to CINECA computational resources is also gratefully acknowledged.References
- A. J. Cruz-Cabeza and J. Bernstein, Chem. Rev., 2014, 114, 2170–2191 CrossRef CAS PubMed.
- R. D. Brown, S. A. Corcelli and S. A. Kandel, Acc. Chem. Res., 2018, 51, 465–474 CrossRef CAS PubMed.
- C. Park, J. E. Park and H. C. Choi, Acc. Chem. Res., 2014, 47, 2353–2364 CrossRef CAS PubMed.
- L. Yu, Acc. Chem. Res., 2010, 43, 1257–1266 CrossRef CAS PubMed.
- S. L. Price, Acc. Chem. Res., 2009, 42, 117–126 CrossRef CAS PubMed.
- G. E. Purdum, N. G. Telesz, K. Jarolimek, S. M. Ryno, T. Gessner, N. C. Davy, A. J. Petty, Y. Zhen, Y. Shu, A. Facchetti, G. E. Collis, W. Hu, C. Wu, J. E. Anthony, R. T. Weitz, C. Risko and Y.-L. Loo, J. Am. Chem. Soc., 2018, 140, 7519–7525 CrossRef CAS PubMed.
- R. Martoňák, D. Donadio, A. R. Oganov and M. Parrinello, Nat. Mater., 2006, 5, 623–626 CrossRef PubMed.
- P. Raiteri, R. Martoňák and M. Parrinello, Angew. Chem., Int. Ed., 2005, 44, 3769–3773 CrossRef CAS PubMed.
- M. Salvalaglio, C. Perego, F. Giberti, M. Mazzotti and M. Parrinello, PNAS, 2015, 112, E6–E14 CrossRef CAS PubMed.
- P. G. Karamertzanis, P. Raiteri, M. Parrinello, M. Leslie and S. L. Price, J. Phys. Chem. B, 2008, 112, 4298–4308 CrossRef CAS PubMed.
- J. A. van den Ende, B. Ensingb and H. M. Cuppen, CrystEngComm, 2016, 18, 4420–4430 RSC.
- M. Casalegno, M. Moret, R. Resel and G. Raos, Cryst. Growth Des., 2016, 16, 412–422 CrossRef CAS PubMed.
- E. C. Dybeck, N. S. Abraham, N. P. Schieber and M. R. Shirts, Cryst. Growth Des., 2017, 17, 1775–1787 CrossRef CAS.
- M. Karplus, Acc. Chem. Res., 2002, 35, 321–323 CrossRef CAS PubMed.
- N. I. Ercan, P. Stroeve, J. W. Tringe and R. Faller, Langmuir, 2018, 34, 4314–4323 CrossRef PubMed.
- K. N. Houk and F. Liu, Acc. Chem. Res., 2017, 50, 539–543 CrossRef CAS PubMed.
- J. J. Wendoloski, K. H. Gardner, J. Hirschinger, H. Miura and A. D. English, Science, 1990, 247, 431–436 CrossRef CAS PubMed.
- M. Sprik, U. Röthlisberger and M. L. Klein, J. Phys. Chem. B, 1997, 101, 2745–2749 CrossRef CAS.
- O. Alexiadis and V. G. Mavrantzas, Macromolecules, 2013, 46, 2450–2467 CrossRef CAS.
- J.-L. Barrat, J. Baschnagelb and A. Lyulin, Soft Matter, 2010, 6, 3430–3446 RSC.
- P. Yi, C. R. Locker and G. C. Rutledge, Macromolecules, 2013, 46, 4723–4733 CrossRef CAS.
- T. Yamamoto, Polymer, 2013, 54, 3086–3097 CrossRef CAS.
- N. A. Romanos and D. N. Theodorou, Macromolecules, 2010, 43, 5455–5469 CrossRef CAS.
- J. Ramos, J. F. Vega and J. Martínez-Salazar, Macromolecules, 2015, 48, 5016–5027 CrossRef CAS.
- O. Ostroverkhova, Chem. Rev., 2016, 116, 13279–13412 CrossRef CAS PubMed.
- L. Lu, T. Zheng, Q. Wu, A. M. Schneider, D. Zhao and L. Yu, Chem. Rev., 2015, 115, 12666–12731 CrossRef CAS PubMed.
- S. E. Root, S. Savagatrup, A. D. Printz, D. Rodriquez and D. J. Lipomi, Chem. Rev., 2017, 117, 6467–6499 CrossRef CAS PubMed.
- G. J. Hedley, A. Ruseckas and I. D. W. Samuel, Chem. Rev., 2017, 117, 796–837 CrossRef CAS PubMed.
- A. Abrusci, S. D. Stranks, P. Docampo, H.-L. Yip, A. K.-Y. Jen and H. J. Snaith, Nano Lett., 2013, 13, 3124–3128 CrossRef CAS PubMed.
- F. Di Giacomo, S. Razza, F. Matteocci, A. D’Epifanio, S. Licoccia, T. M. Brown and A. Di Carlo, J. Power Sources, 2014, 251, 152–156 CrossRef CAS.
- C. Wang, H. Dong, W. Hu, Y. Liu and D. Zhu, Chem. Rev., 2012, 112, 2208–2267 CrossRef CAS PubMed.
- A. Buono, N. H. Son, G. Raos, L. Gila, A. Cominetti, M. Catellani and S. V. Meille, Macromolecules, 2010, 43, 6772–6781 CrossRef CAS.
- S. V. Meille, V. Romita, T. Caronna, A. J. Lovinger, M. Catellani and L. Belobrzeckaja, Macromolecules, 1997, 30, 7898–7905 CrossRef CAS.
- P. Arosio, M. Moreno, A. Famulari, G. Raos, M. Catellani and S. V. Meille, Chem. Mater., 2009, 21, 78–87 CrossRef CAS.
- M. Moreno, M. Casalegno, G. Raos, S. V. Meille and R. Po, J. Phys. Chem. B, 2010, 114, 1591–1602 CrossRef CAS PubMed.
- G. Raos, A. Famulari and V. Marcon, Chem. Phys. Lett., 2003, 379, 364–372 CrossRef CAS.
- A. Famulari, G. Raos, A. Baggioli, M. Casalegno, R. Po and S. V. Meille, J. Phys. Chem. B, 2012, 116, 14504–14509 CrossRef CAS PubMed.
- A. Baggioli, S. V. Meille, G. Raos, R. Po, M. Brinkmann and A. Famulari, Int. J. Quantum Chem., 2013, 113, 2154–2162 CrossRef CAS.
- D. L. Cheung, D. P. McMahon and A. Troisi, J. Phys. Chem. B, 2009, 113, 9393–9401 CrossRef CAS PubMed.
- B. O'Connor, R. J. Kline, B. R. Conrad, L. J. Richter, D. J. Gundlach, M. F. Toney and D. M. DeLongchamp, Adv. Funct. Mater., 2011, 21, 3697–3705 CrossRef.
- B. O'Connor, O. G. Reid, X. Zhang, R. J. Kline, L. J. Richter, D. J. Gundlach, D. M. DeLongchamp, M. F. Toney, N. Kopidakis and G. Rumbles, Adv. Funct. Mater., 2014, 24, 3422–3431 CrossRef.
- P. Pingel, A. Zen, R. D. Abellon, F. C. Grozema, L. D. A. Siebbeles and D. Neher, Adv. Funct. Mater., 2010, 20, 2286–2295 CrossRef CAS.
- G. Lu, L. Li and X. Yang, Adv. Mater., 2007, 19, 3594–3598 CrossRef CAS.
- F. P. V. Koch, J. Rivnay, S. Foster, C. Müller, J. M. Downing, J. M. Buchaca-Domingo, P. Westacott, L. Yu, M. Yuan, M. Baklar, Z. Fei, C. Luscombe, M. A. McLachlan, M. Heeney, G. Rumbles, C. Silva, A. Salleo, J. Nelson and N. Stingelin, Prog. Polym. Sci., 2013, 38, 1978–1989 CrossRef CAS.
- T. J. Prosa, M. J. Winokur and R. D. McCullough, Macromolecules, 1996, 29, 3654–3656 CrossRef CAS.
- T. J. Prosa, M. J. Winokur, J. Moulton, P. Smith and A. J. Heeger, Macromolecules, 1992, 25, 4364–4372 CrossRef CAS.
- Y. Wang, H. Cui, M. Zhu, F. Qiu, J. Peng and Z. Lin, Macromolecules, 2017, 50, 9674–9682 CrossRef CAS.
- K. Tashiro, M. Kobayashi, T. Kawai and K. Yoshino, Polymer, 1997, 12, 2861–2879 Search PubMed.
- N. Kayunkid, S. Uttiya and M. Brinkmann, Macromolecules, 2010, 43, 4961–4967 CrossRef CAS.
- D. Dudenko, A. Kiersnowski, J. Shu, W. Pisula, D. Sebastiani, H. W. Spiess and M. R. Hansen, Angew. Chem., 2012, 124, 11230–11234 CrossRef.
- Y. Yuan, J. Zhang, J. Sun, J. Hu, T. Zhang and Y. Duan, Macromolecules, 2011, 44, 9341–9350 CrossRef CAS.
- F. P. V. Koch, M. Heeney and P. Smith, J. Am. Chem. Soc., 2013, 135, 13699–13709 CrossRef CAS PubMed.
- G. Lu, L. Li and X. Yang, Macromolecules, 2008, 41, 2062–2070 CrossRef CAS.
- K. Rahimi, I. Botiz, N. Stingelin, N. Kayunkid, M. Sommer, F. P. V. Koch, H. Nguyen, O. Coulembier, P. Dubois, M. Brinkmann and G. Reiter, Angew. Chem., Int. Ed., 2012, 51, 11131–11135 CrossRef CAS PubMed.
- Y. Yuan, Y. Zhang, X. Cui and J. Zhang, Polymer, 2016, 105, 88–95 CrossRef CAS.
- J. W. Ponder, TINKER: Software Tools for Molecular Design, Washington University School of Medicine, Saint Louis, MO, 3.9 edn, 2001 Search PubMed.
- B. Hess, C. Kutzner, D. van der Spoel and E. J. Lindahl, J. Chem. Theory Comput., 2008, 4, 435–447 CrossRef CAS PubMed.
- J. Liu, M. Arif, J. Zou, S. I. Khondaker and L. Zhai, Macromolecules, 2009, 42, 9390–9393 CrossRef CAS.
- A. Zen, M. Saphiannikova, D. Neher, J. Grenzer, S. Grigorian, U. Pietsch, U. Asawapirom, S. Janietz, U. Scherf, I. Lieberwirth and G. Wegner, Macromolecules, 2006, 39, 2162–2171 CrossRef CAS.
- T. J. Prosa, A. J. Heeger, J. Moulton and M. J. Winokur, Macromolecules, 1999, 32, 4000–4009 CrossRef CAS.
- G. Ungar, Polymer, 1993, 34, 2050–2059 CrossRef CAS.
- C. De Rosa and F. Auriemma, Crystals and Crystallinity in Polymers: Diffraction Analysis of Ordered and Disordered Crystals, Wiley, Hoboken, New Jersey, 2013, p. 1 Search PubMed.
- P. Corradini, F. Auriemma and C. De Rosa, Acc. Chem. Res., 2006, 39, 314–323 CrossRef CAS PubMed.
Footnotes |
| † Electronic supplementary information (ESI) available: Details of experimental procedures and numerical results (PDF), and video illustrating P3HT form II–form I phase transition (AVI). See DOI: 10.1039/c8cp05820b |
| ‡ Present address: Laboratoire de Chimie des Polymères Organiques (LCPO), CNRS UMR 5629, Université de Bordeaux, Bordeaux INP, 16 Av. Pey-Berland, Pessac CEDEX, F-33607, France. |
| This journal is © the Owner Societies 2018 |