 Open Access Article
Ostwald's rule of stages and metastable transitions in the hydrogen–water system at high pressure†
M.-E.
Donnelly
a,
P.
Teeratchanan
a,
C. L.
Bull
 b,
A.
Hermann
a and
J. S.
Loveday
 *a
*a
aSUPA, School of Physics and Astronomy and Centre for Science at Extreme Conditions, The University of Edinburgh, Edinburgh, EH9 3JZ, UK. E-mail: j.loveday@ed.ac.uk
bISIS Neutron Facility, STFC Rutherford Appleton Lab, Chilton, Oxon, OX11 0QX, UK
First published on 10th October 2018
Abstract
Although the hydrogenous analogue of the D2–D2O system has been well explored in the regimes above 1 GPa, and below 0.2 GPa, there have been very few studies in the region between these pressures. The recent discovery in the range 0.5–0.7 GPa of a new phase, C0, that possesses a new clathrate structure with a new H2O network, along with the proposal of another structure stable at similar conditions, has prompted further studies of the hydrogen water system in this intermediate pressure region. Here, we report the results of neutron-diffraction experiments that observed transitions from metastable to stable structures in the D2–D2O system around 0.2–0.3 GPa between 130 K and 280 K. These metastable structures were observed in the stability region of the sII hydrogen hydrate clathrate and computational studies of their relative enthalpies suggest that transition sequence observed is in line with Ostwald's ‘Rule of Stages’.
1 Introduction
It is well known that water combines with many simple gases to form crystalline compounds known as gas hydrates. These ‘host–guest’ compounds have H2O molecules arranged in hydrogen-bonded cage or channel structures around the ‘guest’ gas molecules or atoms, and the host and guest interact through van der Waals forces. Gas hydrates are generally found to be stable at high pressures and/or low temperatures and their stability range is strongly dependent on the gas species. Gas hydrates are of interest because they provide access to hydrogen bond topologies not found in pure ice structures and may have applications as gas storage/separation materials.1–4 For such applications, a crucial parameter is the gas![[thin space (1/6-em)]](https://www.rsc.org/images/entities/char_2009.gif) :
:![[thin space (1/6-em)]](https://www.rsc.org/images/entities/char_2009.gif) water ratio which should be as high as possible. Pressure is a useful tool in the search for gas-richer phases because the proportion of gas in gas hydrate structures tends to increase with pressure.1,5
water ratio which should be as high as possible. Pressure is a useful tool in the search for gas-richer phases because the proportion of gas in gas hydrate structures tends to increase with pressure.1,5
The hydrogen–water system is a good example of such a system. There is a clear need for hydrogen storage materials, and pressure improves the hydration ratio.3,5–7 To date there have been four phases reported experimentally (Fig. 1). The lowest pressure phase, sII, adopts the type II cubic clathrate structure with an H2O![[thin space (1/6-em)]](https://www.rsc.org/images/entities/char_2009.gif) :
:![[thin space (1/6-em)]](https://www.rsc.org/images/entities/char_2009.gif) H2 ratio of almost 3
H2 ratio of almost 3![[thin space (1/6-em)]](https://www.rsc.org/images/entities/char_2009.gif) :
:![[thin space (1/6-em)]](https://www.rsc.org/images/entities/char_2009.gif) 1.8,9 As pressure is increased, at ∼0.5 GPa the so called C0 hydrate becomes the most stable phase with a H2O
1.8,9 As pressure is increased, at ∼0.5 GPa the so called C0 hydrate becomes the most stable phase with a H2O![[thin space (1/6-em)]](https://www.rsc.org/images/entities/char_2009.gif) :
:![[thin space (1/6-em)]](https://www.rsc.org/images/entities/char_2009.gif) H2 ratio of 2
H2 ratio of 2![[thin space (1/6-em)]](https://www.rsc.org/images/entities/char_2009.gif) :
:![[thin space (1/6-em)]](https://www.rsc.org/images/entities/char_2009.gif) 1 and the spiral cage-like structure, Sχ.10–14 This structure is surprisingly also found in the carbon dioxide:water system.14 At ∼1 GPa C1 hydrate becomes the most stable phase with a crystal structure based on ice II with H2 molecules occupying the hexagonal channels of this structure with an assumed H2O
1 and the spiral cage-like structure, Sχ.10–14 This structure is surprisingly also found in the carbon dioxide:water system.14 At ∼1 GPa C1 hydrate becomes the most stable phase with a crystal structure based on ice II with H2 molecules occupying the hexagonal channels of this structure with an assumed H2O![[thin space (1/6-em)]](https://www.rsc.org/images/entities/char_2009.gif) :
:![[thin space (1/6-em)]](https://www.rsc.org/images/entities/char_2009.gif) H2 ratio of 6
H2 ratio of 6![[thin space (1/6-em)]](https://www.rsc.org/images/entities/char_2009.gif) :
:![[thin space (1/6-em)]](https://www.rsc.org/images/entities/char_2009.gif) 1.5 Above 2 GPa, C2 hydrate is the most stable phase with a cubic crystal-structure based on ice Ic with a H2O
1.5 Above 2 GPa, C2 hydrate is the most stable phase with a cubic crystal-structure based on ice Ic with a H2O![[thin space (1/6-em)]](https://www.rsc.org/images/entities/char_2009.gif) :
:![[thin space (1/6-em)]](https://www.rsc.org/images/entities/char_2009.gif) H2 ratio of 1
H2 ratio of 1![[thin space (1/6-em)]](https://www.rsc.org/images/entities/char_2009.gif) :
:![[thin space (1/6-em)]](https://www.rsc.org/images/entities/char_2009.gif) 1.5 Thus the H2–H2O system shows a propensity to form hydrates whose structures are based on those of ice phases. However, there have been no experimentally reported filled ice Ih structures within this system. The filled ice Ih structure has been previously observed in the methane–, argon–, krypton– and nitrogen–water systems.1 Recently, a filled ice Ih type structure was proposed to be stable at the same the conditions as the C0 phase in the H2–H2O system by Qian et al. using an evolutionary structure search.15 Here we report results from a neutron-diffraction experiments on the D2–D2O system at low pressures – in the stability region of the sII hydrate.16 In these we observed the inclusion of deuterium into an ice Isd structure (a stacking disordered structure of ices Ih and Ic),17,18 and the appearance of the C0 structure outside its stability range.
1.5 Thus the H2–H2O system shows a propensity to form hydrates whose structures are based on those of ice phases. However, there have been no experimentally reported filled ice Ih structures within this system. The filled ice Ih structure has been previously observed in the methane–, argon–, krypton– and nitrogen–water systems.1 Recently, a filled ice Ih type structure was proposed to be stable at the same the conditions as the C0 phase in the H2–H2O system by Qian et al. using an evolutionary structure search.15 Here we report results from a neutron-diffraction experiments on the D2–D2O system at low pressures – in the stability region of the sII hydrate.16 In these we observed the inclusion of deuterium into an ice Isd structure (a stacking disordered structure of ices Ih and Ic),17,18 and the appearance of the C0 structure outside its stability range.
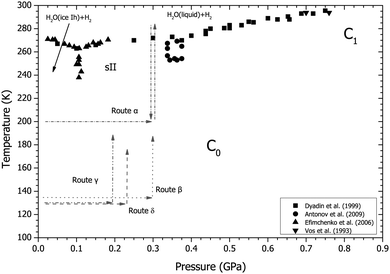 | ||
| Fig. 1 Phase diagram of the H2–H2O system showing previous experimental determinations of the phase boundaries shown as squares,19 circles,20 up triangles21 and down triangles.5 The four routes taken through P–T space (α, β, γ and δ) are marked on the diagram with dashed and/or dotted arrows. | ||
2 Experimental details
A hydrogen-compatible aluminium gas cell rated to 0.3 GPa was loaded with powdered deuterated ice at 77 K. The cell was sealed, compressed to ∼100 bar with deuterium gas, and transferred to an “Orange” (Institut Laue Langevin pattern) cryostat. The pressure was varied using a “capstan” pump. Several routes were taken to explore what effect changing pressure and temperature had on the formation of the structures observed and these are indicated in Fig. 1. All routes started at ∼100 bar in a D2 atmosphere at 200 K with the sample in the form of ice Ih. In route α the sample was compressed from these initial conditions to 0.3 GPa at 200 K. It was then warmed above the melt curve at 280 K before cooling to 200 K. In route β the sample was initially cooled to 135 K at ∼100 bar then compressed to 0.3 GPa with D2 and warmed to 180 K. Routes γ and δ follow the same initial route as β however, instead of compression to 0.3 GPa the sample was compressed to 0.2 and 0.23 GPa, respectively. Each sample compression took approximately 10 minutes. Data were collected with in situ neutron diffraction on the PEARL22 instrument at the ISIS neutron source at the Rutherford Appleton Laboratory before normalisation correction for attenuation by the gas cell using the Mantid suite.23 Analysis of the diffraction patterns was carried out by either Rietveld or Le Bail profile refinement using the GSAS crystallographic software suite.243 Computational details
Electronic structure calculations within the framework of density functional theory (DFT) were performed using the projector-augmented wave method in conjunction with a plane-wave basis set as implemented in the VASP code.25,26 A plane-wave cutoff of Ec = 800 eV and reciprocal-space sampling-density of 20 k-points per Å−1 were used. All structures were optimised until remaining forces were below 1 meV Å−1. Stability of hydrates was evaluated against pure ices (including XI, II, XIII, XIV, XV, and VIII) and hydrogen phase-I (modelled in a eight molecule P63/m unit cell). The non-local vdW-DF approach, which accounts for dispersion interactions, was used to approximate electron exchange–correlation effects, using the optB88 exchange functional.27–304 Results
4.1 Pressure and temperature route α
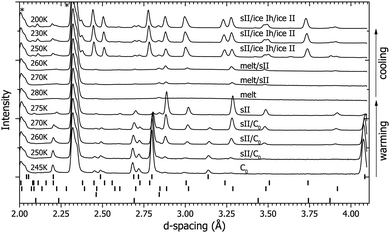
Immediately after compression to 0.3 GPa at 200 K (see Fig. 1 and 2), the ice Ih converted into the C0 structure (see ESI† for full structural information). The diffraction data collected at this point and in the subsequent warm-up/cool-down cycle are shown in Fig. 2. The sample was warmed slowly in steps of 5 K and at 260 K new peaks started to appear (Fig. 2). These peaks were identified as those of the sII phase of hydrogen hydrate. As temperature was increased further, the peaks from sII grew in intensity whilst the peaks arising from the C0 structure decreased. The conversion of the sample from the C0 structure to the sII structure was also accompanied by a large increase in the gas pressure, indicating an increase in overall sample volume on transformation to sII – i.e. that the C0 structure was either denser, and/or richer in D2 than sII. It was not possible to quantify the absolute change in pressure for safety reasons as the gas cell was already operating at the maximum safe pressure of 0.3 GPa and any evolved gas had to be immediately vented. The sample was heated further and at 280 K sII decomposed into gas and a liquid (it is assumed that this liquid contains dissolved deuterium). This discrepancy in the decomposition temperature (∼10 K above where the sII phase in the H2–H2O system decomposes) is attributed to a slight hysteresis effect and not an isotopic effect as the sample started to reform the sII structure between 280 K and 270 K upon cooling. Further cooling resulted in the sample forming a mixture of sII and pure ice II at 250 K (see diffraction patterns in Fig. 2). The lattice parameters for both the sII and pure ice II structures at these conditions (a = 17.107(2) Å and a = 7.7846(3) Å/α = 113.113(1)°, respectively) are in good agreement with those of the literature values.1,8,31 The sample was further cooled to 200 K and was left at the same conditions C0 had previously formed at (0.3 GPa and 200 K) before the warm up. However, after 10 hours there were no reflections from C0 observed in the diffraction pattern. The non-formation of the C0 structure at the same conditions as the previous observation suggest that the sII phase is the most stable configuration at this pressure and the previous formation of C0 at 0.3 GPa and 200 K is attributed to trapping of the metastable C0 structure. It is of course possible that non-formation of C0 on cooling at 0.3 GPa is caused by slow kinetics but we reject this possibility on the grounds that C0 was observed to form rapidly from ice Ih at a lower temperature upon the initial pressurisation (see above).4.2 Route β
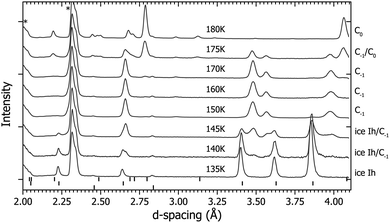
Route β (see Fig. 1 and 3) was followed to investigate the impact of temperature on the formation of C0. After the formation of ice Ih at 200 K the sample was cooled to 135 K at ∼100 bar then compressed to 0.3 GPa with D2. At this point the diffraction pattern is still described by ice Ih (see Fig. 3) despite the ice II (in pure ice) or sII (in H2–H2O) phases being the most stable under these conditions. The sample was heated and at 150 K it converted into a new structure, which we call C−1, and is either a filled ice Isd structure or filled ice Ih structure depending on the ‘starter’ ice (for more details see ESI†).17,18 The temperature was increased further, and at 180 K the sample converted into the C0 structure.4.3 Route γ
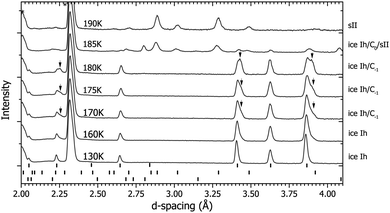
After compression to 0.2 GPa at 130 K (see Fig. 1 and 4) the diffraction pattern showed the sample to have the ice Ih structure (see Fig. 4), which is expected as these conditions are right on the boundary between ice Ih/Ic, II and IX/III.32 As the sample was heated, splitting of some of the ice Ih reflections was observed, for example those at ∼3.4 Å and ∼3.85 Å in Fig. 4 at 170–180 K. This splitting is attributed to the appearance of a new structure. At 185 K the sample converted into a mixture of sII and C0, and at 190 K all the diffraction peaks can be fitted with the sII clathrate structure.Data collected on this route were used to determine the crystal structure of C−1. The structure is described by the space group P63/mmc with lattice parameters a = 4.5160(7) Å and c = 7.2691(18) Å at 180 K/0.2 GPa. The D2O continues to adopt an ice Ih based network and the guest D2 occupy the channels within this structure (see Table 1 for crystallographic information and the ESI† further details). Under these low pressures the guest deuterium molecules are believed to be highly mobile as they are in sII and C0, and so the fractional occupancy, atomic position and thermal parameter given in Table 1 are approximations.9,14 The C−1 structure was also found to be highly dependent on the ‘starter ice’. For example, if a sample of C−1 was synthesised from a powder of ice Ih then the resultant C−1 crystal structure could be described by the filled ice Ih structure given in Table 1. However, if the ‘starter ice’ was ice Isd – a type of stacking-faulted ice (see Section 4.4) – then the filled ice Ih structure was unable to describe the observed diffraction pattern from the ‘C−1’ structure formed. Instead it is thought that the guest gas molecules ‘fill’ the structure with little disturbance to the host D2O framework of the starter material. Evidence from a recovered sample of C−1 formed from ice Isd showing this effect can be found in the ESI.† Unfortunately, a full Rietveld refinement of the filled ice Isd structure was unstable due to the difficulty in separating the cubic and hexagonal contributions to the diffraction pattern due to overlapping reflections, and determination of the deuterium uptake of the cubic/hexagonal fractions and boundaries in ice Isd (see ESI†).
| C−1 structure at P = 0.2 GPa, T = 180 K |
| Quality of fit: Rwp = 6.10% |
| Space group: P63/mmc |
| a = 4.5160(7) Å, c = 7.2691(18) Å, V = 128.39(3) Å3 |
| U iso(host) = 2.1(1) × 10−2 Å2 |
| U iso(guest) = 10.0(1) × 10−2 Å2 |
| Atom | Site | x | y | z | F |
|---|---|---|---|---|---|
| O1 | 4f | 0.3333 | 0.6667 | 0.0556(2) | 1.0 |
| D1 | 4f | 0.3333 | 0.6667 | 0.2007(3) | 0.5 |
| D2 | 12k | 0.4571(2) | 0.9141(2) | 0.0229(3) | 0.5 |
| Dguest | 2b | 0 | 0 | 0.25 | 0.55(3) |
| Bond | Length (Å) | Bond | Angle (degrees) |
|---|---|---|---|
| O1–D1 | 1.0547(3) | D2–O1–D2 | 114.50(2) |
| O1–D2 | 0.9964(1) | D1–O1–D2 | 103.79(1) |
| O1⋯O1 | 2.7299(3) | ||
| O1⋯O1 | 2.8256(7) |
4.4 Route δ
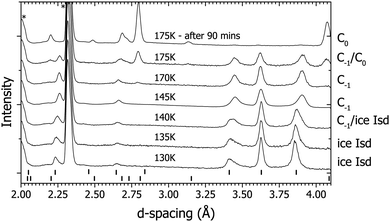
Upon decompression from the final structure observed on route γ, the sII clathrate converted into ice Isd17,33 – a stacking-faulted structure which is intermediate between ice Ih and ice Ic whose diffraction pattern in this case can still be indexed as ice Ih in the diffraction patterns (Fig. 5). Although the structure can still be indexed as ice Ih, the presence of ice Isd is characterized by the region of raised intensity between 3.43 and 3.86 Å.17 Ice Isd (formerly often referred to as ice Ic) is observed as the product when high-pressure ice phases are recovered to ambient pressure and warmed.17,33 An attempt was made to convert the ice Isd into ice Ih by heating to 230 K, but the ice Isd persisted to this temperature. Another way to turn the ice Isd into ice Ih would have been to melt then refreeze the water, however this would have resulted in a poor powder so it was deemed better to continue with ice Isd than to risk losing a well randomised powder. The sample was cooled to 130 K and compressed to 0.23 GPa with D2 (see Fig. 1 and 5) and then heated. At 140 K a similar behaviour was observed with the broadening of peaks attributed to ice Ih at ∼3.4 Å and ∼3.85 Å as was observed in route γ at 0.2 GPa (Fig. 4). As temperature was increased to 145 K, the broadening that was observed at 140 K turned out to be the growth of the new structure. At 145 K the contraction of the peak at ∼3.65 Å was observed (Fig. 5) which suggests that this new structure is actually the lower pressure form of the C−1 structure observed at 0.3 GPa. The temperature was increased further and at 175 K the C0 phase started to grow. At this point the gas pressure started to drop rapidly indicating either an extremely dense structure had formed or the sample was absorbing D2. After ∼90 minutes the gas pressure remained constant indicating the sample had absorbed all the gas it was capable of absorbing. The diffraction pattern showed that it had fully converted to the C0 phase (top diffraction pattern in Fig. 5).Though the phase boundaries of the H2–H2O system are relatively well known they are not for the D2–D2O system.5,10,11,19 At 0.3 GPa and 200 K the sample is quite near the phase boundary between sII and the suspected region where C0 is stable.10,11 There is the possibility that the observation of the C0 structure was just due to the phase boundaries being different in the deuterated system. This possibility was ruled out by returning to same conditions via a different route (cooling from the melt in route α) and C0 was not observed. Thus the C0 structure is thought to be metastable at 0.3 GPa in the temperature region studied. A previous neutron diffraction study was done by Lokshin et al. at 0.21 GPa where they cooled from above 200 K to 40 K in which they report no observation of C0 or any other structure such as an ice Isd based structure like C−1.9 This suggests that at 0.2 GPa the formation of both the C0 and C−1 structures were also metastable with respect to sII.
4.5 DFT calculations
Total energy DFT calculations were performed to determine if the structures observed are metastable at 0.2–0.3 GPa. For the C0 hydrate, we assumed a hydrogen-ordered water network and full occupancy of the guest sites, leading to a 2![[thin space (1/6-em)]](https://www.rsc.org/images/entities/char_2009.gif) :
:![[thin space (1/6-em)]](https://www.rsc.org/images/entities/char_2009.gif) 1 host–guest ratio; this is in calculations the most stable C0 hydrate.14 The C−1 hydrate was modelled with fully occupied H-sites at the centers of the cages in the antiferroelectric ice-XI water network (space group Pna21), to give a 2
1 host–guest ratio; this is in calculations the most stable C0 hydrate.14 The C−1 hydrate was modelled with fully occupied H-sites at the centers of the cages in the antiferroelectric ice-XI water network (space group Pna21), to give a 2![[thin space (1/6-em)]](https://www.rsc.org/images/entities/char_2009.gif) :
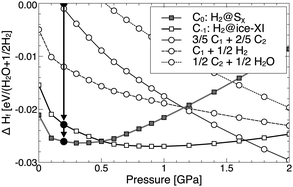
:![[thin space (1/6-em)]](https://www.rsc.org/images/entities/char_2009.gif) 1 hydrate. The calculated formation enthalpies ΔHf of both C0 and C−1, relative to decomposition into the respective most stable ice phase and solid hydrogen are shown in Fig. 6. There, we also show the reaction enthalpies of possible competing formation of C1 and C2 hydrates, considering excess hydrogen or ice as appropriate. The C1 and C2 hydrates were modelled in R
1 hydrate. The calculated formation enthalpies ΔHf of both C0 and C−1, relative to decomposition into the respective most stable ice phase and solid hydrogen are shown in Fig. 6. There, we also show the reaction enthalpies of possible competing formation of C1 and C2 hydrates, considering excess hydrogen or ice as appropriate. The C1 and C2 hydrates were modelled in R![[3 with combining macron]](https://www.rsc.org/images/entities/char_0033_0304.gif) and I41md structures that correspond to fully filled ice-II and ice-Ic water networks, and thus represent 6
and I41md structures that correspond to fully filled ice-II and ice-Ic water networks, and thus represent 6![[thin space (1/6-em)]](https://www.rsc.org/images/entities/char_2009.gif) :
:![[thin space (1/6-em)]](https://www.rsc.org/images/entities/char_2009.gif) 1 and 1
1 and 1![[thin space (1/6-em)]](https://www.rsc.org/images/entities/char_2009.gif) :
:![[thin space (1/6-em)]](https://www.rsc.org/images/entities/char_2009.gif) 1 hydrates, respectively. In the pressure region of 0.2–0.3 GPa both C−1 and C0 hydrate are stable against decomposition into ice and H2, and against the formation of the higher hydrates (we did not consider the sII structure here). The energetic order of C−1 and C0 reverses at 0.5 GPa, in line with literature findings.15 Around 1.7 GPa, the calculations predict that C−1 would decompose into a linear combination of C1 and C2 hydrates. The main results of the calculations – that C0 is more stable than C−1 at low pressures and C−1 eventually decomposes into higher hydrates – are independent of the choice of exchange–correlation functional, though values for transition pressures do vary.34
1 hydrates, respectively. In the pressure region of 0.2–0.3 GPa both C−1 and C0 hydrate are stable against decomposition into ice and H2, and against the formation of the higher hydrates (we did not consider the sII structure here). The energetic order of C−1 and C0 reverses at 0.5 GPa, in line with literature findings.15 Around 1.7 GPa, the calculations predict that C−1 would decompose into a linear combination of C1 and C2 hydrates. The main results of the calculations – that C0 is more stable than C−1 at low pressures and C−1 eventually decomposes into higher hydrates – are independent of the choice of exchange–correlation functional, though values for transition pressures do vary.34
5 Discussion & conclusions
Our results suggest the following view of the free energy landscape. When ice Ih was compressed above 0.2 GPa at 135 K it was no longer the lowest in free energy and thus no longer the most stable state. As the sample was warmed it transformed into a metastable state (C−1) that was lower in free energy than ice Ih at 0.3 GPa but higher than that of C0. As the sample was heated further it acquired enough energy to overcome the energy barrier to fall into the next local minimum in the free energy landscape, C0, and upon further heating the sample overcame the energy barrier to form sII clathrate which appears to be the global minimum of the free energy landscape at 0.3 GPa.If the results of the three routes explored are combined together they give a general transition sequence of ice Ih → C−1 → C0 → sII at both 0.2 and 0.3 GPa on warming. At these pressures ice Ih based structures are less stable than C0 for hydrogen hydrate.15,35 This means the sample goes through a series of transitions that occur in increasing stability. This cascading through metastable states from an unstable state (ice Ih in this case) to most stable (sII clathrate) is known as Ostwald's Rule of Stages (also known as Law of Steps).36,37 Ostwald's Rule of Stages has long been reported to occur in colloidal crystals, proteins and only very recently in smaller molecular or atomic systems when crystallising from the melt or amorphous material.37–39 Our work then also provides an example of Ostwald's Rule of Stages between crystalline structures.
This work illustrates the possibilities that metastable phases provide for materials discovery and production. Compression of ice Ih outside its stability range and subsequent warming has allowed us to produce a metastable phase C−1 that had not previously been observed, as well as allowing us to produce C0 at significantly lower pressures than had previously been possible. A similar approach might be used for the production of new networks in other network-forming systems (for example silica). An experimental exploration of the metastable phase diagram when combined with computational studies provides insight into the relative stabilities of phases and into the question that is difficult to answer with certainty in studies of phase transitions, that is, which is the stable phase at a given pressure and temperature?
Conflicts of interest
There are no conflicts of interest to declare.Acknowledgements
The authors would like to thank Chris Goodway, the pressure and furnace and cryogenics teams of the ISIS neutron source for their assistance throughout experiments. We would also like to thank Rachel Husband and Athina Frantzana for their assistance on experiments. We acknowledge support from ISIS the Engineering and Physical Sciences Research Council (EPSRC) through the award of beamtime and associated resources, EPSRC for a departmental training award studentship for MED and a Royal Thai Scholarship for PT.Notes and references
- J. S. Loveday and R. J. Nelmes, Phys. Chem. Chem. Phys., 2008, 10, 937–950 RSC.
- Y. Song, Phys. Chem. Chem. Phys., 2013, 15, 14524–14547 RSC.
- T. A. Strobel, K. C. Hester, C. A. Koh, A. K. Sum and E. D. Sloan, Jr., Chem. Phys. Lett., 2009, 478, 97–109 CrossRef CAS.
- D. M. D'Alessandro, B. Smit and J. R. Long, Angew. Chem., Int. Ed., 2010, 49, 6058–6082 CrossRef PubMed.
- W. L. Vos, L. W. Finger, R. J. Hemley and H. K. Mao, Phys. Rev. Lett., 1993, 71, 3150–3153 CrossRef CAS PubMed.
- M. Ozaki, S. Tomura, R. Ohmura and Y. H. Mori, Int. J. Hydrogen Energy, 2014, 39, 3327–3341 CrossRef CAS.
- R. Kumar, D. D. Klug, C. I. Ratcliffe, C. A. Tulk and J. A. Ripmeester, Angew. Chem., Int. Ed., 2013, 52, 1531–1534 CrossRef CAS PubMed.
- W. L. Mao, H. K. Mao, A. F. Goncharov, V. V. Struzhkin, Q. Z. Guo, J. Z. Hu, J. F. Shu, R. J. Hemley, M. Somayazulu and Y. S. Zhao, Science, 2002, 297, 2247–2249 CrossRef CAS PubMed.
- K. A. Lokshin, Y. S. Zhao, D. W. He, W. L. Mao, H. K. Mao, R. J. Hemley, M. V. Lobanov and M. Greenblatt, Phys. Rev. Lett., 2004, 93, 125503 CrossRef PubMed.
- V. S. Efimchenko, M. A. Kuzovnikov, V. K. Fedotov, M. K. Sakharov, S. V. Simonov and M. Tkacz, J. Alloys Compd., 2011, 509, S860–S863 CrossRef CAS.
- T. A. Strobel, M. Somayazulu and R. J. Hemley, J. Phys. Chem. C, 2011, 115, 4898–4903 CrossRef CAS.
- G. S. Smirnov and V. V. Stegailov, J. Phys. Chem. Lett., 2013, 4, 3560–3564 CrossRef CAS.
- T. A. Strobel, M. Somayazulu, S. V. Sinogeikin, P. Dera and R. J. Hemley, J. Am. Chem. Soc., 2016, 138, 13786–13789 CrossRef CAS PubMed.
- D. M. Amos, M.-E. Donnelly, P. Teeratchanan, C. L. Bull, A. Falenty, W. F. Kuhs, A. Hermann and J. S. Loveday, J. Phys. Lett., 2017, 8, 4295–4299 CAS.
- G.-R. Qian, A. O. Lyakhov, Q. Zhu, A. R. Oganov and X. Dong, Sci. Rep., 2014, 4, 5606 CrossRef CAS PubMed.
- Deuterated samples were used to avoid the high background scattering caused by the large incoherent neutron cross section of hydrogen.
- T. L. Malkin, B. J. Murray, C. G. Salzmann, V. Molinero, S. J. Pickering and T. F. Whale, Phys. Chem. Chem. Phys., 2015, 17, 60–76 RSC.
- M.-E. Donnelly, PhD thesis, The University of Edinburgh, 2016.
- Y. A. Dyadin, E. Y. Aladko, A. Y. Manakov, F. V. Zhurko, T. V. Mikina, V. Y. Komarov and E. V. Grachev, J. Struct. Chem., 1999, 40, 790–795 CrossRef CAS.
- V. E. Antonov, V. S. Efimchenko and M. Tkacz, J. Phys. Chem. B, 2009, 113, 779–785 CrossRef CAS PubMed.
- V. S. Efimchenko, V. E. Antonov, O. I. Barkalov, A. I. Beskrovnyy, V. K. Fedotov and S. N. Klyamkin, High Press. Res., 2006, 26, 439–443 CrossRef CAS.
- C. L. Bull, N. P. Funnell, M. G. Tucker, S. Hull, D. J. Francis and W. G. Marshall, High Press. Res., 2016, 7959, 1–10 Search PubMed.
- O. Arnold, J. C. Bilheux, J. M. Borreguero, A. Buts, S. I. Campbell, L. Chapon, M. Doucet, N. Draper, R. F. Leal, M. A. Gigg, V. E. Lynch, A. Markvardsen, D. J. Mikkelson, R. L. Mikkelson, R. Miller, K. Palmen, P. Parker, G. Passos, T. G. Perring, P. F. Peterson, S. Ren, M. A. Reuter, A. T. Savici, J. W. Taylor, R. J. Taylor, R. Tolchenov, W. Zhou and J. Zikovski, Nucl. Instrum. Methods Phys. Res., Sect. A, 2014, 764, 156 CrossRef CAS.
- A. C. Larson and R. B. Von Dreele, Los Alamos National Laboratory Report LAUR, 1994, pp. 86–748.
- G. Kresse and J. Furthmüller, Phys. Rev. B: Condens. Matter Mater. Phys., 1996, 54, 11169–11186 CrossRef CAS.
- G. Kresse and D. Joubert, Phys. Rev. B: Condens. Matter Mater. Phys., 1999, 59, 1758–1775 CrossRef CAS.
- M. Dion, H. Rydberg, E. Schröder, D. C. Langreth and B. I. Lundqvist, Phys. Rev. Lett., 2004, 92, 246401 CrossRef CAS PubMed.
- G. Román-Pérez and J. M. Soler, Phys. Rev. Lett., 2009, 103, 096102 CrossRef PubMed.
- J. Klimeš, D. R. Bowler and A. Michaelides, J. Phys.: Condens. Matter, 2010, 22, 022201 CrossRef PubMed.
- J. Klimeš, D. Bowler and A. Michaelides, Phys. Rev. B: Condens. Matter Mater. Phys., 2011, 83, 195131 CrossRef.
- A. D. Fortes, I. G. Wood, M. Alfredsson, L. Vočadlo and K. S. Knight, J. Appl. Crystallogr., 2005, 38, 612–618 CrossRef CAS.
- C. G. Salzmann, P. G. Radaelli, B. Slater and J. L. Finney, Phys. Chem. Chem. Phys., 2011, 13, 18468–18480 RSC.
- W. F. Kuhs, C. Sippel, A. Falenty and T. C. Hansen, Proc. Natl. Acad. Sci. U. S. A., 2012, 109, 21259–21264 CrossRef CAS PubMed.
- P. Teeratchanan, PhD thesis, The University of Edinburgh, 2017.
- P. Teeratchanan and A. Hermann, J. Chem. Phys., 2015, 143, 154507 CrossRef PubMed.
- W. Ostwald, Z. Phys. Chem., 1897, 22, 289–330 CAS.
- S.-Y. Chung, Y.-M. Kim, J.-G. Kim and Y.-J. Kim, Nat. Phys., 2009, 5, 68–73 Search PubMed.
- D. Cavallo, D. Mileva, G. Portale, L. Zhang, L. Balzano, G. C. Alfonso and R. Androsch, ACS Macro Lett., 2012, 1, 1051–1055 Search PubMed.
- C. G. Salzmann, E. Mayer and A. Hallbrucker, Phys. Chem. Chem. Phys., 2004, 6, 5156–5165 RSC.
Footnote |
| † Electronic supplementary information (ESI) available. See DOI: 10.1039/c8cp04464c |
| This journal is © the Owner Societies 2018 |

