 Open Access Article
Creative Commons Attribution 3.0 Unported Licence
Thermodynamic and kinetic isotope effects on the order–disorder transition of ice XIV to ice XII
Violeta
Fuentes-Landete
 a,
Karsten W.
Köster
b,
Roland
Böhmer
 b and
Thomas
Loerting
 *a
*a
aInstitute of Physical Chemistry, University of Innsbruck, A-6020 Innsbruck, Austria. E-mail: thomas.loerting@uibk.ac.at
bFakultät Physik, Technische Universität Dortmund, D-44221 Dortmund, Germany
First published on 13th August 2018
Abstract
Isotope effects accompanying the order–disorder transition of ice XIV to ice XII are studied using calorimetry, X-ray diffraction, and dielectric spectroscopy. Particular emphasis is placed on the impact of the cooling rate applied during high-pressure production and during ambient-pressure recooling on the degree of hydrogen order in the low-temperature ice XIV phase. For specimens from D2O, ordering is harder to achieve in the sense that despite smaller cooling rates, the degree of order is less than in crystals produced from H2O. The degree of ordering can be quantified in terms of the Pauling entropy using calorimetry and manifests itself in structural and dynamical features that were examined using X-ray diffraction and dielectric spectroscopy, respectively. In hydrogen chloride doped samples, H/D substitution was found to slow down the dipolar dynamics up to about 30-fold and shifts the order–disorder transition by 4–6 K. By contrast to earlier assumptions it is possible to reach a high degree of ordering also at ambient pressure, provided the cooling rate is small enough. That is, at ambient pressure, orthorhombic stress slows down the dipolar reorientation near the ordering transition by a factor of 300–2000 for H2O and 30–100 for D2O samples. Furthermore, by long-term storage of our samples at 77 K we have reached surprisingly large increases in degree of order. For the D2O samples we observed an unprecedented high order, corresponding to more than 45% of the Pauling entropy.
1. Introduction
Ice XII is a metastable hydrogen-disordered high-pressure phase of ice. Ice XII was first prepared and characterized in 1998 by Lobban et al.1 by slow crystallization from the liquid phase at 260 K at a pressure of 0.55 GPa. In the same year Chou et al. reported a new ‘‘High-Pressure Phase of H2O Ice’’ in the ice VI domain at 0.7–1.2 GPa and 276–299 K.2 They speculated on the relation of their new phase to ice XII but could not confirm it or rule it out. Later on, Salzmann et al. showed that the “Chou-phase” is indeed ice XII.3 Subsequent to the formation of ice XII from the liquid phase, Koza et al. reported on the formation of ice XII in a completely different region of the water phase diagram, that is, as an unexpected product in the preparation of high-density amorphous ice (HDA) at 77 K on compression of ice Ih up to 1.8 GPa.4,5 Kohl et al. then showed that along this route ice XII forms on compression of ice Ih at 77 K only via HDA, and not directly from ice Ih, and that the formation requires a sudden pronounced pressure drop at pressures >1.1 GPa that causes shockwave heating.6 Loerting et al. mapped out the metastability domain of ice XII at ∼158–212 K by crystallizing HDA under controlled conditions, without shockwaves.7 Thus, the metastability region of ice XII lies within the stability domain of ice V and ice VI. Salzmann et al. then demonstrated that the heating rate is the decisive parameter governing whether metastable ice IV, metastable ice XII, or a mixture of both crystallizes from HDA in the stability field of ice VI.8,9 The structure of ice XII is described by a tetragonal unit cell, with a space group of I![[4 with combining macron]](https://www.rsc.org/images/entities/char_0034_0304.gif) 2d, containing 12 water molecules with four O(1) and eight O(2) oxygen atoms.1 The O(2) oxygen atoms are connected by asymmetric H-bonds that form zigzag chains running along the a and b axes. These chains are interconnected by O(1)–O(2) H-bonds.10 The unit cell symmetry requires ice XII to be fully disordered. A fully disordered state of ice would be higher in configurational entropy than a fully ordered state. According to Pauling the corresponding entropy difference ΔSP of such two states amounts to 3.4 J K−1 mol−1.11,12
2d, containing 12 water molecules with four O(1) and eight O(2) oxygen atoms.1 The O(2) oxygen atoms are connected by asymmetric H-bonds that form zigzag chains running along the a and b axes. These chains are interconnected by O(1)–O(2) H-bonds.10 The unit cell symmetry requires ice XII to be fully disordered. A fully disordered state of ice would be higher in configurational entropy than a fully ordered state. According to Pauling the corresponding entropy difference ΔSP of such two states amounts to 3.4 J K−1 mol−1.11,12
Ice XIV (space group P212121), the hydrogen-ordered pendant of ice XII, was reported experimentally for the first time by Salzmann et al.13 together with theoretical predictions of its structure by Tribello et al.14 Key to prepare ice XIV is the use of HCl as dopant.13,15 By virtue of suitable doping the Bernal–Fowler ice rules16 are broken, and external point defects (ionic and/or Bjerrum defects) are generated on the ice lattice. These point defects may enhance dipolar dynamics, even though it is still unclear why some dopants do enhance the dynamics whereas others do not.17,18 Without dopant ice XII forms an orientational glass upon cooling to T < 100 K, i.e., a hydrogen-disordered ice in which reorientational dynamics is frozen. The orientational glass transition, i.e., the unfreezing of reorientational dynamics upon heating, is observed at 129 K using calorimetric methods,19 compatible with the results from dielectric spectroscopy.20 By introducing hydrogen chloride as a dopant the dielectric dynamics is enhanced by almost five orders of magnitude with respect to undoped ice XII,20 thereby preventing the freezing of reorientational dynamics even at T < 100 K. Thus, for suitably prepared HCl-doped samples, the thermodynamically favored ice XIV phase becomes kinetically accessible at T < 100 K. By using slow high-pressure cooling with rates qHP < 15 K min−1 it is possible to achieve a transition from completely disordered ice XII to ice XIV showing a high degree of hydrogen ordering.20 Under these conditions up to about 60 ± 3% of the Pauling entropy was detected at the ice XIV → ice XII transition. For crystals produced using larger high-pressure cooling rates (qHP = 30…70 K min−1) only about 20% of the Pauling entropy could be recovered.20 It is suggested in our previous work20 that by cooling hydrogen disordered ice XII back to T < 100 K, no more than 20% can be reached because orthorhombic stress prevents a subset of H atoms from ordering at ambient pressure. By increasing the pressure from 0.55 GPa (at 260 K)1 to 1.1 GPa (at 173 K)21 the lattice constant a shrinks by about 2% from 8.30 to 8.14 Å. This could be at the origin of the more effective hydrogen ordering process at high pressures. In other words, it was thought that slow high-pressure cooling is essential to enhance the degree of hydrogen order in ice XIV.20 By contrast, for other order–disorder pairs such as ice XIII/V, a recooling of the disordered phase at ambient pressure can lead back to the initial magnitude of hydrogen order.22
Since the ordering involves dynamics of the hydrogen network in an essentially static oxygen network, the study of isotope effects on the ordering transition is particularly relevant. However, in the literature there is not much information about isotope effects on order–disorder transitions in ice, and so we will study them here. We distinguish thermodynamic and kinetic isotope effects, where the former affect the equilibrium transition temperature and the latter the dynamics of the H/D-atoms. The kinetic isotope effect has been previously studied in liquid water,23,24 ice Ih,25–27 high-pressure crystalline ice28,29 and amorphous ice.30–32 Lately, an unusually large kinetic isotope effect on the relaxation time was observed near the calorimetric glass transition temperature Tg ≈ 136 K of low-density amorphous ice (LDA).33 Quantum effects were shown to play an important role near Tg in accelerating the H-dynamics much more than the D-dynamics. The disordering transition in H2O ice XIV takes place at ≈102 K, i.e., even below LDA's Tg.20 This suggests that quantum effects might play an important role also in the ordering transition of ice XII. For ice VI an isotope effect on the orientational glass-transition temperature of ∼6 K has been observed.34 In doped samples, which allow for the ordering of ice VI to produce ice XV, the degree of hydrogen ordering was found to be slightly higher in H2O ice XV than in D2O ice XV.34 The kinetic isotope effect on the ice V/XIII transition was quantified in dielectric studies revealing that dynamics in the D-network is typically a factor of 10 slower than in the H-network.35 This is in qualitative agreement with a calorimetric study by Salzmann et al.22
Even though six order–disorder pairs of ices are known, the thermodynamic isotope effect has only been measured for the ambient pressure pair ice Ih/ice XI, for which KOH serves as the most effective dopant.36 In this case, the order/disorder transition is observed at 72 K for H2O ice36 and 76 K for D2O ice.37 A more recent study on the complex dielectric constant confirmed this finding and showed that the ice Ih to ice XI transition temperature is on average 4.5 K higher in D2O than in H2O.38 Computationally, the difference in the equilibrium ordering transition temperature between H2O and D2O ice XI was found to be 6 K using the quasiharmonic approximation combined with ab initio density functional theory calculations.39
In this work, we examine how the dynamics of the hydrogen ordering in ice XII is affected upon substituting deuterons for hydrogens, i.e., by using D2O samples and DCl as dopant. This is a particularly important question since the structural information available for ice XIV is based on neutron data on doped D2O samples,13 whereas the maximum known hydrogen order of about 60% could only be achieved for doped H2O samples.20 Also, we further study the hydrogen ordering transition as a function of ambient pressure cooling rates on HCl and DCl samples. We will demonstrate that far more than 20% of hydrogen order can be recovered at ambient pressure by applying very low cooling rates at ambient pressure, as well as by exploiting aging effects for samples stored for several years at 77 K. In order to tackle these questions we employ differential scanning calorimetry (DSC) to assess the thermodynamic isotope effect (degree of ordering and transition temperatures) and dielectric relaxation spectroscopy to scrutinize both the kinetic (dielectric relaxation times) and thermodynamic isotope effects (transition temperatures). Powder X-ray diffraction on samples of different degree of ordering is used to investigate structural aspects related to the isotope effect. These techniques have been employed earlier to investigate the H2O-based ice XIV samples.3,20 Specific questions in the focus of our work are: (1) what is the maximum degree of ordering that can be reached in D2O ice XIV samples? (2) for both isotopomers, what is the difference in the degree of ordering for samples that are cooled at high-pressure vs. ambient-pressure conditions? (3) what is the isotope effect on the equilibrium ordering temperature? (4) how large is the kinetic isotope effect, accessible by dielectric dynamics?
2. Experimental methods
Sample preparation at 0.81 GPa
In the present work, doped ice XII was produced by crystallizing HDA. HDA itself is prepared according to the protocol by Mishima et al.,40 that is, by freezing an aqueous solution at ambient pressure and then pressurizing the resulting hexagonal ice to 1.6 GPa at 77 K. HDA was crystallized by decompression to 0.81 GPa and heating at >25 K min−1 to 185 K. At such high heating rates the competing crystallization channel to ice IV is effectively suppressed and pure ice XII forms, at least for undoped samples.19 Pure ice XII also forms under these conditions for several doped H2O samples20 and, as we demonstrate here, for DCl-doped D2O samples. The samples were pressurized in a piston-cylinder apparatus with an 8 mm bore, by using a computerized universal testing machine (Zwick, model BZ100/TL3S). Indium containers were employed to avoid unwanted pressure drops during compression. All doped ice XIV/XII crystals were prepared from 600 μl of 0.01 M DCl in D2O solution. HCl-doped samples included in the study of ambient pressure cooling rates and its degree of ordering are prepared in the manner shown in our previous work.20Characterization of quench-recovered samples at 1 bar
After quench-recovering the samples to 77 K and ambient pressure, they were checked using X-ray diffraction. The diffractograms were recorded at ambient pressure and ∼80 K using a Siemens D5000 diffractometer (Cu-Kα,1, λ = 1.5406 Å) in θ–θ geometry. This setup provides high intensity, stability of peak positions, and low background.We use calorimetry to examine the degree of order achieved in ice XIV. A differential scanning calorimeter (DSC8000 Perkin Elmer) was used. Under liquid nitrogen the samples were transferred into an aluminum capsule with a lid and cold loaded into the DSC instrument, following well established methods.19,20,22 Ambient pressure heating scans were recorded at 50 K min−1. The mass of the sample was obtained via the melting endotherm of ice, by using a value of 6280 kJ mol−1![[thin space (1/6-em)]](https://www.rsc.org/images/entities/char_2009.gif) 41 for D2O ice Ih.
41 for D2O ice Ih.
In the present work, three first-order phase transitions associated with latent heat were recorded calorimetrically for deuterated ice XIV samples. First, an endotherm at Tc ≈ 108 K indicating the deuteron order–disorder transition from ice XIV to ice XII. Second, an exotherm at Tx ≈ 158 K indicating the polymorphic transition from ice XII to cubic ice. And third, an endotherm at Tm ≈ 277 K which indicates the melting of D2O hexagonal ice. From a single calorigram, the transition entropy ΔS is extracted from the calorimetry scans in two independent ways: the latent heat ΔH at the disordering temperature Tc, corresponding to the product of ΔS and Tc, is calculated by comparison with a reference peak: either the exotherm of the ice XII to “cubic” ice (Ic)42–44 transition or the endotherm accompanying the melting of hexagonal ice. The ice XII → Ic transition is known to be accompanied by a latent heat of 1270 ± 50 J mol−1 (H2O)45 and 1408 ± 8 J mol−1 (D2O).46 The latent heats ΔH obtained from the peak area ratios are then divided by Tc giving ΔS values typically agreeing within 2%. Data points included on the figures of this work represent the calculation via the ratio of the peak areas from the first endotherm (XIV/XII transition) and the exotherm pertaining to the XII to ice Ic transition. Uncertainties given in figures include contributions from: reproducibility, baseline choice, ambiguities in placing onset and/or endpoint, and differences observed for the two methods of evaluation.
The experimental procedures employed for the present dielectric experiments are those outlined in detail in previous articles.35,47
3. Results and discussion
Degree of ordering from calorimetry
Application of different high-pressure cooling rates (qHP) for DCl in D2O doped samples changes the latent heat associated with the ice XIV → XII disordering transition, see the heating scans in Fig. 1(a). The latent heat associated with disordering increases with decreasing rates, qHP, applied during the prior high-pressure cooling at 0.81 GPa (brown curves). Fig. 1(b) shows how much entropy, ΔS, can be recovered for the different qHP. For qHP > 30 K min−1 the ice cannot order, that is, only disordered ice XII is obtained. This contrasts the behavior of HCl-doped H2O samples, for which some hydrogen order was detected even for our highest rates, qHP ≈ 100 K min−1 (see blue dashed line in Fig. 1(b)). For qHP of 2–30 K min−1, only ∼5–10% of the Pauling entropy is recovered in deuterated samples. On the other hand, for qHP < 2 K min−1 larger values are obtained, reaching ∼25–30% at qHP = 0.6 K min−1. Higher production pressures of 1.2 and 1.5 GPa were examined to test for the possibility of higher degrees of ordering (green and orange symbols, respectively). However, at qHP = 0.5 K min−1 the degree of order matches the one obtained also at 0.81 GPa. That is, increasing the pressure does not further increase the order. Different from the hydrogenated samples, represented as blue dashed line in Fig. 1(b), a plateau is not reached yet for the lowest qHP employed here. Thus, for D2O it remains unclear what the maximum degree of ordering would be if rates qHP ≪ 0.5 K min−1 could be reached. To emphasize the results for small cooling rates, Fig. 1(c) compares the transition entropies ΔS that were obtained for the hydrogenated and deuterated samples on a semi-logarithmic plot.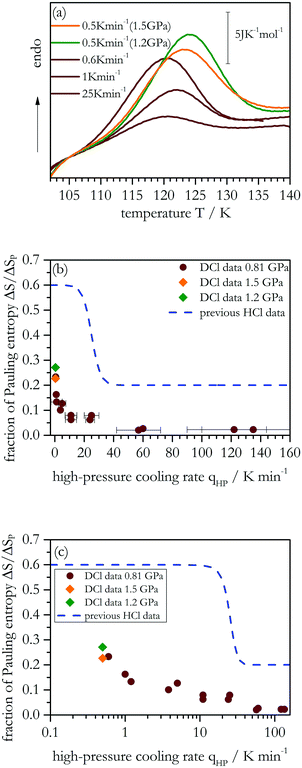 | ||
| Fig. 1 (a) Calorimetric heating scans (50 K min−1) at ambient pressure for DCl-doped D2O samples. Brown curves are from samples obtained at 0.81 GPa, green and orange at 1.2 GPa and 1.5 GPa, respectively. (b) Fraction of the Pauling entropy recovered as a function of the high-pressure cooling rate, qHP. The blue dashed line indicates previous results for HCl-doped ice XIV.20 (c) Same as Fig. 1(b) but in a semi-logarithmic representation. Each individual point represents an average of two or three different measurements. Error bars on the y-axis are smaller than the symbol size. The error bars on the x-axis reflect the fluctuation of the cooling rate in the proximity of and through the order–disorder transition at 0.81 GPa. | ||
Ordering in deuterated ice XII is clearly slower and more difficult to achieve than in hydrogenated ice XII. Furthermore, the upturn in Fig. 1(b) for hydrogenated samples sets in at qHP < 30 K min−1 already, i.e., at larger rates than for the deuterated samples (at qHP < 1 K min−1). The factor of about 30 between the two onset rates suggests that near the ordering temperature at 0.81 GPa the dynamics of hydrogen atoms is thirty times faster than that of the deuterons.
In addition to assessing cooling rate effects on the degree of order reached in the low-temperature phase, DSC also allows one to quantify the thermodynamic isotope effect on the (dis)ordering temperature Tc. Fig. 2 compares DSC scans for samples with the highest degree of order that we have been able to achieve. For the HCl-doped sample (∼0.6 ΔSp, blue trace) the onset of latent heat uptake differs clearly from that of the DCl-doped sample (∼0.3 ΔSp, brown trace). For DCl-doped ice XIV the endotherm has an onset temperature Tc = 108 ± 2 K, while for HCl-doped ice XIV the corresponding onset temperature is Tc = 102 ± 3 K, for equivalent experimental conditions. In addition, the peak of the DSC trace is somewhat broader for the deuterated sample. The difference between the two onset temperatures represents an isotope effect of 6 ± 2 K. The isotope effect on the endpoint temperatures amounts to 7 ± 2 K.
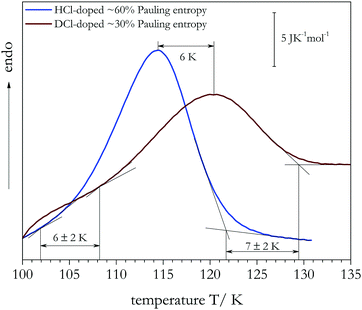 | ||
| Fig. 2 Calorimetry scans for HCl (qHP = 4.8 K min−1) and DCl-doped (qHP = 0.6 K min−1) ice XIV samples measured at ambient pressure with 50 K min−1. | ||
Ordering at ambient pressure
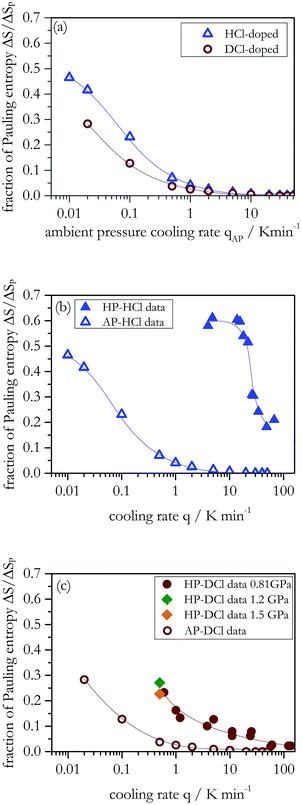
Let us now assess the degree of ordering that can be reached for doped ice XII samples that are cooled at different ambient-pressure cooling rates (qAP). The ice XII samples were obtained by heating ice XIV, through the order–disorder transition to 133 K for HCl-doped samples and 143 K for DCl-doped samples. These temperatures were chosen to avoid conversion to ice Ic, but to allow for full disordering, i.e., observation of the entire endotherm (see Fig. 2). Fig. 3(a) shows the fraction of the Pauling entropy (ΔS/ΔSP) obtained from DSC scans as a function of the previous cooling rate. It is evident that decreasing qAP increases the degree of ordering released at the ice XIV → XII conversion. For larger qAP we obtain a constant value as a plateau indicating that no ordering takes place at all. In other words, the hydrogen or deuterium atoms do not order at all for qAP > 20 K min−1. Furthermore, for qAP < 1 K min−1, we clearly see a major increase of the degree of hydrogen order for both isotopes.The influence of pressure on the ice XIV–XII transition was previously pointed out from Raman work by Salzmann et al.48 who stated that “hydrogen ordering seems to be much more difficult at ambient pressure than at high pressure and a less ordered ice XIV is obtained”. That seems to be reasonable for their cooling rate qAP = 0.5 K min−1, where also from the present DSC work only less than 10% of the Pauling entropy can be recovered. However, by lowering qAP by almost two orders of magnitude, we observe more than 40% of the Pauling entropy for HCl, and about 28% for DCl, see Fig. 3(b) and (c). The highest values are obtained for the slowest cooling rate available in our DSC instrument. Although for the deuterated samples we cannot reach the plateau seen in Fig. 1(b), we conjecture that this would be the case for sufficiently slow ambient-pressure cooling rates. For ice XII we are not aware of previous reports demonstrating that degrees of order can be reached at ambient pressure which are similar to the ones reached at 0.81 GPa previously. It appears, though, that qAP needs to be much smaller than qHP to reach similar degrees of ordering. Specifically, for hydrogenated samples qAP has to be smaller than qHP by a factor of 300–2000 to reach similar fractions of Pauling entropy. For deuterated samples the corresponding factor is only 30–100, i.e., the influence of pressure and orthorhombic stress on the ordering dynamics is larger for hydrogenated than for deuterated samples (compare Fig. 3(b) and (c) for the same fraction of Pauling entropies).
Ordering at 77 K upon storage in liquid nitrogen
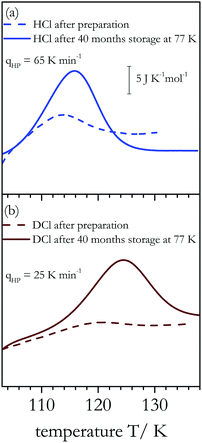
The data in Fig. 3 suggest that for DCl-doped D2O samples the plateau has not yet been reached for cooling rates as low as 0.02 K min−1. This suggests that long-term annealing below the ordering temperature might increase the degree of ordering further. Thus, we have stored some ice XIV samples, both D2O and H2O, for about 40 months in liquid nitrogen, providing time for each sample to approach thermodynamic equilibrium. For ice XIV we regard thermodynamic equilibrium to involve the maximally ordered ice XIV state, which we had determined to be about 60% for H2O samples.20Fig. 4 shows two DSC scans that were recorded right after preparation (dashed lines) and two that were acquired after 40 months of storage in liquid nitrogen (full lines). Clearly, the endotherms of the aged samples have increased significantly: After 40 months of storage at 77 K the degree of order has increased from initially about 20% to more than 50% for a sample prepared at qHP = 65 K min−1 from H2O (see Fig. 4(a)). Similarly, it has increased from initially less than 10% to more than 35% for a sample prepared at qHP = 25 K min−1 from D2O (Fig. 4(b)). Table 1 summarizes the Pauling entropy fractions achieved before and after long-term storage in liquid nitrogen for the data shown in Fig. 4 and for additional samples. By contrast to the situation seen in Fig. 4 the degree of order does not change much for samples that were initially already well ordered since they were prepared through slow high-pressure cooling. Fig. 8(a), below, shows the dielectric relaxation times from ref. 20 for HCl-doped ice XIV and additional data measured in the present work (and discussed below). Considerable extrapolation of these data to 77 K (green dashed line in Fig. 8(a)) results in dielectric relaxation times of the order of several hours. That is, the increase in the endotherm seen in Fig. 4(a) after 40 months is a consequence of annealing for a large number of dielectric relaxation times. For the DCl doped sample only about 20 dielectric relaxation times have passed after 40 months at 77 K (compare red dashed line in Fig. 8(a)). Still, an increase to a fraction of 47% of the Pauling entropy is measured (see Table 1), which is clearly higher than anything observed before in the literature (compare also Fig. 4(b)). Possibly even higher fractions can be recovered after many years of storage. However, for the DCl-doped samples it is currently unclear whether 47% is the maximum that can be obtained or whether even longer storage might increase the order to 60%, too. In case of HCl-doped H2O samples the degree of order in a sample initially prepared at qHP = 14 K min−1 from H2O remains unchanged near 60% after 40 months of storage, in spite of having aged for about 30 dielectric relaxation times at liquid nitrogen temperature (extrapolate blue line in Fig. 8(a)). This suggests that 60% order is the maximum that can be reached. This degree of order has not been reached after 40 months in liquid nitrogen for samples initially prepared at large qHP (see Table 1).| HCl | q HP = 65 K min−1 | q HP = 14 K min−1 |
|---|---|---|
| After sample preparation | 21 ± 3% | 58 ± 4% |
| After 40 months storage at 77 K | 54 ± 4% | 58 ± 4% |
| DCl | q HP = 25 K min−1 | q HP = 0.6 K min−1 |
|---|---|---|
| After sample preparation | 8 ± 1% | 27 ± 3% |
| After 40 months storage at 77 K | 37 ± 2% | 47 ± 3% |
X-ray diffraction
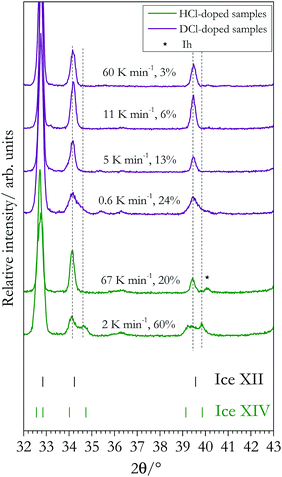
Ice XII and ice XIV can be distinguished not only by neutron diffraction, but also by powder X-ray diffraction.13,20 This is because the oxygen network is affected by the order in the hydrogen network, giving rise to an “orthorhombic splitting” of the (310) and (301) Bragg peaks (indexed with respect to the tetragonal high-temperature structure). In this work we prepared samples displaying different degrees of order, allowing us to study its effect on the splittings. Using Cu-Kα,1 radiation these Bragg peaks appear at 2θ = 34.1° and 39.6°, see the vertical dashed lines in Fig. 5. Both splittings are well resolved for the 60% hydrogen-ordered sample, but absent for the 20% ordered HCl-doped sample (bottom two traces in Fig. 5). Note that the peak marked by the asterisk marks a contamination with ice Ih. Its position is shifted compared to the expected location for the splitting, but matches the position for ice Ih exactly. For the DCl-doped samples a clear splitting is not resolved. The top four traces in Fig. 5 are for D-ordered ice XIV samples where the order increases from around 3% to 24%. Between 3% and 13% there is a single peak both at 2θ = 34.1° and 39.6°. These peaks are seen to broaden and develop a wide-angle shoulder at ∼24% ordering. However, a splitting as evident for the 60% H-ordered sample cannot be reached. That is, qualitatively the lower degree of ordering as assessed by calorimetry is reflected by an absence of the two splittings in the diffractograms shown in Fig. 5.Dielectric relaxation spectroscopy
To study the impact of the isotope effects on the dipolar dynamics of ice XII and ice XIV, we carried out dielectric measurements. Dielectric data (a) for undoped H2O and (b) for undoped D2O ice XII are shown in Fig. 6(a) and (b), respectively. In both crystals dielectric loss peaks are resolved near 140 K and one recognizes that the dynamics in deuterated ice XII is about 1 decade slower than in hydrogenated ice XII. A clear isotope effect is evident also for the hydrogen chloride doped samples: The dynamics in ice XII/XIV-HCl, see Fig. 6(c), is also roughly ten times faster than in ice XII/XIV-DCl, see Fig. 6(d). Overall, hydrogen chloride doping leads to an enhancement of the dipolar dynamics by about 104 with respect to the undoped samples. Furthermore, acid doping generates electrical conductivity effects that become obvious from the upturn in ε′′(ν) towards low frequencies, see Fig. 6(c) and (d).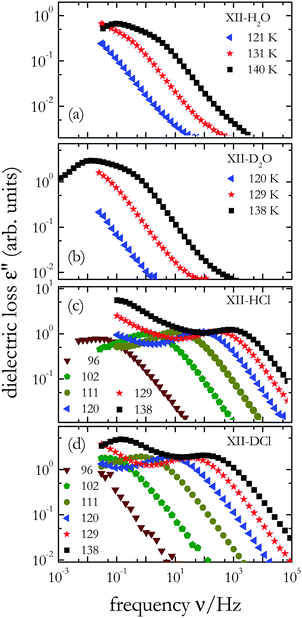 | ||
| Fig. 6 Dielectric loss spectra of (a) undoped H2O ice XII, (b) undoped D2O ice XII, (c) hydrogenated ice XII/XIV-HCl, and (d) deuterated ice XII/XIV-DCl; temperatures are given in Kelvin. | ||
For a quantitative analysis of the dielectric loss spectra, peak frequencies, νmax, were read out from the plots. From spectra devoid of a peak, νmax was estimated by shifting the spectra horizontally along the frequency axis until best overlap with a suitably chosen reference spectrum was achieved. From the required shift factors, relaxation frequencies can be inferred in an extended temperature range. This procedure assumes that the overall loss amplitude is temperature independent and works best if the spectral shape is (almost) temperature invariant, i.e., if frequency-temperature equivalence is applicable. To check for this feature, in Fig. 7 we demonstrate the result of the scaling procedure just described by horizontally shifting the data presented in Fig. 6(d). As reference spectrum in Fig. 7 we included data recorded at 105 K, a temperature at which a loss peak is still observed. Fig. 7 shows that apart from some scatter appearing at dielectric loss amplitudes about 2 decades below the peak maximum, an almost perfect match of the curves is achieved. For T > 105 K the application of this procedure is not necessary for D2O ice XII/XIV-DCl because well-defined peaks are visible directly in the raw spectra, see Fig. 6(d). Dielectric relaxation times τmax = (2πνmax)−1 thus obtained from the dielectric spectra via direct peak analysis (full symbols) and from the shift procedure (open symbols) are summarized in an Arrhenius plot, Fig. 8(a).
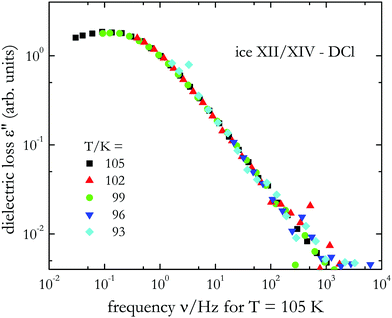 | ||
| Fig. 7 Master plot of the dielectric loss spectra for D2O ice XII/XIV-DCl that was generated on the basis of the data in Fig. 6(d) by shifts solely along the frequency axis. From the shift factors required to achieve overlap with the 105 K reference spectrum, peak frequencies can be extrapolated. These estimates rest on the validity of frequency-temperature equivalence, an assumption which is confirmed here by the excellent overlap of the spectra. | ||
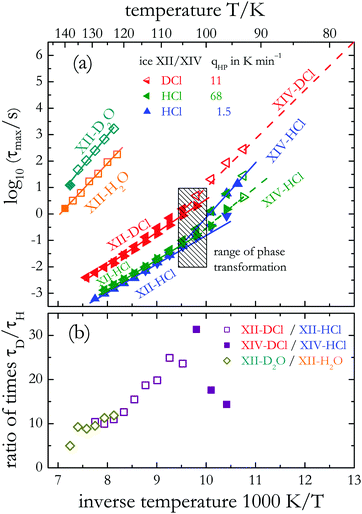 | ||
| Fig. 8 (a) Arrhenius plot of various doped/undoped and hydrogenated/deuterated ices as indicated. For the doped ices the high-pressure cooling rate qHP is given in K min−1. The data for undoped hydrogenated ice XII and those for fast high-pressure-cooled ice XII/XIV-HCl are taken from ref. 20. Results from the other samples are from the present work. Filled symbols refer to relaxation times from loss peaks, open symbols from applying frequency-temperature equivalence. Triangles pointing down or right refer to measurements carried out upon cooling, those pointing up or left refer to heating. All other measurements were performed also while heating the samples. The solid lines reflect Arrhenius laws, eqn (1), with the parameters given in Table 2. (b) Time scale ratios τD/τH calculated for various phases. For ice XII/XIV-HCl the data for the slowly high-pressure-cooled sample was used. | ||
For the doped crystals the phase transition temperatures are evident from clear breaks in slope, i.e., from changes in the effective energy barriers E. From these data we can infer transition temperatures Tc of 102 ± 4 K and 106 ± 4 K for hydrogenated and deuterated doped ice XIV samples, respectively. These temperatures, and thus the thermodynamic isotope effect of 4 ± 2 K, compare favorably with the values deduced from the calorigrams shown in Fig. 2.
The solid lines in Fig. 8(a) reflect thermally activated behavior for the relaxation times
τmax = τ0![[thin space (1/6-em)]](https://www.rsc.org/images/entities/char_2009.gif) exp(E/RT) exp(E/RT) | (1) |
| q HP/K min−1 | t store/months | E (ice XII)/kJ mol−1 | E (ice XIV)/kJ mol−1 | |
|---|---|---|---|---|
| H2O | 48 | 37 | 38 ± 3* | |
| D2O | 50 | 30 | 45 ± 3 | |
| H2O–HCl | 1.5 | 1.1 | 21 ± 2 | 38 ± 3 |
| H2O–HCl | 68 | 6.8 | 21 ± 2* | 36 ± 3* |
| D2O–DCl | 11 | 17 | 26 ± 2 | 34 ± 3 |
Similar barriers are found in the hydrogenated and deuterated ice XIV phases that were produced using high-pressure cooling rates qHP > 10 K min−1, cf.Table 2. This implies that for these two samples the time scale ratio τD/τH which quantifies the impact of the H/D isotope substitution on the dynamics is roughly constant (of the order of 40 ± 10, not shown). However, the DCl-doped, deuterated ice XII phase displays an about 25% larger activation energy than its hydrogenated counterpart.
In Fig. 8(b) we summarize the time scale ratio τD/τH involving also other samples. One recognizes that depending on temperature and dopant the relaxation times τmax deviate from each other by factors of about 10 to 30 when comparing the results for the hydrogenated with those for the deuterated samples. Similar τD/τH ratios (in the range of 10…20) can be inferred from a comparison of the data for hydrogenated ice V-HCl and deuterated ice V-DCl.35 For undoped ice V larger τD/τH ratios (reaching values of ≈100 near 125 K) are found.35 From the dielectric relaxation times of ice Ih–H2O–KOH49 and those from Ih–D2O–KOD50 ratios increasing from ≈25 near 100 K to ≈140 near 77 K can be determined.
4. Conclusions
In this work we have carefully studied both the kinetic and thermodynamic isotope effects on the order–disorder transition of ice XIV to ice XII using three different methods. A comparison of HCl and DCl samples by X-ray diffraction reveals that deuterated samples are much harder to order than hydrogenated ice XII. The orthorhombic splittings seen for the maximally ordered hydrogenated sample in X-ray diffractograms (Fig. 5) could not be resolved for deuterated samples. A shoulder hinting at the splitting appears only for deuterated samples produced using very slow high-pressure cooling with rates of qHP ≈ 0.5 K min−1. From the evaluation of calorimetry experiments we also see that deuterated samples are more difficult to order than hydrogenated samples under the same experimental conditions. The highest degree of ordering obtained under pressure (and without aging) for DCl-doped samples amounts to ∼30% of the Pauling entropy when using the slowest high-pressure cooling rate (qHP = 0.5–0.6 K min−1) achieved here. For comparison, for hydrogenated samples we were able to obtain ∼60% of the Pauling entropy using high-pressure cooling rates of qHP = 4 K min−1 (see ref. 20). The thermodynamic isotope effect on the transition temperature amounts to about 4–6 K as consistently seen from the DSC and dielectric loss data.The effect of pressure and long-term storage are evaluated here from DSC and also dielectric experiments. It was thought previously that use of pressure is essential for ordering ice XIV because of the role played by orthorhombic stress.20 Here, it is demonstrated that with sufficiently low ambient-pressure cooling rates (qAP < 0.5 K min−1), degrees of ordering similar to those obtained at high pressure can be reached. The maximum degree of ordering is obtained with the slowest possible ambient-pressure cooling rate that our DSC instrument can achieve (qAP = 0.01 K min−1). Thus, the effect of orthorhombic stress is not to prevent the ordering transition at ambient pressure, but rather to slow down the time scales required to achieve order by approximately a factor of 300–2000 for H2O and 30–100 for D2O samples, as seen in Fig. 4. Furthermore, we have observed a very interesting “aging” effect on our samples when remeasured after 40 months of storage at liquid nitrogen temperature. All samples which were initially much less than 60% ordered, reach now higher degrees of ordering than those obtained right after preparation. In fact, all of the HCl-doped samples are close to the maximum degree of order of 60% after 40 months of storage. For the DCl-doped D2O samples storage for 40 months has allowed us to reach 47% of the Pauling entropy – higher than all fractions obtained from other protocols, including protocols involving slow cooling at high-pressure. In previous work the neutron structure of ice XIV was determined on a sample of ice XII cooled at qHP = 0.8 K min−1.13 According to Fig. 1(c), this sample had a degree of order of around 20%, which becomes evident as residual disorder on the D4, D5, D12 and D13 atom positions in the unit cell.13 We surmise that the residual disorder on these atom positions is greatly reduced in the sample aged for 40 months in liquid nitrogen. This calls for a neutron study of aged D2O-ice XIV samples. The large effect on the degree of ordering is rationalized based on extrapolations of the dielectric relaxation times measured for these samples (see Fig. 8(a)). At 77 K the (considerably) extrapolated dielectric relaxation times can be surprisingly short, so that a time scale of a couple of months seems to be sufficient to achieve a saturated ordering in ice XIV.
In general, deuteration slows the dielectric ambient-pressure dynamics down by about a factor of 10…30. In the ordered ice XIV-HCl phase it is found that the activation energy from dielectric relaxation does not significantly depend on the degree of ordering. Finally, for undoped ice XII the activation energy does increase with deuteration, similar to previous findings for undoped ice V.
Conflicts of interest
There are no conflicts to declare.Acknowledgements
We thank Agnes Raidt for contributing some dielectric measurements and Catalin Gainaru for fruitful discussions. Support of this project by the Deutsche Forschungsgemeinschaft (DFG) under Grant No. BO1301/12-1 and the Austrian Science Fund FWF, bilateral Project No. I1392 is gratefully acknowledged. V. F. L. is a recipient of a DOC fellowship of the Austrian Academy of Sciences ÖAW.References
- C. Lobban, J. L. Finney and W. F. Kuhs, Nature, 1998, 391, 268 CrossRef.
- I.-M. Chou, J. G. Blank, A. F. Goncharov, H.-K. Mao and R. J. Hemley, Science, 1998, 281, 809–812 CrossRef PubMed.
- C. Salzmann, I. Kohl, T. Loerting, E. Mayer and A. Hallbrucker, J. Phys. Chem. B, 2002, 106, 1–6 CrossRef.
- M. Koza, H. Schober, A. Tölle, F. Fujara and T. Hansen, Nature, 1999, 397, 660–661 CrossRef.
- M. M. Koza, H. Schober, T. Hansen, A. Tölle and F. Fujara, Phys. Rev. Lett., 2000, 84, 4112–4115 CrossRef PubMed.
- I. Kohl, E. Mayer and A. Hallbrucker, Phys. Chem. Chem. Phys., 2001, 3, 602–605 RSC.
- T. Loerting, I. Kohl, C. Salzmann, E. Mayer and A. Hallbrucker, J. Chem. Phys., 2002, 116, 3171 CrossRef.
- I. Kohl, T. Loerting, C. Salzmann, E. Mayer and A. Hallbrucker, High-density amorphous ice and its phase transformation to ice XII, in New Kinds of Phase Transition: Transformation in Disordered Substances, ed. V. V. Brazhkin, S. V. Buldyrev, V. N. Ryhzov, H. E. Stanley, Kluwer Academic Publishers, 2002 Search PubMed.
- C. G. Salzmann, I. Kohl, T. Loerting, E. Mayer and A. Hallbrucker, Can. J. Phys., 2003, 81, 25–32 CrossRef.
- M. O’Keeffe, Nature, 1998, 392, 879 CrossRef.
- L. Pauling, J. Am. Chem. Soc., 1935, 57, 2680–2684 CrossRef.
- C. P. Herrero and R. Ramírez, J. Chem. Phys., 2014, 140, 234502 CrossRef PubMed.
- C. G. Salzmann, P. G. Radaelli, A. Hallbrucker, E. Mayer and J. L. Finney, Science, 2006, 311, 1758–1761 CrossRef PubMed.
- G. A. Tribello, B. Slater and C. G. Salzmann, J. Am. Chem. Soc., 2006, 128, 12594–12595 CrossRef PubMed.
- C. G. Salzmann, P. G. Radaelli, E. Mayer and J. L. Finney, Phys. Rev. Lett., 2009, 103, 105701 CrossRef PubMed.
- J. D. Bernal and R. H. Fowler, J. Chem. Phys., 1933, 1, 515 CrossRef.
- K. W. Köster, T. Klocke, F. Wieland and R. Böhmer, Phys. Rev. B, 2017, 96, 134301 CrossRef.
- C. G. Salzmann, P. G. Radaelli, B. Slater and J. L. Finney, Phys. Chem. Chem. Phys., 2011, 13, 18468–18480 RSC.
- C. G. Salzmann, I. Kohl, T. Loerting, E. Mayer and A. Hallbrucker, Phys. Chem. Chem. Phys., 2003, 5, 3507–3517 RSC.
- K. W. Köster, V. Fuentes-Landete, A. Raidt, M. Seidl, C. Gainaru, T. Loerting and R. Böhmer, Nat. Commun., 2015, 6, 7349 CrossRef PubMed.
- S. Klotz, G. Hamel, J. S. Loveday, R. J. Nelmes and M. Guthrie, Z. Kristallogr., 2003, 218, 117–122 Search PubMed.
- C. G. Salzmann, P. G. Radaelli, J. L. Finney and E. Mayer, Phys. Chem. Chem. Phys., 2008, 10, 6313–6324 RSC.
- R. T. Hart, Q. Mei, C. J. Benmore, J. C. Neuefeind, J. F. C. Turner, M. Dolgos, B. Tomberli and P. A. Egelstaff, J. Chem. Phys., 2006, 124, 134505 CrossRef PubMed.
- U. Bergmann, D. Nordlund, Ph. Wernet, M. Odelius, L. G. M. Pettersson and A. Nilsson, Phys. Rev. B, 2007, 76, 024202 CrossRef.
- G. P. Johari and S. J. Jones, J. Chem. Phys., 1975, 62, 4213–4223 CrossRef.
- F. Bruni, G. Consolini and G. Careri, J. Chem. Phys., 1993, 99, 538–547 CrossRef.
- L. E. Bove, S. Klotz, A. Paciaroni and F. Saccheti, Phys. Rev. Lett., 2009, 103, 165901 CrossRef PubMed.
- F. Yen, Z. Chi, A. Berlie, X. Liu and A. F. Goncharov, J. Phys. Chem. C, 2015, 119, 20618–20622 CrossRef.
- S. J. La Placa, W. C. Hamilton, B. Kamb and A. Prakash, J. Chem. Phys., 1973, 58, 567–580 CrossRef.
- E. L. Gromnitskaya, I. V. Danilov, A. G. Lyapin and V. V. Brazhkin, Phys. Rev. B, 2015, 92, 134104 CrossRef.
- M. S. Elsaesser, K. Winkel, E. Mayer and T. Loerting, Phys. Chem. Chem. Phys., 2010, 12, 708–712 RSC.
- G. P. Johari, A. Hallbrucker and E. Mayer, J. Chem. Phys., 1990, 92, 6742–6746 CrossRef.
- C. Gainaru, A. L. Agapov, V. Fuentes-Landete, K. Amann-Winkel, H. Nelson, K. W. Köster, A. I. Kolesnikov, V. N. Novikov, R. Richert, R. Böhmer, T. Loerting and A. P. Sokolov, Proc. Natl. Acad. Sci. U. S. A., 2014, 111, 17402–17407 CrossRef PubMed.
- J. J. Shephard and C. G. Salzmann, Chem. Phys. Lett., 2015, 637, 63–66 CrossRef.
- K. W. Köster, A. Raidt, V. Fuentes-Landete, C. Gainaru, T. Loerting and R. Böhmer, Phys. Rev. B, 2016, 94, 184306 CrossRef.
- Y. Tajima, T. Matsuo and H. Suga, Nature, 1982, 299, 810–812 CrossRef.
- T. Matsuo, Y. Tajima and H. Suga, J. Phys. Chem. Solids, 1986, 47, 165–173 CrossRef.
- F. Yen and Z. Chi, Phys. Chem. Chem. Phys., 2015, 17, 12459–12461 RSC.
- B. Pamuk, P. B. Allen and M. V. Fernández-Serra, Phys. Rev. B, 2015, 92, 134105 CrossRef.
- O. Mishima, L. D. Calvert and E. Whalley, Nature, 1984, 310, 393–395 CrossRef.
- E. A. Long and J. D. Kemp, J. Am. Chem. Soc., 1936, 58, 1829–1834 CrossRef.
- We note that a pure crystal of cubic ice has never been produced. When referring to the ice “cubic ice” (ice Ic) we actually speak about stacking-disordered ice containing hexagonal faults. See ref. 43 and 44.
- W. F. Kuhs, C. Sippel, A. Falenty and T. C. Hansen, Proc. Natl. Acad. Sci. U. S. A., 2012, 109, 21259–21264 CrossRef PubMed.
- T. L. Malkin, B. J. Murray, C. G. Salzmann, V. Molinero, S. J. Pickering and T. F. Whale, Phys. Chem. Chem. Phys., 2015, 17, 60–76 RSC.
- I. Kohl, E. Mayer and A. Hallbrucker, J. Phys. Chem. B, 2000, 104, 12102–12104 CrossRef.
- C. G. Salzmann, E. Mayer and A. Hallbrucker, Phys. Chem. Chem. Phys., 2004, 6, 1269–1276 RSC.
- K. Amann-Winkel, C. Gainaru, P. H. Handle, M. Seidl, H. Nelson, R. Böhmer and T. Loerting, Proc. Natl. Acad. Sci. U. S. A., 2013, 110, 17720–17725 CrossRef PubMed.
- C. G. Salzmann, A. Hallbrucker, J. L. Finney and E. Mayer, Chem. Phys. Lett., 2006, 429, 469–473 CrossRef.
- S. Kawada, J. Phys. Chem. Solids, 1989, 50, 1177–1184 CrossRef.
- S. Kawada, J. Phys. Soc. Jpn., 1989, 58, 295–300 CrossRef.
| This journal is © the Owner Societies 2018 |

