 Open Access Article
Creative Commons Attribution 3.0 Unported Licence
Mechanisms of reinforcement in polymer nanocomposites†
N.
Molinari
 a,
A. P.
Sutton
a and
A. A.
Mostofi
 *ab
*ab
aDepartment of Physics and the Thomas Young Centre for Theory and Simulation of Materials, Imperial College London, London SW7 2AZ, UK. E-mail: nicola.molinari12@alumni.imperial.ac.uk; a.mostofi@imperial.ac.uk; Tel: +44 (0)20 7594 8154
bDepartment of Materials and the Thomas Young Centre for Theory and Simulation of Materials, Imperial College London, SW7 2AZ, UK
First published on 31st August 2018
Abstract
Coarse-grained molecular dynamics simulations are used to elucidate molecular mechanisms responsible for different mechanical behaviours of elastomers containing spherical particles with different volume fractions. We observe that different filler volume fractions result in qualitatively different responses of the polymer nanocomposite to tensile strain. At relatively low filler volume fraction a yield drop appears in the stress–strain curve. As the filler volume fraction increases there is a reduction in the rate of plastic hardening, becoming plastic softening at sufficiently high filler volume fraction. We demonstrate that these behaviours are a result of the network formed by the polymer chains and filler particles. We identify three distinct molecular structural motifs between polymer and filler particles whose relative prevalence varies with the filler volume fraction and as the system is dynamically strained. We show how this evolution in molecular structure is directly linked to the observed mechanical response.
Introduction
In effectively all practical applications, the mechanical, rheological and chemical properties of polymers are modified and enhanced by the inclusion of nanoparticle (NP) fillers. The wide range of shapes, dimensions and chemistries of NPs enables various properties to be tailored, including flammability,1,2 erosion resistance,3,4 stiffness5–7 and glass transition temperature.8–10 A deeper understanding of the molecular mechanisms underlying the improved properties induced by fillers is both of scientific interest and may enable the design and development of higher performance polymer formulations that better meet the requirements of their intended use. Computer simulations provide a framework to develop such an understanding, and in this paper we focus on the mechanical response of NP-filled polymer nanocomposites.The mechanical properties of polymers without fillers have been studied with both all-atom11 and coarse-grained (CG) models.12–20 Whilst an all-atom approach is essential for understanding and predicting properties that depend on specific chemical interactions,21 it is computationally impractical for realistic models of filled polymers because of the typical volume fractions, the sizes of nanoparticle fillers (10 nm to 100 nm), and the time-scales associated with the dynamics of such complex systems. As a result, there have been many computational studies of filled polymers using different levels of coarse-graining, as highlighted in recent reviews.22–25 Since its first use by Kremer and Grest to study the dynamics of entangled linear polymer melts,26 the bead-spring model has been widely adopted in both its basic formulation and with various extensions and generalisations. This model reproduces generic behaviour in good agreement with both theoretical predictions, such as the Rouse and reptation models,26,27 and experimental measurements while having a relatively simple formulation. Bead-spring models have been extensively used to study the mechanical properties of filled polymers. For example: Raos et al.28,29 used a coarse-grained dissipative particle dynamics approach to study the viscoelastic properties of rubber filled with spherical particles at constant filler loading under oscillatory shear deformations; Shen et al.30,31 investigated the strain-induced non-linear mechanical behaviour of a polymer filled with spherical and grafted nanoparticles, showing that there exists an optimal grafting density and grafted chain length that helps to improve the dispersion of the grafted NPs; and Liu et al.32 studied the effect of filler volume fraction (FVF) and polymer–filler interaction parameters on the mechanical response of reinforced elastomers and identified the existence of an optimal FVF for mechanical reinforcement in the presence of strong polymer–filler interactions.
Despite the aforementioned work, key aspects of the relation between polymer–filler network and mechanical reinforcement remain unanswered: what is the role played by the molecular structural motifs of the polymer–filler network on reinforcement? How does the polymer–filler network evolve during the straining, and with what consequences for the mechanical reinforcement? Is the appearance of a yield drop limited to very strong polymer–filler interactions, or can it stem from structural modifications of the polymer–filler network at high filler loadings?
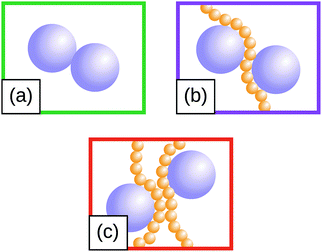
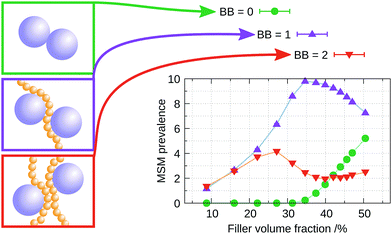
In this paper, we use molecular dynamics simulations and a coarse-grained bead-spring model to elucidate the molecular mechanism of mechanical reinforcement in nanoparticle-filled polymer nanocomposites under uniaxial strain. These simulations are all performed above the glass transition temperature. We find that the stress–strain relation undergoes qualitative changes as a function of FVF, including the appearance of a yield drop. In ref. 32, this yield drop was attributed to strong filler–polymer interactions. In contrast, we observe that a yield drop begins to appear at relatively low FVF (31%) and even when the polymer–filler interaction strength is less than half that of ref. 32. The central result of this work is that we find these and other variations in the stress–strain relations with FVF are all directly attributable to changes in the polymer–filler network, which we identify and quantify in both equilibrium configurations and dynamically during uniaxial straining. We identify three distinct local structural motifs, sketched in Fig. 1, the relative abundances of which vary systematically with FVF and strain. We show how this evolution in molecular structure is directly linked to the observed mechanical response.
Model and simulation methods
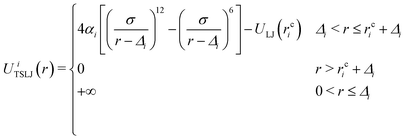
The coarse-grained model of the polymer used in this work is a development32 of the model proposed by Kremer and Grest26 to take account of filler particles. The total number of polymer chains in the system is set to 1000, each comprising 30 beads of diameter σ and mass m, unless otherwise specified. The bonds within a chain are represented by a combination of the finite extensible nonlinear elastic (FENE) potential and a Lennard-Jones (LJ) potential, as in previous studies.26,32 The analytic form of this bonded part of the potential is given by,| UB(r) = UFENE(r) + ULJ(r) | (1) |
 | (2) |
 | (3) |
We work with LJ units throughout, in which the mass m, and LJ parameters σ and ε are set to unity. All molecular dynamics simulations are performed using the Large-scale Atomic/Molecular Massively Parallel Simulator (LAMMPS) package.37 A velocity-Verlet integrator with a timestep of δt = 10−3 was used to evolve the equations of motion. The reduced temperature was set to T = 1.0 (well above the glass transition temperature for the system38) and the pressure to P = 0.0 using a Nosé–Hoover thermostat and barostat, respectively. The choice of temperature allows the system to undergo long-range co-ordinated motions and relaxations typical of a real elastomer above its glass transition, while the pressure is set to mimic the low ambient pressure.
The structures used in this investigation are created as in an earlier work,39 here we present a brief summary. First, the filler particles are randomly positioned one at a time in a large periodic box. If a filler particle overlaps with any of the previously placed ones, a new trial position is generated and tested. The dimension of the box is chosen so that, once all the components are inserted, the resulting density is equal to roughly 30% of the equilibrium density for the unfilled system, which is ρ ≈ 0.85.26 Then the chains are added one bead at a time in a self-avoiding fashion in the remaining available space. Once the first bead of a new chain is successfully placed, the next suggested bead placement is done randomly on a sphere of radius 0.96σ (minimum of UB, eqn (2)) centred on the previous bead. If the trial location does not overlap with any previously placed element, it is accepted and the neighbour lists are updated. The process is repeated until the desired number of beads per chain is reached. The whole procedure is then repeated for 1000 chains. The large initial volume of the simulation cell ensures that the process of generating the initial configuration of fillers and beads is computationally efficient and does not stagnate as a result of packing constraints. The structures then undergo an equilibration procedure comprising energy minimisation, compression, decompression, and annealing stages that is based on approaches adopted in previous studies.39–41 A detailed description is provided in the ESI,† Section 1. The minimisation and compression stages of the equilibration procedure are expected to take the structures from low to melt density.
Once these initial structures are equilibrated, cross-links are introduced between polymer chains. Bonds are added dynamically during a simulation with a constant number of particles, pressure and temperature (NPT) that automatically stops when the total number of added bonds is equal to 1000, i.e., to the set target of one cross-link per chain on average. Pairs of monomers within a distance of 1.25σ are flagged as potential cross-link sites if they do not already share a bond. If the condition is satisfied, the probability to create a cross-link bond is set to 0.03%. This choice of the probability of cross-linking avoids inserting too many new bonds at the same timestep, but it also prevents stagnation of the cross-linking procedure. Due to the stochastic nature of the cross-linking of the structures, it is important to verify that no bias is introduced among structures with different numbers of inserted nanoparticles. To this end, we computed the distribution of added bonds (i.e. cross-linking bonds) per chain for all eight structures at each filler loading. We observed no significant difference among the distributions of new bonds at different filler loadings. The full results are shown in the ESI,† Section 3. To relax the new bonds, and any structural modifications introduced, the systems are re-equilibrated following the same procedure as before. The FVF reported for each system is calculated at this stage with a 100![[thin space (1/6-em)]](https://www.rsc.org/images/entities/char_2009.gif) 000 timesteps NPT simulation (T = 1.0 and P = 0.0), where the density is recorded every 100 timesteps. Within the ensemble of structures sharing the same number of inserted filler particles, the variations in the average FVFs are very small compared to the standard deviations, and are therefore neglected. As a result, the eight structures with the same number of fillers are treated as having the same, mean FVF and used to compute ensemble averages at constant FVF throughout this work. A plot of the FVF as a function of the number of inserted filler particles can be found in the ESI,† Section 2.
000 timesteps NPT simulation (T = 1.0 and P = 0.0), where the density is recorded every 100 timesteps. Within the ensemble of structures sharing the same number of inserted filler particles, the variations in the average FVFs are very small compared to the standard deviations, and are therefore neglected. As a result, the eight structures with the same number of fillers are treated as having the same, mean FVF and used to compute ensemble averages at constant FVF throughout this work. A plot of the FVF as a function of the number of inserted filler particles can be found in the ESI,† Section 2.
The polymer–filler systems, prepared as described above, are uniaxially strained along the z-axis within the NTLzσxxσyy ensemble, in which the total number N of particles and temperature T are kept constant, and normal stresses (σxx and σyy) perpendicular to the straining direction are kept zero.42 During the straining procedure Lz, the length of the simulation box along the straining axis, is increased at a uniform strain rate  , such that
  , whilst the lateral stresses σxx and σyy are kept zero. This mimics the usual boundary conditions on an experimental tensile test at a constant strain rate. As in previous studies with similar models32,39,43,44 we apply a strain increment of 3.27% every
  timesteps; i.e. the simulation box is strained along z by 0.00327% every timestep δt. The straining is performed for a time of 100 τ, resulting in a final strain on the system of 327%. The stress along the straining direction, σzz, is given by the negative of the pressure along the z axis, Pzz. At each FVF, the reported stress at a given strain is averaged over eight independently generated systems. The width of the shading of the stress–strain curves below signifies ±1σS, where σS is the standard deviation of the calculated stresses.
Results and discussion
Stress–strain response as a function of filler loading
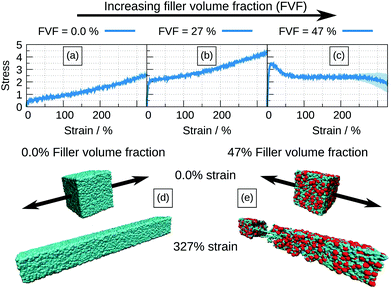
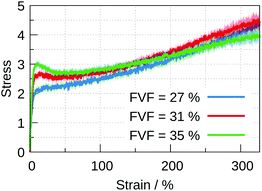
Stress–strain curves corresponding to 0.0%, 27% and 47% FVFs are shown in Fig. 2(a), (b), (c), respectively, and Fig. 2(d) and (e) show examples of structures at the beginning and end of the straining procedure for 0.0% and 47% FVF, respectively. Fig. 2(a) serves as a reference point for the mechanical effects of fillers embedded in the polymer matrix since this corresponds to the unfilled case. In the stress–strain relation at 27% FVF, Fig. 2(b), quasi-elastic (up to 5% strain) and plastic (for strains greater than 5%) regions are clearly distinguished. At 47% FVF, Fig. 2(c), there is a yield drop following the initial quasi-elastic rise, as indicated by the appearance of a peak in the stress. A yield drop has been observed in earlier work, but only in the limit of very strong polymer–filler interactions (corresponding to a value of αBead–filler = 12.0).32 At strains between 100% and 250%, the stress is almost independent of strain, in contrast to the case of 27% FVF where the stress increases with strain throughout the plastic region. At strains exceeding 250% there is the onset of necking eventually leading to fracture, as shown in Fig. 2(e). The standard deviation in the mechanical response among the eight structures at all FVFs is generally small, indicating a weak dependence of the stress–strain curve on the initial structures with the same FVF. This observation, which holds true throughout this study, gives us confidence that the number of independently-generated structures at every filler volume fraction is sufficiently representative, and the results statistically robust.For FVF up to 27%, the filled polymer is progressively strengthened by the inclusion of more particles, Fig. 3. The quasi-elastic region exhibits both a progressively higher modulus and higher peak before the onset of the plastic region (see the ESI,† Section 4, for an enlarged stress–strain plot up to 25% strain). There is no substantial change in the range of strain over which the stress–strain curve is quasi-elastic, and there is no substantial change in the slope of the plastic region. At larger FVF the stress–strain relation is merely displaced to higher stresses for the same strain. A different picture emerges with FVFs larger than 27%. In Fig. 4, the stress–strain curves for 27%, 31%, and 35% FVF are presented. At 31% FVF a yield drop appears, which is a new feature in the stress–strain relation. This yielding phenomenon appears in all the stress–strain relations with FVF larger than 31%, and becomes increasingly prominent with increasing FVF. Recalling that the strength of the polymer–filler interaction is the same at all FVFs, the presence of a threshold in the FVF before a yield drop appears suggests it is related to a change in the molecular structure of the nanocomposite at a critical FVF.
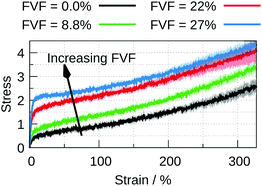 | ||
| Fig. 3 Stress–strain curves for four FVFs, corresponding to 0.0% (black), 8.8% (green), 22% (red), and 27% (blue). | ||
The smaller slope of the plastic region for 35% FVF, seen in Fig. 4, suggests the existence of an optimal FVF for mechanical reinforcement, where the peak of the quasi-elastic region is maximized before a reduction in the rate of hardening in the plastic region occurs. In this work the optimum is somewhere between 31% and 35% FVF. There are similar results reported elsewhere in the literature.32 To understand the origin of the variation of mechanical properties as a function of filler loading we investigate the molecular environments of filler particles in the next section.
Polymer–filler network at equilibrium (0% strain)
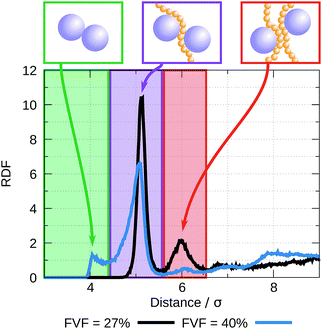
The radial distribution functions (RDF) between filler particles are calculated in all structures at all FVFs. The RDFs are computed after the structures are equilibrated, but before being strained. For each equilibrated structure, a total of 50 snapshots separated by 100δt = 0.1τ are recorded and used to compute the average RDF of a single structure. Fig. 5 shows examples of the RDF for one representative structure for the cases of 27% and 40% FVF. The distributions show peaks corresponding to three molecular structural motifs: (1) fillers in direct contact with each other, Fig. 1(a), with corresponding peak at 2RF = 4σ; (2) fillers separated by one layer of polymer beads, Fig. 1(b), with corresponding peak at 2RF + σ = 5σ; and (3) fillers separated by two layers of beads Fig. 1(c), with corresponding peak at 2RF + 2σ = 6σ. These findings are in good agreement with the classification of the dispersion state of nanoparticles by Hooper and Schweizer.45 In particular, the structural motifs found in Fig. 1(a)–(c) can be interpreted as contacts of type: (i) direct contact, (iii) segmental level tight particle bridging, and (iv) “tele-bridging”, respectively. The area under each peak is a measure of the prevalence of the corresponding molecular structural motif (or MSM), and it is calculated as in eqn (4): | (4) |
• Up to 27% FVF: the filler–filler interactions are almost entirely mediated by either one (BB = 1) or two (BB = 2) bridging polymer bead layers. As the FVF increases up to 27%, the prevalence of both BB = 1 and BB = 2 increase. A negligible fraction of filler particles are in direct contact (BB = 0) and there is no discernible peak corresponding to BB ≥ 3. Polymer beads are attracted to filler particles because the strength of their interaction is five times that of the bead–bead interaction, see Table 1.
• Between 27% and 35% FVF: BB = 2 peak falls rapidly. The relative abundance of BB = 1 continues to increase through this range of FVFs, reaching a maximum at 35% FVF, while BB = 0 starts to appear at 35% FVF.
• Above 35% FVF: BB = 0 rises and BB = 1 falls, and they almost meet at 50% FVF. BB = 2 remains approximately constant and small throughout this range.
As shown above, the network formed by the polymer chains and the filler particles at equilibrium (0% strain) varies as a function of FVF. This variation correlates qualitatively with the mechanical response for different FVFs, as determined by the stress–strain curves (Fig. 2–4). As the BB = 2 molecular structural motif falls rapidly, a peak in the stress–strain response appears. BB = 1 reaches a maximum at approximately 35% FVF, while BB = 0 remains absent but starts to appear at 35% FVF, which coincides with the observed weakening of the plastic regime. This observation indicates the mechanical response at large strains is optimised at this filler loading. In other words, as the slope of the plastic region is decreased beyond 35% FVF, for optimal reinforcement at high strains the filler loading should be lower than 35%. These observations indicate that the static picture provided by a snapshot of the organisation of the filler–polymer network at equilibrium (0% strain) determines to a large extent the nature of the dynamic stress–strain relation. However, for a more detailed understanding of the molecular mechanisms of mechanical deformation, it is necessary to study explicitly the dynamical evolution of the polymer–filler network as it undergoes strain.
Coordination changes during straining
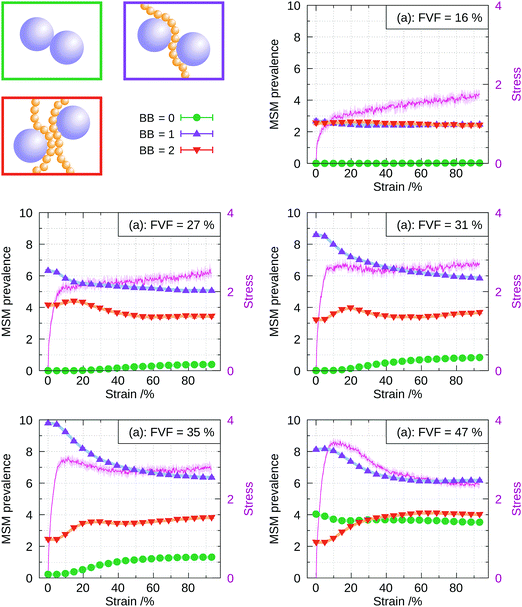
The calculation of the RDF is performed similarly to the static case, but adapted to be computed dynamically during the straining of the structures. The only difference with the static case is that the averaging at a given strain is performed on a single snapshot in eight dynamically evolving structures at that strain, rather than over 50 snapshots. This is done to capture the instantaneous distribution of polymer chains and filler particles. As in the static case, the integrals of the peaks of the RDF are averaged over eight structures from independent runs of the straining process. The larger number of beads in our model, as compared with previous work in the literature,32 results in a higher number of filler particles at a given FVF. This translates into well-converged RDFs even without averaging over multiple snapshots.‡ As a result, the instantaneous RDF, and hence the filler–polymer network structure, can be captured dynamically during the straining process. Fig. 7 shows the distribution of the molecular structural motifs in the system up to 100% strain, and for different FVFs. It is seen that at strains up to about ∼5% the prevalences of the molecular structural motifs remain approximately, but not exactly, constant. This is why we call the initial increase of stress from zero quasi-elastic: there are a few coordination changes happening, which are presumably irreversible. The principal features in the mechanical response, i.e., the appearance of a yield drop and the weakening of the plastic region observed in Fig. 4, are now discussed in the light of the dynamical evolution of the coordination motifs.Average and total filler coordination
Further insight into the molecular mechanisms behind the evolution of the stress–strain behaviour as a function of FVF can be obtained by considering the average and total coordination of filler particles by polymer beads. The evolution during straining of the average and standard deviation of the number of polymer beads coordinating a filler particle are plotted in Fig. 8 for a range of FVFs. At 8.8% and 16% FVFs the number of beads coordinating a filler particle stays approximately constant at 75. At higher FVFs the average number of beads coordinating a filler particle initially declines quite rapidly, but the rate of decrease diminishes with further strain, until it is almost constant, amounting in each FVF to a loss of approximately eight coordinating beads by 100% strain. A key change occurs between 31% and 35% FVF: the average coordination is lower in 35% FVF at zero strain and remains smaller than in 31% FVF at all subsequent strains. A lower average coordination signifies a weakened network, consistent with the declining strength of the nanocomposites with increasing strain in the plastic region observed for structures with FVF greater than 35%. This observation is also consistent with the increasing prevalence of BB = 0 for FVFs greater than 31% observed in Fig. 6. A higher number of filler particles in direct contact results in a smaller fraction of the total filler surface area available to interact with polymer beads.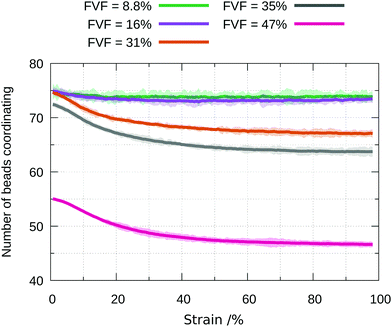 | ||
| Fig. 8 Evolution during straining of the average total number of beads coordinating filler particles in a range of FVFs. The shading indicates the standard deviation. | ||
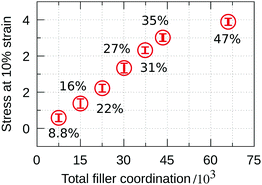
To elucidate why the highest stress attained in the quasi-elastic region continues to increase with increasing FVF, the stress at 10% strain is shown in Fig. 9 as a function of the total number of filler–polymer interactions. We see that despite the abundance of the BB = 0 molecular structural motif in the range 35% to 47% FVF, and the concomitant lower average coordination per filler particle observed in Fig. 8, the total number of polymer beads coordinating with fillers continues to increase with increasing FVF because there are more filler particles, resulting in an increasing stress at 10% strain with increasing FVF. It is also apparent that for FVFs up to 35% the maximum stress increases linearly with the total number of coordinating beads. The deviation from the linear relationship observed for 47% FVF can be correlated with the relatively high fraction of the BB = 0 MSM present at this FVF, which weakens the network.
Persistence and average coordination
Whilst answering important questions, the average and total general coordination of the fillers by the polymer beads does not elucidate the evolution of the specific polymer beads coordinating the filler particles. In this section we investigate the dynamical nature of changes in the coordination of a filler particle by polymer beads as a function of strain. We define “persistence” as the fraction of beads coordinating a filler that remains the same between snapshots of the structure taken every 0.1τ. If the persistence is equal to one then the same polymer beads are coordinating the filler particles in the two snapshots. If the persistence is equal to zero then completely different sets of polymer beads are coordinating the filler particles in the two snapshots. Since the two snapshots are 0.1τ apart, we expect the persistence to be unity or only slightly less than unity. If a bead is within RF + σ = 3σ from the centre of a filler, it is defined as coordinating. The distance of 3σ is chosen because it corresponds to the first minimum of the filler-bead RDF. Let Gin and Gin+1 be the sets containing the indices of the beads coordinating filler i at straining steps n and n + 1, respectively. Then the persistence for filler i at straining step n + 1, , is defined as follows:
 | (5) |
Fig. 10 shows the evolution of the persistence as a function of strain for each of the 1200 fillers in a representative structure with 47% FVF. The corresponding plots for the other seven 47% FVF structures can be found in the ESI,† Section 5.
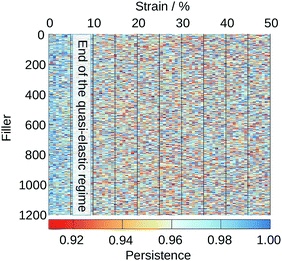 | ||
| Fig. 10 Persistence of each of the 1200 fillers in a 47% FVF structure as a function of strain. Similar plots for the other seven 47% FVF structures, are presented in the ESI† Section 5, where it is seen they display the same general features as seen in this plot. | ||
There are two important features observed in Fig. 10. First, although rare, there are regions with a persistence ∼91% at strains less than 5%. This confirms our earlier statements that in the quasi-elastic region there are fillers that undergo changes in their coordinations with polymer beads, which imply this region cannot be truly elastic, i.e., reversible. At strains greater than 5% changes in the coordination of filler particles are more frequent and are experienced by all filler particles.
Second, close inspection of Fig. 10 reveals that changes in the local coordination environments of a given filler particle do not last longer than a few straining steps. Once the local coordination of a filler is reduced, stress is transferred to other fillers that may then undergo similar transitions, while the coordination environment of the first filler is temporarily constant. And so the cycle of disrupting and conserving the coordination environment of each filler particle continues.
In Fig. 11 we show for each FVF the value of the persistence averaged over all filler particles as a function of strain. The average persistence for 8.8% and 16% FVF stays almost constant at around 97%, indicating small changes in the specific beads coordinating the fillers. The persistence at strains less than 5% increases with increasing FVF because the network is stabilised by the increasing number of the BB = 1 molecular structural motif, as seen in Fig. 6. For FVF of 31% and above, the average persistence decreases sharply in the strain range 0% to 20% and recovers somewhat at larger strains. It is interesting that the disruption of the network at strains less than 20% and its increasing stabilisation at larger strains coincides with the appearance of the yield drop.
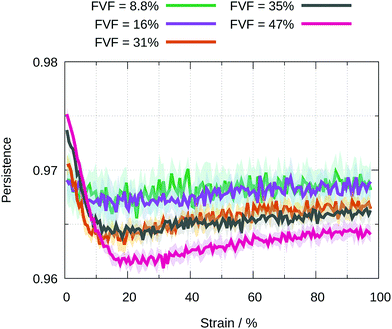 | ||
| Fig. 11 Average value of the persistence for all filler particles at a given FVF as a function of strain. The standard deviations are shown by the shading. | ||
Conclusions
In this work we have used coarse-grained molecular dynamics to simulate tensile tests of polymer nanocomposites containing spherical filler particles for a range of filler volume fractions (FVFs) from 0% to ∼50%. We have assumed the interaction between polymer beads and filler particles is five times stronger than that between polymer beads to model nanocomposites where the surfaces of filler particles have been modified to enhance adhesion to the polymer.At all finite FVFs we find the stress–strain relation comprises an initial quasi-elastic region, characterised by a steep slope, followed by a plastic region where the slope is significantly smaller. There is not a sharp transition between these two regions but in all cases the extent of the quasi-elastic region is no more than the first 10% of strain. As seen in Fig. 7 the maximum stress reached in the quasi-elastic region increases with increasing FVF. This is a result of the monotonic increase of the total number of interactions between polymer beads and filler particles with increasing FVF, shown in Fig. 9. The term quasi-elastic is used because there are changes in the coordination environments of fillers at strains up to 10% (Fig. 10). These changes are infrequent compared to those taking place in the plastic region, but their existence indicates a small but finite degree of irreversibility and hence plasticity.
In the plastic region there is no yield drop for FVFs up to 27%. The slope of the stress–strain relation remains positive (Fig. 3). At 31% FVF a yield drop appears which becomes more pronounced with increasing FVF. At 35% FVF the slope of the stress–strain curve in the plastic region begins to decrease with increasing FVF, becoming negative at all strains in the plastic region at 47% FVF (Fig. 7). We attribute both the yield drop and the weakening of the plastic region to the decline in the population of adjacent fillers mediated by one polymer layer (BB = 1), and the growth in the population of adjacent fillers with no (BB = 0) or two intervening polymer layers (BB = 2) (Fig. 7). All these changes reduce the constraints on the polymer network. As seen in Fig. 11, the appearance of the yield drop also coincides with a marked disruption of the network of polymer molecules attached to filler particles at strains up to ∼20%, followed by a gradual stabilisation of the network at higher strains.
This study has highlighted the crucial role of the dispersion of filler particles in the polymer matrix which directly affects the relative populations of the molecular structural motifs (BB = 0, 1, 2) of filler particles, and which in turn determine the mechanical properties of the nanocomposite. Whilst it is widely accepted that higher surface-to-volume ratio of the filler particles, for a given FVF, improves the mechanical properties of polymer nanocomposites,46–48 the influence of the shape of the filler particles on the structural motifs is less obvious, and it requires further research.
Conflicts of interest
There are no conflicts of interest to declare.Acknowledgements
The authors acknowledge support from the Thomas Young Centre under grant TYC-101; NM was supported through a studentship in the Centre for Doctoral Training on Theory and Simulation of Materials at Imperial College London, funded by EPSRC under Grant No. EP/G036888/1 and by Baker Hughes GE. Thanks to David Curry, John Stevens, Jimmy Eason and Helmut Benning from Baker Hughes GE, to Imperial College High Performance Computing Service (DOI: 10.14469/hpc/2232), and to the UK's HEC Materials Chemistry Consortium, which is funded by EPSRC (EP/L000202), this work used the ARCHER UK National Supercomputing Service (http://www.archer.ac.uk).References
- F. Laoutid, L. Bonnaud, M. Alexandre, J. M. Lopez-Cuesta and P. Dubois, New prospects in flame retardant polymer materials: From fundamentals to nanocomposites, Mater. Sci. Eng., R, 2009, 63, 100–125, DOI:10.1016/j.mser.2008.09.002.
- D. Porter, E. Metcalfe and M. J. K. Thomas, Nanocomposite fire retardants – a review, Fire Mater., 2000, 24, 45–52, DOI:10.1002/(SICI)1099-1018(200001/02)24:1<45::AID-FAM719>3.0.CO;2-S.
- J. M. Yeh, C. P. Chin and S. Chang, Enhanced corrosion protection coatings prepared from soluble electronically conductive polypyrrole-clay nanocomposite materials, J. Appl. Polym. Sci., 2003, 88, 3264–3272, DOI:10.1002/app.12146.
- J.-M. Yeh, C.-L. Chen, Y.-C. Chen, C.-Y. Ma, K.-R. Lee, Y. Wei and S. Li, Enhancement of corrosion protection effect of poly(o-ethoxyaniline) via the formation of poly(o-ethoxyaniline)–clay nanocomposite materials, Polymer, 2002, 43, 2729–2736, DOI:10.1016/S0032-3861(02)00005-8.
- S. Boutaleb, F. Zaïri, A. Mesbah, M. Naït-Abdelaziz, J. M. Gloaguen, T. Boukharouba and J. M. Lefebvre, Micromechanics-based modelling of stiffness and yield stress for silica/polymer nanocomposites, Int. J. Solids Struct., 2009, 46, 1716–1726, DOI:10.1016/j.ijsolstr.2008.12.011.
- P. Podsiadlo, A. K. Kaushik, E. M. Arruda, A. M. Waas, B. S. Shim, J. Xu, H. Nandivada, B. G. Pumplin, J. Lahann, A. Ramamoorthy and N. A. Kotov, Ultrastrong and Stiff Layered Polymer Nanocomposites, Science, 2007, 318, 1–4, DOI:10.1126/science.114317.
- J. R. Potts, D. R. Dreyer, C. W. Bielawski and R. S. Ruoff, Graphene based polymer nanocomposites, Polymer, 2011, 52, 5–25, DOI:10.1016/j.polymer.2010.11.042.
- B. J. Ash, L. S. Schadler and R. W. Siegel, Glass transition behavior of alumina/polymethylmethacrylate nanocomposites, Mater. Lett., 2002, 55, 83–87, DOI:10.1016/S0167-577X(01)00626-7.
- D. Fragiadakis, P. Pissis and L. Bokobza, Glass transition and molecular dynamics in poly(dimethylsiloxane)/silica nanocomposites, Polymer, 2005, 46, 6001–6008, DOI:10.1016/j.polymer.2005.05.080.
- P. Rittigstein, R. D. Priestley, L. J. Broadbelt and J. M. Torkelson, Model polymer nanocomposites provide an understanding of confinement effects in real nanocomposites, Nat. Mater., 2007, 6, 278–282, DOI:10.1038/nmat1870.
- B. Vorselaars, A. V. Lyulin and M. A. J. Michels, Deforming glassy polystyrene: Influence of pressure, thermal history, and deformation mode on yielding and hardening, J. Chem. Phys., 2009, 130, 074905, DOI:10.1063/1.3077859.
- L. Huang, X. Yang, X. Jia and D. Cao, Fracture mechanism of amorphous polymers at strain fields, Phys. Chem. Chem. Phys., 2014, 16, 24892–24898, 10.1039/c4cp03120b.
- J. Li, T. Mulder, B. Vorselaars, A. V. Lyulin and M. A. J. Michels, Monte Carlo simulation of uniaxial tension of an amorphous polyethylene-like polymer glass, Macromolecules, 2006, 39, 7774–7782, DOI:10.1021/ma061042w.
- D. Hossain, M. Tschopp, D. Ward, J. Bouvard, P. Wang and M. Horstemeyer, Molecular dynamics simulations of deformation mechanisms of amorphous polyethylene, Polymer, 2010, 51, 6071–6083, DOI:10.1016/j.polymer.2010.10.009.
- S. Lee and G. C. Rutledge, Plastic deformation of semicrystalline polyethylene by molecular simulation, Macromolecules, 2011, 44, 3096–3108, DOI:10.1021/ma1026115.
- R. S. Hoy and M. O. Robbins, Strain hardening in polymer glasses: Limitations of network models, Phys. Rev. Lett., 2007, 99, 1–4, DOI:10.1103/PhysRevLett.99.117801.
- R. S. Hoy and M. O. Robbins, Strain hardening of polymer glasses: Entanglements, energetics, and plasticity, Phys. Rev. E: Stat., Nonlinear, Soft Matter Phys., 2008, 77, 1–14, DOI:10.1103/PhysRevE.77.031801.
- R. S. Hoy and M. O. Robbins, Strain hardening in bidisperse polymer glasses: Separating the roles of chain orientation and interchain entanglement, J. Chem. Phys., 2010, 131, 244901, DOI:10.1063/1.3276800.
- R. S. Hoy and C. S. O'hern, Viscoplasticity and large-scale chain relaxation in glassypolymeric strain hardening, Phys. Rev. E: Stat., Nonlinear, Soft Matter Phys., 2010, 82, 1–10, DOI:10.1103/PhysRevE.82.041803.
- K. Nayak, D. J. Read, T. C. B. McLeish, P. J. Hine and M. Tassieri, A coarse-grained molecular model of strain-hardening for polymers in the marginally glassy state, J. Polym. Sci., Part B: Polym. Phys., 2011, 49, 920–938, DOI:10.1002/polb.22263.
- M. Khawaja, A. Sutton and A. Mostofi, Molecular Simulation of Gas Solubility in Nitrile Butadiene Rubber, J. Phys. Chem. B, 2016, 121, 287–297 CrossRef PubMed.
- G. Allegra, G. Raos and M. Vacatello, Theories and simulations of polymer-based nanocomposites: From chain statistics to reinforcement, Prog. Polym. Sci., 2008, 33, 683–731, DOI:10.1016/j.progpolymsci.2008.02.003.
- J. Liu, L. Zhang, D. Cao, J. Shen and Y. Gao, Computational Simulation of Elastomer Nanocomposites: Current Progress and Future Challenges, Rubber Chem. Technol., 2012, 85, 450–481, DOI:10.5254/rct.12.87966.
- V. Ganesan and A. Jayaraman, Theory and simulation studies of effective interactions, phase behavior and morphology in polymer nanocomposites, Soft Matter, 2014, 10, 13–38, 10.1039/c3sm51864g.
- A. Karatrantos, N. Clarke and M. Kröger, Modeling of Polymer Structure and Conformations in Polymer Nanocomposites from Atomistic to Mesoscale: A Review, Polym. Rev., 2016, 3724, 1–44, DOI:10.1080/15583724.2015.1090450.
- K. Kremer and G. S. Grest, Dynamics of entangled linear polymer melts: A moleculardynamics simulation, J. Chem. Phys., 1990, 92, 5057, DOI:10.1063/1.458541.
- J. T. Kalathi, S. K. Kumar, M. Rubinstein and G. S. Grest, Rouse mode analysis of chain relaxation in homopolymer melts, Macromolecules, 2014, 47, 6925–6931 CrossRef PubMed.
- G. Raos, M. Moreno and S. Elli, Computational experiments on filled rubber viscoelasticity: What is the role of particle-particle interactions?, Macromolecules, 2006, 39, 6744–6751, DOI:10.1021/ma061008h.
- G. Raos and M. Casalegno, Nonequilibrium simulations of filled polymer networks: Searching for the origins of reinforcement and nonlinearity, J. Chem. Phys., 2011, 134, 054902, DOI:10.1063/1.3537971.
- J. Shen, J. Liu, Y. Gao, X. Li and L. Zhang, Elucidating and tuning the strain-induced non-linear behavior of polymer nanocomposites: a detailed molecular dynamics simulation study, Soft Matter, 2014, 10, 5099–5113, 10.1039/c4sm00233d.
- J. Shen, J. Liu, H. Li, Y. Gao, X. Li, Y. Wu and L. Zhang, Molecular dynamics simulations of the structural, mechanical and visco-elastic properties of polymer nanocomposites filled with grafted nanoparticles, Phys. Chem. Chem. Phys., 2015, 17, 7196–7207, 10.1039/c4cp05520a.
- J. Liu, S. Wu, L. Zhang, W. Wang and D. Cao, Molecular dynamics simulation for insight into microscopic mechanism of polymer reinforcement, Phys. Chem. Chem. Phys., 2011, 13, 518–529, 10.1039/c0cp00297f.
- G. S. Grest and K. Kremer, Molecular dynamics simulation for polymers in the presence of a heat bath, Phys. Rev. A: At., Mol., Opt. Phys., 1986, 33, 3628–3631, DOI:10.1103/PhysRevA.33.3628.
- J. Liu, D. Cao and L. Zhang, Molecular dynamics study on nanoparticle diffusion in polymer melts: a test of the Stokes-Einstein law, J. Phys. Chem. C, 2008, 112, 6653–6661 CrossRef.
- J. S. Smith, D. Bedrov and G. D. Smith, A molecular dynamics simulation study of nanoparticle interactions in a model polymer-nanoparticle composite, Compos. Sci. Technol., 2003, 63, 1599–1605 CrossRef.
- J. D. Weeks, D. Chandler and H. C. Andersen, Role of repulsive forces in determining the equilibrium structure of simple liquids, J. Chem. Phys., 1971, 54, 5237–5247 CrossRef.
- S. Plimpton, Fast Parallel Algorithms for Short-Range Molecular Dynamics, 1995, http://www.sciencedirect.com/science/article/pii/S002199918571039X.
- J. Liu, S. Wu, D. Cao and L. Zhang, Effects of pressure on structure and dynamics of model elastomers: a molecular dynamics study, J. Chem. Phys., 2008, 129, 154905, DOI:10.1063/1.2996009.
- N. Molinari and S. Angioletti-Uberti, Nanoparticle Organization Controls Their Potency as Universal Glues for Gels, Nano Lett., 2018, 18, 3530–3537 CrossRef PubMed.
- E. Kucukpinar and P. Doruker, Molecular simulations of gas transport in nitrile rubber and styrene butadiene rubber, Polymer, 2006, 47, 7835–7845, DOI:10.1016/j.polymer.2006.08.062.
- N. Molinari, M. Khawaja, A. P. Sutton and A. A. Mostofi, Molecular Model for HNBR With Tunable Cross-Link Density, J. Phys. Chem. B, 2016, 120, 12700–12707, DOI:10.1021/acs.jpcb.6b07841.
- L. Yang, D. J. Srolovitz and A. F. Yee, Extended ensemble molecular dynamics method for constant strain rate uniaxial deformation of polymer systems, J. Chem. Phys., 1997, 107, 4396, DOI:10.1063/1.474781.
- J. Gao and J. H. Weiner, Simulated polymer melt stress relaxation. II. Search for entanglements, J. Chem. Phys., 1995, 103, 1621, DOI:10.1063/1.469733.
- J. Liu, J. Shen, Y. Gao, H. Zhou, Y. Wu and L. Zhang, Detailed simulation of the role of functionalized polymer chains on the structural, dynamic and mechanical properties of polymer nanocomposites, Soft Matter, 2014, 10, 8971–8984, 10.1039/C4SM02005G.
- J. B. Hooper and K. S. Schweizer, Contact aggregation, bridging, and steric stabilization in dense polymer-particle mixtures, Macromolecules, 2005, 38, 8858–8869 CrossRef.
- A. Adnan, C. Sun and H. Mahfuz, A molecular dynamics simulation study to investigate the effect of filler size on elastic properties of polymer nanocomposites, Compos. Sci. Technol., 2007, 67, 348–356 CrossRef.
- A. J. Crosby and J.-Y. Lee, Polymer nanocomposites: the “Nano” effect on mechanical properties, Polym. Rev., 2007, 47, 217–229 CrossRef.
- H. Alter, Filler particle size and mechanical properties of polymers, J. Appl. Polym. Sci., 1965, 9, 1525–1531 CrossRef.
Footnotes |
| † Electronic supplementary information (ESI) available: Details on the equilibration procedure, filler volume fraction as a function of the number of inserted filler particles, distributions of new bonds per chain inserted by the cross-linking procedure at different filler loadings, reinforcement at low strain, and additional persistence maps. See DOI: 10.1039/c8cp03281e |
| ‡ With the only exception being the lowest FVF (8.8%, 100 filler particles). |
| This journal is © the Owner Societies 2018 |

