 Open Access Article
Creative Commons Attribution 3.0 Unported Licence
Quantifying structure dependent responses in Li-ion cells with excess Li spinel cathodes: matching voltage and entropy profiles through mean field models†
Steffen
Schlueter
a,
Ronny
Genieser
 b,
Daniel
Richards
 c,
Harry E.
Hoster
ade and
Michael P.
Mercer
 *ade
*ade
aDepartment of Chemistry, Lancaster University, Bailrigg, Lancaster, LA1 4YB, UK. E-mail: m.mercer1@lancaster.ac.uk
bWMG Electrochemical Engineering Group, University of Warwick, Coventry, CV4 7AL, UK
cImagination Lancaster, Lancaster University, Bailrigg, Lancaster, LA1 4YW, UK
dALISTORE European Research Institute CNRS FR 3104, Hub de l’Energie, Rue Baudelocque, 80039 Amiens, France
eThe Faraday Institution, Quad One, Harwell Science and Innovation Campus, Didcot, OX11 0RA, UK
First published on 25th July 2018
Abstract
Measurements of the open circuit voltage of Li-ion cells have been extensively used as a non-destructive characterisation tool. Another technique based on entropy change measurements has also been applied for this purpose. More recently, both techniques have been used to make qualitative statements about aging in Li-ion cells. One proposed cause of cell failure is point defect formation in the electrode materials. The steps in voltage profiles, and the peaks in entropy profiles are sensitive to order/disorder transitions arising from Li/vacancy configurations, which are affected by the host lattice structures. We compare the entropy change results, voltage profiles and incremental capacity (dQ/dV) obtained from coin cells with spinel lithium manganese oxide (LMO) cathodes, Li1+yMn2−yO4, where excess Li y was added in the range 0 ≤ y ≤ 0.2. A clear trend of entropy and dQ/dV peak amplitude decrease with excess Li amount was determined. The effect arises, in part, from the presence of pinned Li sites, which disturb the formation of the ordered phase. We modelled the voltage, dQ/dV and entropy results as a function of the interaction parameters and the excess Li amount, using a mean field approach. For a given pinning population, we demonstrated that the asymmetries observed in the dQ/dV peaks can be modelled by a single linear correction term. To replicate the observed peak separations, widths and magnitudes, we had to account for variation in the energy interaction parameters as a function of the excess Li amount, y. All Li–Li repulsion parameters in the model increased in value as the defect fraction, y, increased. Our paper shows how far a computational mean field approximation can replicate experimentally observed voltage, incremental capacity and entropy profiles in the presence of phase transitions.
1 Introduction
The growing demand for rechargeable batteries in electric vehicles and for stationary storage not only requires higher energy and power density, but also improved durability and safety.1–5 One source of performance fade or failure in Li-ion cells is structural change in the electrode materials during cell operation.6 A range of in situ methods have been developed and many of these have been applied to diagnose real-time changes in electrode structure from either thermal (calendar) aging or during prolonged charge/discharge cycling.7–10 Additionally, there is a need for rapid validation of the electrochemical characteristics and quality of Li-ion cells from different suppliers. Improved quantification, ideally at the level of atomistic structure–property relationships, is needed to interpret existing in situ characterisation tools.One class of promising techniques is based on thermodynamic measurements, a particular example of which is entropy profiling (EP).10–28 This technique is based on the principle that the partial molar entropy change is proportional to the temperature response of the open circuit voltage (OCV) of a cell, by
 | (1) |
Thompson et al. performed the first EP study on LixTiS2 electrodes.12 Selman et al. performed electrochemical-calorimetric measurements on LixMn2O413 and commercial Li-ion cells.14 Reynier et al. investigated the entropy change upon intercalation into graphite and disordered carbons.15,16 The entropy change during Li intercalation in graphite was recently investigated theoretically by Leiva et al.30–32 Later work also investigated the entropy change in cathode materials, including LixCoO2,10,17–19 Lix+yMn2−yO4 spinel,20–23 where y represents an excess amount of Li substituted in the 16d octahedral sites, LixMyMn2−yO4,20,24,25 where M denotes a metal defect, nickel manganese cobalt (NMC) based layered materials26 and olivine LixFePO4.27,28 Furthermore, Maher et al.,10,33 Osswald et al.26 and Hudak et al.18 examined the effect of prolonged charge/discharge cycles and calendar aging on the measured entropy profiles. They observed changes in the magnitudes of the peaks in profiles that were attributed to separate structural changes at the anode and cathode. A more comprehensive overview of entropy change measurements is available in a recent review by Zhang et al.11
Spinel lithium manganese oxide (LMO) electrodes are an attractive, low cost and non-toxic alternative to the many layered cathode structures currently used in commercial Li-ion cells. Entropy profiles of the stoichiometric compound, LixMn2O4 (0 ≤ x ≤ 1), show two well defined peaks. The peaks arise from the formation of an ordered phase, Li0.5Mn2O4 at intermediate state of charge, and a transition to a disordered solid solution phase either side.29,34–38 To better understand voltage and entropy profiles and enable more definitive structural assessments from them, we developed a Monte Carlo based model to quantify the changes in the EP peak amplitudes dependent on the proportion of point defects in LixMyMn2−yO4 spinel (M = Co, Cr).37 We showed that the experimental trends could be explained by pinned Li sites, required for charge balance, which occur in proportion to the defect fraction, y. More pinned Li sites imply that the ordered phase becomes progressively disrupted, resulting in a reduction in the EP and dQ/dV peak amplitudes.
To date, the information obtained from entropy profiling has been largely qualitative. Two approaches, which have already been applied to open circuit voltage (OCV) profiles36,39–44 could be considered to also understand entropy profiles at a more quantitative level. On the one hand, ab initio approaches based on effective cluster interactions (ECIs) could be applied within a density functional theory (DFT) framework.36,39,40 Although computationally complex and computer time intensive, these methods rely on minimal input parameters from experiments. On the other hand, parametric models can be directly fitted to experimental OCV profiles.41–44 Although allowing rapid agreement between the models and experiment, the physical interpretation of the various parameters within the models, particularly the ones related to Li–Li interactions, is often unclear. Without an understanding of these parameters, it can be difficult to interpret the models when the cell chemistry is continuously changing, such as during cell aging.
The present work strives to gain an atomistic interpretation of OCV and entropy profiles while at the same time modelling experimental profiles with high throughput and accuracy. We focus on systematically varied cathode compositions, Li1+yMn2−yO4, in which a proportion, y, of Mn on the 16d sites is substituted by Li. To demonstrate the value of EP, we performed EP alongside standard voltage and dQ/dV characterisation, in coin cells with LMO cathodes prepared with excess Li values, y (0 ≤ y ≤ 0.2). This work sheds new light on the microscopic origins of the peaks observed in dQ/dV and EP, explaining how and why their amplitudes and positions change.
2 Methods
2.1 Synthesis of Li1+yMn2−yO4
All samples were prepared by a solid state reaction of LiMn2O4 (Alfa Aesar) and Li2CO3 (Sigma Aldrich). The LiMn2O4 powder was thoroughly mixed with the proportional amount of Li2CO3 in order to obtain the desired stoichiometry of Li1+yMn2−yO4. The mixture was heated up in a tube furnace to 600 °C for 18 h in air with a heating and cooling rate of 7 °C min−1. Table 1 gives an overview of the synthesis conditions, the nominal amount of lithium from the synthesis and the lattice constants a of the samples, determined by X-ray diffraction (XRD) measurements.| Sample | Temperature (°C) | Excess Li, y | a (Å) |
|---|---|---|---|
| Li1.00Mn2.00O4 | — | 0.00 | 8.2421(5) |
| Li1.05Mn1.95O4 | 600 | 0.05 | 8.2319(0) |
| Li1.10Mn1.90O4 | 600 | 0.10 | 8.2245(0) |
| Li1.15Mn1.85O4 | 600 | 0.15 | 8.2144(0) |
| Li1.20Mn1.80O4 | 600 | 0.20 | 8.2063(5) |
Diffraction data was collected on a Rigaku Smartlab 9 kW using Cu Kα radiation (λ = 1.54 Å) over a 2θ range of 15–90° in Bragg–Brentano geometry with a step size of 0.01°. The lattice parameters were determined from the XRD pattern using the Rigaku PDXL 2, based on the crystal structure reported by Berg et al. (ICSD 50415).45
2.2 Electrochemical characterisation
For electrochemical testing, the different active materials were mixed with Super P (Alfa Aesar) as a conductive carbon and Solef PVDF (Solvay) as a binder in a ratio of 8![[thin space (1/6-em)]](https://www.rsc.org/images/entities/char_2009.gif) :
:![[thin space (1/6-em)]](https://www.rsc.org/images/entities/char_2009.gif) 1
1![[thin space (1/6-em)]](https://www.rsc.org/images/entities/char_2009.gif) :
:![[thin space (1/6-em)]](https://www.rsc.org/images/entities/char_2009.gif) 1. The resulting slurries, made with NMP (Sigma Aldrich), were coated on a 20 μm aluminium current collector and initially dried on a hot plate at 70 °C, then stored overnight at 50 °C under vacuum. Coin cells were assembled in a dry room using a Celgard 2325 separator, 150 μm Li foil (PI-KEM) and LP57 electrolyte: 1 M LiPF6 in EC/DMC (3
1. The resulting slurries, made with NMP (Sigma Aldrich), were coated on a 20 μm aluminium current collector and initially dried on a hot plate at 70 °C, then stored overnight at 50 °C under vacuum. Coin cells were assembled in a dry room using a Celgard 2325 separator, 150 μm Li foil (PI-KEM) and LP57 electrolyte: 1 M LiPF6 in EC/DMC (3![[thin space (1/6-em)]](https://www.rsc.org/images/entities/char_2009.gif) :
:![[thin space (1/6-em)]](https://www.rsc.org/images/entities/char_2009.gif) 7 vol%, BASF). A BaSyTec CTS cycler was used for the electrochemical and entropy characterisation. Two full galvanostatic cycles were performed on the half cells, each cycle comprising a galvanostatic charge starting from rest at 10 mA g−1 to a maximum voltage of 4.3 V vs. Li/Li+. To ensure that the cell had reached its maximum state of charge, the cell was held at a constant voltage of 4.3 V for one hour. The cell was then galvanostatically discharged between 4.3 and 3.4 V at 10 mA g−1, thus ending one cycle.
7 vol%, BASF). A BaSyTec CTS cycler was used for the electrochemical and entropy characterisation. Two full galvanostatic cycles were performed on the half cells, each cycle comprising a galvanostatic charge starting from rest at 10 mA g−1 to a maximum voltage of 4.3 V vs. Li/Li+. To ensure that the cell had reached its maximum state of charge, the cell was held at a constant voltage of 4.3 V for one hour. The cell was then galvanostatically discharged between 4.3 and 3.4 V at 10 mA g−1, thus ending one cycle.
Voltage profiles were recorded at a high data acquisition rate of one data point per second. The dQ/dV curves were obtained firstly by numerical differentiation of the voltage curves from the second galvanostatic cycle, with charge and discharge being treated separately. The curves were then smoothed over 200 data points.
2.3 Entropy measurements
A custom made direct cooling and heating setup was used to change the temperature of the coin cells. The system consisted of an aluminum heat exchanger, in direct thermal contact with the coin cells, which is connected to a Julabo F12 refrigerated – heating circulator, allowing precise control over the temperature. The temperature was monitored by type-J thermocouples connected in multiple positions to the aluminium heat exchangers, which verified that temperature variation across the exchanger was negligible. For high resolution voltage and temperature acquisition a Keysight 34970A data logger was used. Entropy profiles were performed after fully charging the cells at 10 mA g−1 (with respect to the active mass of cathode material) to 4.3 V followed by a constant voltage step at 4.3 V for 2 hours.To ensure all entropy measurements gave information comparable to the charge/discharge cycles, entropy measurements were performed immediately after two charge/discharge cycles as described in Section 2.2. After the second discharge, the cell was charged up to 4.4 V and held at constant voltage for two hours. This constant voltage step ensured that the cell was at maximum state of charge prior to commencing entropy profiling. To perform a full entropy profile, the cells were discharged stepwise with a current rate of 10 mA g−1 for 15 min, followed by voltage relaxation under open circuit (OC) conditions for 15 min. Both steps were performed at a temperature of 20 °C. Remaining under OC conditions, the temperature was then changed in 3 °C steps from 20 to 14 °C, each with a relaxation time of 15 min. Each iteration, shown in Table 2, was repeated 50 times or until the cell voltage was less than 3.8 V. To minimize the possible effects of self-discharge and to ensure that these rapid measurements were accurate we used our previously developed open circuit voltage (OCV) fitting and drift subtraction algorithms, described in detail by Osswald et al.26
| Step | Time (min) | Temperature (°C) |
|---|---|---|
| Discharge (10 mA h g−1) | 15 | 20 |
| Voltage relaxation (OC) | 15 | 20 |
| Temperature step 1 (OC) | 15 | 17 |
| Temperature step 2 (OC) | 15 | 14 |
| Temperature step 3 (OC) | 15 | 20 |
| Total time per step | 75 | |
The variable of interest, ΔSconf, the configurational entropy of Li/vacancy arrangements is measured by EP. However, there are also vibrational and electronic contributions, ΔSvib and ΔSelec, from the Li metal anode and the cathode,17 so that the total ΔS obtained through EP is
| ΔS = ΔSconf + ΔSvib + ΔSelec. | (2) |
The metallic Li anode can be considered as an infinite Li reservoir, with no lattice rearrangements possible during (de)intercalation. Hence, it can be considered to have a configurational entropy of zero17 and is expected to contribute negligibly to the entropy profiles compared with the configurational entropy change of the cathode. In the entropy profiles of LixCoO2, ΔSelec was shown to be negligible and this is likely to be true for all semiconducting transition metal oxides.17 According to Fultz et al.17 ΔSvib can be treated as a constant background contribution across the intercalation range. We adopted this approximation in our numerical optimisation procedures, as described in Section 2.5.
2.4 Statistical mechanical model
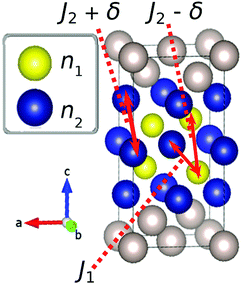
Our modelling approach is based on the one adopted by Leiva et al. who applied the model to graphite.31,32 The calculations were performed within the canonical ensemble, under the Bragg–Williams approximation.For the spinel lattice LixMn2O4, (0 ≤ x ≤ 1), the Li atoms adopt a diamond lattice structure, which can be reduced to two laterally separated face centred cubic sublattices, as shown previously.29,34,46 We considered a lattice of 2M sites, where M is the number of sites on each sublattice. A total of M = 100 was found to be fully converged with respect to the system size and this value was used in all simulations. Given two fractional sublattice occupancies n1 and n2, such that 0 ≤ n1,n2 ≤ 1, the overall fraction of Li on the 8a sites, x, is given by
 | (3) |
The total number of occupied sites, N, is N = 2Mx. The assumption of the Bragg–Williams approximation is that all Li/vacancy configurations for a particular set of values n1 and n2 are degenerate, where the number of degenerate energy levels is Ωj for a state j. In practice, for a given x value, the calculation is performed by enumerating through all possible values of n1 and n2, assuming the energy expression is not affected by the local arrangement of Li atoms. Under the assumption that the different configurations for fixed n1 and n2 are degenerate, we can write the Hamiltonian, H(N,M) which describes the energy of the entire system, as
| H(N,M) = 〈ε1〉〈N1〉 + 〈ε2〉〈N2〉, | (4) |
〈ε1〉 and 〈ε2〉, the average energies per site associated with each of the sublattices, are given by
 | (5) |
 | (6) |
We can define the partition function, as shown by Leiva et al.31
 | (7) |
Ω j can be determined as using the expressions shown elsewhere,31i.e. for N < M
 | (8) |
 | (9) |
We used the Stirling approximation,  on the terms Ωj.
As for the energy terms, Ej, these can be determined by
 | (10) |
We can write modified forms of eqn (5) and (6), but now in terms of the index, j
| ε1 = −ε0 + 2J1n2 + 6(J2 + δ)n1, | (11) |
| ε2 = −ε0 + 2J1n1 + 6(J2 − δ)n2, | (12) |
From the partition function, eqn (7), the chemical potential, μ, can be determined as
 | (13) |
Eqn (5) and (6) are very similar to the ones applied previously to LixMn2O4 and graphite. A new development is the introduction of the term δ. This was motivated by previous experimental dQ/dV studies,34,48 along with our own results, which indicated two different peak amplitudes for LixMn2O4. With pairwise interactions, this asymmetry cannot be explained with the usual assumption of δ = 0, because in this instance the interactions are symmetric with respect to particles and vacancies.
To describe the effect of excess Li in Lix+yMn2−yO4, where y is the amount of Li placed on the 16d sites, we assumed a total of 3y 8a sites were pinned to the lattice in random positions, as proposed and modelled by Gao et al.34 The Li occupations on the 8a sites can then be expressed as
| n1 = z1(1 − 3y) + 3y, | (14) |
| n2 = z2(1 − 3y) + 3y, | (15) |
2.5 Numerical optimisation
To fit experimental and simulated data, the Nelder–Mead simplex optimisation method was used.49 This was implemented using the “minimize” function from the Scipy library of Python. In particular, to ensure reliability of the parameters, dQ/dV and entropy profiles were fitted simultaneously, so that the overall objective function of the minimization, f(θ), was given by | (16) |
 | (17) |
 | (18) |
![[Q with combining circumflex]](https://www.rsc.org/images/entities/i_char_0051_0302.gif) i′(θ) and Ŝi′(θ) are the corresponding simulated data and θ, the arguments of the minimisation, were given by
i′(θ) and Ŝi′(θ) are the corresponding simulated data and θ, the arguments of the minimisation, were given by| θ = [ε0J1J2δΔSvib] | (19) |
To ensure reliability of the optimisation method it was found to be critical to determine a suitable initial trial value for the simplex optimisation. This was achieved by starting with a brute force grid search. The grid was a 5-dimensional array with uniformly spaced points, whose limits were successively reduced in size between successive grids. This was achieved by determining the value of f(θ) from the previous grid, and using the input arguments θ to determine the limits of the new grid. The starting values of the simplex search are specified in Table 3, where θ0min, θ0max, θ0int were the maximum value, minimum value, and grid interval for each respective parameter of iteration 1, respectively. The grid was dynamically updated, using the optimal solution from the previous search to determine the next grid. The corresponding values of θimin, θimax, θiint (first iteration i = 0) were determined by
| θimin = (f(θ)i−1 + θi−1min)/2 | (20) |
| θimax = (f(θ)i−1 + θi−1max)/2 | (21) |
| θiint = (θimax − θimin)/6 | (22) |
| θ | θ 0min | θ 0max | θ 0int |
|---|---|---|---|
| ε 0 | 4.090 | 4.350 | 0.032 |
| J 1 | 25.0 | 75.0 | 5.0 |
| J 2 | −2.0 | 17.0 | 1.5 |
| δ | 1.0 | 8.0 | 1.0 |
| ΔSvib | −10.0 | −2.0 | 2.0 |
6 successive grids were applied (up to and including i = 5) and the arguments θ corresponding to the smallest objective value obtained from all 6 grids was used to initialise the simplex search. It was found that this procedure was the only way to guarantee reliable fitting when the excess Li content, y, was greater than 0.10.
To avoid a fitting bias towards the end points of the state of charge, for both fQ′(θ) and fS′(θ) the fit was constrained to data points in the range 3.95 V ≤ V ≤ 4.15 V, where V is the voltage. Output from the fitting process is presented in the ESI,† Fig. S1.
3 Results
3.1 X-ray diffraction
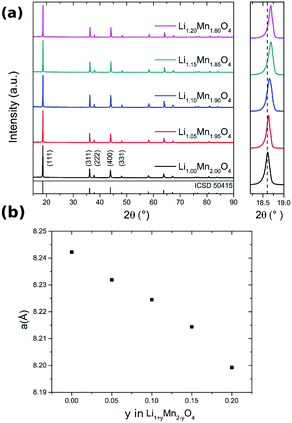
The XRD pattern of Li1+yMn2−yO4 with different values of y are shown in Fig. 2a. On the right hand side, the (111) peak is highlighted over a narrower Bragg angle range. With higher lithium content the reflections shift to higher 2θ values compared to those of stoichiometric LiMn2O4. The enlarged XRD pattern highlights this shift and as result the lattice parameters of the Fd![[3 with combining macron]](https://www.rsc.org/images/entities/char_0033_0304.gif) m unit cell decrease with increasing excess Li. The decrease of the lattice parameter a follows an approximately linear relationship with the nominal amount y in Li1+yMn2−yO4 in the investigated range (Fig. 2b), in good agreement with reported results.50,51 The theoretical average oxidation state of manganese increases from 3.50 (y = 0) to 3.78 (y = 0.20), also shown in Table 4, i.e. the proportion of Mn3+ decreases with y. The ionic radii of Mn3+ and of Mn4+ are, respectively, 0.65 Å and 0.53 Å.52 By substituting Mn3+ with Li+ ions the proportion of the larger Mn3+ ions decreases, resulting in a concomitant decrease in unit cell size.
m unit cell decrease with increasing excess Li. The decrease of the lattice parameter a follows an approximately linear relationship with the nominal amount y in Li1+yMn2−yO4 in the investigated range (Fig. 2b), in good agreement with reported results.50,51 The theoretical average oxidation state of manganese increases from 3.50 (y = 0) to 3.78 (y = 0.20), also shown in Table 4, i.e. the proportion of Mn3+ decreases with y. The ionic radii of Mn3+ and of Mn4+ are, respectively, 0.65 Å and 0.53 Å.52 By substituting Mn3+ with Li+ ions the proportion of the larger Mn3+ ions decreases, resulting in a concomitant decrease in unit cell size.
| Excess Li (y) | Discharged state | Mn AOS (discharged) | Mn AOS (charged) | Charged state assuming 3y pinning |
|---|---|---|---|---|
| 0.00 | [Li1.00]8a[Li0.00Mn2.00]16dO4 | 3.50 | 4.00 | [Li0.00]8a[Li0.00Mn2.00]16dO4 |
| 0.05 | [Li1.00]8a[Li0.05Mn1.95]16dO4 | 3.56 | 4.00 | [Li0.15]8a[Li0.05Mn1.95]16dO4 |
| 0.10 | [Li1.00]8a[Li0.10Mn1.90]16dO4 | 3.63 | 4.00 | [Li0.30]8a[Li0.10Mn1.90]16dO4 |
| 0.15 | [Li1.00]8a[Li0.15Mn1.85]16dO4 | 3.70 | 4.00 | [Li0.45]8a[Li0.15Mn1.85]16dO4 |
| 0.20 | [Li1.00]8a[Li0.20Mn1.80]16dO4 | 3.78 | 4.00 | [Li0.60]8a[Li0.20Mn1.80]16dO4 |
3.2 Voltage profiles
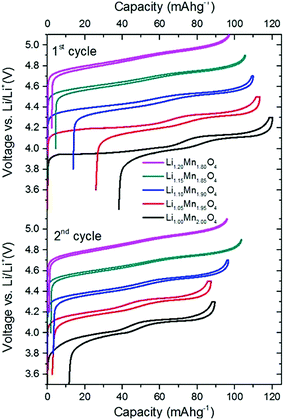
For completeness and to ensure the validity of our results, we show voltage profiling results over a range of compositions, which are in line with those already published.2,53 The stoichiometric compound, defect concentration y = 0 has poor capacity retention between the first charge and first discharge cycles, as shown here and elsewhere.34,54–56 For these reasons, it is not used in this form in the cathode materials of commercial cells, but requires defect substitution, such as the intentional introduction of excess Li. Therefore, the materials with excess Li substituted, in the range 0.05 ≤ y ≤ 0.2 (y = excess Li fraction), are more representative of the materials actually used in commercial Li-ion cells.2,53 Our primary aim is not to assess the trends in the discharge capacity or Coulombic efficiency of these compounds as a function of the composition. Rather, we show how shape changes in the voltage profiles themselves can be related to changes in the underlying excess Li (point defect) concentration in the electrode materials. We show results over the entire compositional range 0 ≤ y ≤ 0.2 to provide the maximum number of data points to validate our model and clearly identify the trends in the changes in shape of the curves.The first and second charge/discharge profiles are shown in Fig. 3. Here, each full cycle denotes one charge followed by one discharge; no electrochemical treatment was performed prior to the first cycle. The capacity during the first charge decreases monotonically with increasing amount of excess lithium, y. The stoichiometric compound LiMn2O4 reaches a first cycle capacity (during charge) of 120 mA h g−1 whereas Li1.2Mn1.8O4 only reaches 100 mA h g−1.
The stoichiometric compound loses approximately 30 mA h g−1 in the first cycle, which is comparable to the capacity loss shown in another study of stoichiometric LMO.54 The instability of this compound during electrochemical characterisation is well known.34,54–56 Hao et al.54 attributed the loss of capacity to particle cracking and a concomitant loss of active material. Alternative explanations that have been proposed are Mn disproportionation and structural distortions, such as the Jahn–Teller effect.4,34,53–56 The absolute capacity loss between the first charge and discharge cycles varies systematically with y. As shown in Table 4, excess Li raises the average oxidation state (AOS) of Mn, reducing the fraction of Mn3+ and hence reducing capacity loss due to Mn disproportionation6 and structural distortions.
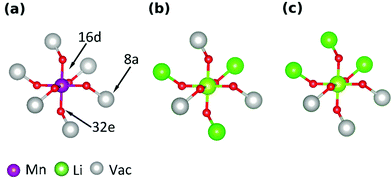
The curves obtained during the second cycle are more representative of the performance of the cathode materials and hence these curves were used for further analysis of differences in shape in the voltage profiles as a function of the material composition. In stoichiometric LiMn2O4, a kink in the voltage profiles can be observed at around 4.05 V; as the amount of y increases the kink becomes progressively less visible. This feature has been attributed to an order/disorder transition in the Li/vacancy structure.25,29,34,36,37,57 This effect is also visible in the incremental capacity (dQ/dV) curves shown in Fig. 4. The peak amplitudes at about 4 V and 4.15 V decrease with increasing 16d lithium content, y. We can attribute this effect to a suppression of the order/disorder transition, as shown previously by us37 and others.21,25,34 We and Gao et al.50 proposed that the ordered phase, Li0.5Mn2O4, is suppressed by pinned Li sites, as shown in Fig. 5.
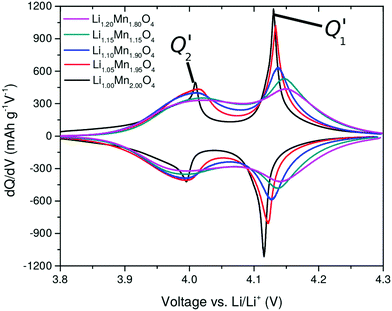 | ||
| Fig. 4 Incremental capacity curves dQ/dV, obtained from the second cycle in Fig. 3. The two peaks, Q1′ and Q2′, are highlighted. | ||
Table 4 gives an overview of the theoretical average oxidation state (AOS) of the samples and highlights the occupied 8a Li sites in the charged and discharged states. It has been proposed that a proportion of Li, xpin remains “pinned” on some of the 6 8a sites in the neighbourhood of each substituted 16d Li site.34 To retain charge balance, the proportion of pinned Li sites would be 3y.
A further observation is that the two peaks, Q1′ and Q2′ in dQ/dV (Fig. 4) are of unequal amplitudes, widths and shapes. This is true for all y values but the effect is more pronounced for low y. The issue previously been described but its origin is controversial; it could arise from the permselectivity effect during Li (de)insertion or from elastic contributions.58–60 We propose that it is related changes in interactions in the system during Li (de)insertion as well as the effect of the pinned Li sites, as we show in Section 3.5. The dQ/dV profiles can be validated further through entropy profiling (Section 3.3) and modelling (Section 3.5). We can directly compare dQ/dV with the thermodynamic information obtainable through entropy profiling, as presented in the next section.
3.3 Entropy profiles
Entropy profile results, as a function of the excess Li amount, y, are shown in Fig. 6. For y = 0, two peaks are observed in the profiles at about 4 V and 4.1 V. The results show a systematic decrease in the amplitude of the two peaks as y increases. These peaks, S1′ and S2′, occur due to a transition to an ordered phase, Li0.5Mn2O4, close to x = 0.5, and a transition to a disordered solid solution region either side of x = 0.5.29 Most previous work compared the entropy response of LiMn2O4 with one composition in which a proportion of Mn was substituted with Cr, Co, Al or Li.21,24,25 Yazami et al. performed entropy profiling on LiMn2O4 and Li1.08Mn1.92O4, but did not observe a significant change in entropy peak amplitude.21 A clear and systematic trend is shown here for the first time over a range of excess Li compositions, indicating that excess Li systematically suppresses the order/disorder transition. The trend is in line with the experimental results of Kobayashi et al. for Cr and Co substitution24,25 and previously modelled by us using Monte Carlo methods.37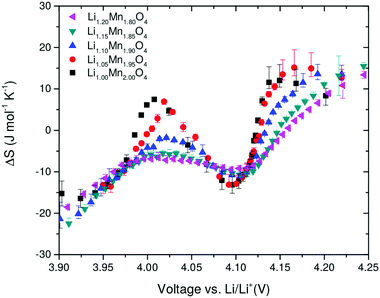 | ||
| Fig. 6 Entropy change as a function of open circuit voltage (OCV) obtained after background subtraction. The amount of excess Li, y, is shown in the legend. | ||
Within the hypothesis that the reduction in the amplitudes of S1′ and S2′ arises from the pinned Li sites, two populations of Li in the 8a sites should be considered: the total 8a proportion, 3y ≤ x ≤ 1, and only the fraction of removable Li, 0 ≤ xr ≤ 1. These populations are related by
 | (23) |
In entropy profiling, only entropy changes arising from the removable Li population are probed, since in the approximation we have adopted here, the pinned sites adopt one fixed, immovable configuration over the experimentally measured voltage range. Thus
 | (24) |
This is consistent with the fact that we defined ΔS per mole of removable Li in eqn (1), allowing entropy changes in the anode and cathode to be compared in a 1![[thin space (1/6-em)]](https://www.rsc.org/images/entities/char_2009.gif) :
:![[thin space (1/6-em)]](https://www.rsc.org/images/entities/char_2009.gif) 1 fashion. We can gain further insight to interpret the entropy and voltage profile results through modelling, as shown in the subsequent section. This also allows us to compare profiles with respect to the two 8a Li populations, xr and x.
1 fashion. We can gain further insight to interpret the entropy and voltage profile results through modelling, as shown in the subsequent section. This also allows us to compare profiles with respect to the two 8a Li populations, xr and x.
3.4 Effect of parameter variation within the model
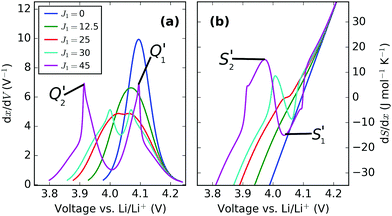 | ||
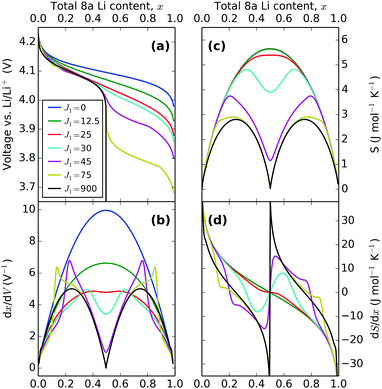
| Fig. 7 dx/dV and dS/dx, shown here as a function of voltage. J1 value, in meV, is shown in the legend, with ε0 = 4.10 eV. | ||
The overall trend in peak amplitude is most clearly shown by plotting the profiles as a function of x, as in Fig. 8. Fig. 8c shows that with J1 = 0 meV, the lithium ions are distributed with the same probability over all sites in the lattice, with a maximum in the entropy, at x = 0.5 as expected for an ideal solid solution. In the region 0.0 < J1 < 25 meV, the entropy maximum at x = 0.5 slowly decreases with J1. At J1 = 25 meV, incomplete peak separation results in a flat entropy maximum. The increase in lateral repulsions is also reflected in the voltage profiles, shown in Fig. 8a, which indicate a widening of the voltage window as a function of J1. Increasing J1 further causes the formation of two distinct entropy peaks, as shown Fig. 8c. The peak magnitudes increase with higher J1. This is related to the formation of an ordered phase at x = 0.5, which is stable over an increasing voltage range as J1 increases. The x values of the entropy maxima correspond very closely to the two maxima observed in dx/dV, as shown in Fig. 8b. These profiles, proportional to dQ/dV, show extra peaks compared with the entropy response, because of the Li–Li interactions from the J1 parameter. Eventually, at the most extreme values of J1, the two sublattices are filled sequentially and can be treated as two independent solid solutions, resulting in a discontinuity in the partial molar entropy (black line in Fig. 8d). These results are in line with the ones of Otero et al. who applied a very similar statistical mechanical model to Li intercalation in graphite,32 along with previous models of LMO.29,34,46,58
Trends in the peak variation with J1, with respect to voltage, are shown in Fig. 7. Both profiles show the voltage window widening with increasing Li–Li repulsion, J1, consistent with the voltage profiles in Fig. 8a. Consequently, the peak separations with respect to voltage in dx/dV and dS/dx increase even further with J1 than in Fig. 8b and d, with the result that the experimentally obtained profile separations are extremely sensitive to the interaction parameters.
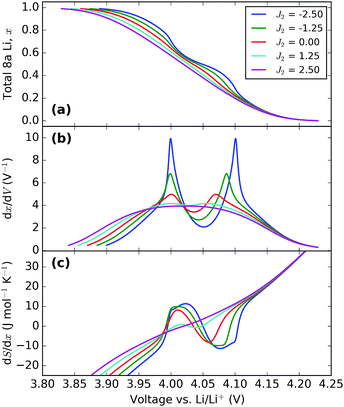 | ||
| Fig. 9 Effect of varying the next nearest neighbour parameter, J2. All profiles were obtained with J1 = 30 meV and ε0 = 4.10 eV. The value of J2 (in meV) in each instance is indicated in the legend. | ||
The voltage profiles, Fig. 9a, show the trend in the change of voltage window with J2 to be similar to that of J1, i.e. the window widens with an increase in parameter value. However, the change in slope between about 3.95 and 4.10 V becomes more pronounced with attractive J2, while repulsive J2 suppresses it, i.e. both parameters have opposite effects on the order/disorder transition. The effect is even more clearly shown by the dx/dV and dS/dx profiles, Fig. 9b and c. Therefore, the two parameters have clearly distinguishable effects. In particular, the peak profile separation increase with decreasing J2 is much less marked than when J1 is increased. Alternatively, for the same peak separation much greater amplitude changes can be obtained by varying J2 rather than J1.
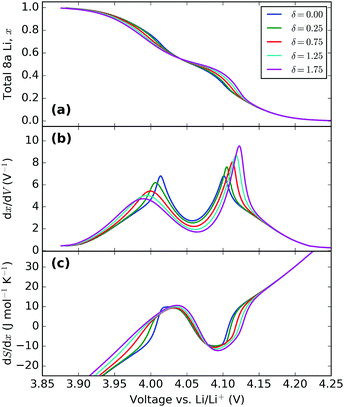 | ||
| Fig. 10 Effect of varying the energy separation, δ. All profiles were obtained with ε0 = 4.10 eV, J1 = 30 meV and J2 = −1.25 meV. The value of δ (in meV) in each instance is indicated in the legend. | ||
Increasing δ increases the peak amplitude difference between Q1′ and Q2′. This reflects the actual changes seen in experiments, as shown in Fig. 4. The change in interaction parameter could be due to lattice expansion during intercalation as observed by Yang et al.62 and Palacin et al.63 using in situ XRD.
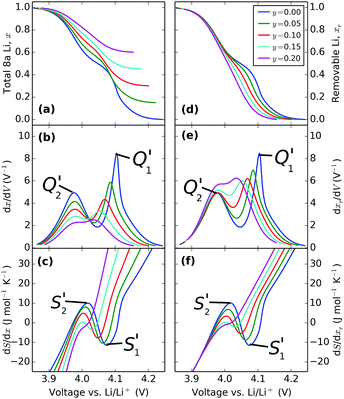 | ||
| Fig. 11 Effect of varying the excess Li amount, y, with the same interaction parameters in the model: ε0 = 4.10 eV, J1 = 30 meV, J2 = −1.25 meV and δ = 1.25 meV. | ||
The results in Fig. 11a and b are in general agreement with those of Gao et al.34 The pinned Li sites cause a reduction in available capacity. Moreover, they result in a suppression of the order/disorder transition, also visible in the entropy profiles, Fig. 11c, as well as smaller dx/dV peaks, shown in Fig. 11b. For the first time we can also see that the peak amplitude difference resulting from the constant energy separation, δ = 1.25 meV, between the J2 interaction parameter on each sublattice, is also suppressed with increasing y. These results are all in qualitative agreement with experiment, providing validation of the model.
Because the practical capacity of these electrodes changes during charge/discharge cycling, and there are uncertainties associated with determining the voltage limits at the two extremes of the solid solution region xr → 0 and xr → 1 it can be difficult to relate the vertical scales between models and experimental data. Showing the same results with respect to the removable Li population, as in Fig. 11d–f allows us to directly compare simulated and experimental curves.
In the simulated voltage profiles, Fig. 11d, the low voltage plateau as xr → 0 remains at constant voltage whereas the plateau at high voltage shifts negative in potential with increasing excess Li, y. Likewise peak Q2′ in dxr/dV (Fig. 11e) remains centred on nearly the same voltage regardless of the excess Li amount whereas Q1′ is shifted negatively. Regardless of the x scale that is considered (Fig. 11c and f), both entropy profile peaks, S1′ and S2′, shift negatively with changing y. Fig. 11f shows a systematic trend in the suppression of S1′ and S2′. As shown in eqn (24), this scale, rather than one in Fig. 11c, relates to the experimentally accessible ΔS. Although the slope of the curve, dΔS/dxr, is independent of the defect concentration for voltages V > 4.15 V, there is a lateral separation in the curves. This separation, shown also in the right hand side of Fig. 11d–e, arises from different net Li–Li interactions resulting from the different number of pinned sites. These interactions become identical in the Li filled lattices so the left hand sides of each profile tend to the same value.
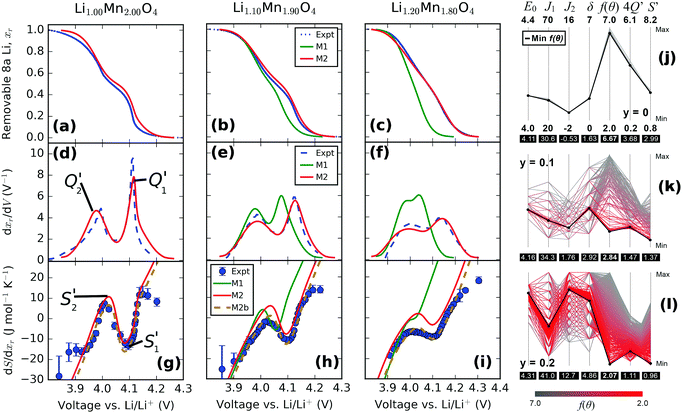
3.5 Relating simulated and experimental results
We directly compare simulated and experimental voltage (Fig. 12a–c), dxr/dV (Fig. 12d–f) and entropy profiles (Fig. 12g–i). Three scenarios are considered: in model 1 (M1), the interaction parameters which optimally fitted the profiles for LixMn2O4 by the method described in Section 2.5 were assumed to remain constant with respect to the excess Li amount, y, in the same way as the results presented in Fig. 11d–f. The observed changes then resulted only from the effect of pinned Li. In model 2 (M2), profiles were individually optimised for each y value, and all interaction parameters were allowed to vary. For clarity, the shift in the entropy change scale due to the vibrational entropy parameter, ΔSvib was omitted from the lines M1 and M2 in Fig. 12g–i. Consequently, these two curves are vertically shifted from the experimental data points, since the only effect of the ΔSvib parameter is to cause a vertical shift in the entropy change scale. Model 2b (M2b) is identical to M2 except that the contribution from ΔSvib is included in the former curve. All experimental profiles were normalised with respect to the actual capacity of the second discharge cycle, and hence we consider our model with respect to the removable Li content, xr, similarly to the right hand column of Fig. 11.A comparison of the results from M1 with the experimental profiles reveals that, while the pinned Li effect partly explains the reduced amplitudes in dxr/dV and system entropy values with increasing y, the model suggests that the intercalation potential window narrows more than is actually observed. Furthermore, the upper voltage plateau shifts negatively with increasing y, which is not reflected in the experimental data. Consistently with our previous Monte Carlo study of point defects in LixMn2O4,37 the pinned Li sites in the model cause an excessive suppression of the amplitude of the entropy profile peaks. There, only one pinned Li site per defect was assumed, resulting in quantitative differences between the model and experimental results at 30% defect concentration. Here, with 3 times as many pinned Li sites, the discrepancy can be seen at 10% and 20% defect concentration, as shown in Fig. 12h and i.
Table 5 shows the optimised interaction parameters within the assumptions of model 2b (M2b). There is a trend towards increasing repulsion in both the nearest and second nearest neighbour interactions, J1 and J2, as the Li excess, y, increases. However, changes in the interaction across the intercalation range must be taken into account to explain the changes observed in the dQ/dV peaks. For J2, the (net) interaction switches from being attractive for y = 0, to weakly repulsive for y = 0.10, to repulsive for y = 0.20. There is also a trend towards a higher point term ε0 as y increases, indicating increasing Li–lattice attraction. The observed trends are consistent with the experimentally determined decrease in the lattice constant as a function of y. The reduced nearest neighbour distance would be expected to lead to an increase in Coulombic repulsion between positively charged Li ions in the lattice. We do not have an explanation for the increase in the δ term with y but it could result from changes in the Coulombic screening across the intercalation range in combination the changing oxidation state of the surrounding Mn ions.
| y | ε 0 (eV) | J 1 (meV) | J 2 (meV) | δ (meV) | ΔSvib (kJ mol−1 K−1) |
|---|---|---|---|---|---|
| 0 | 4.11 | 30.6 | −0.5 | 1.6 | −3.5 |
| 0.05 | 4.13 | 33.8 | −0.8 | 1.7 | −3.8 |
| 0.1 | 4.16 | 34.3 | 1.8 | 2.9 | −5.0 |
| 0.15 | 4.22 | 34.6 | 6.3 | 4.3 | −6.7 |
| 0.2 | 4.32 | 41.0 | 12.7 | 4.9 | −7.0 |
In terms of the numerical values from fitting the simulations to experiments, the optimised values of ε0 and J1 determined for the stoichiometric compound, 4.11 eV and 30.7 meV respectively, are very close to those reported in the literature. Kim and Pyun reported 4.12 eV and 37.5 meV by fitting galvanostatic intermittent titration technique (GITT) curves using Monte Carlo methods29 while Gao et al. reported 4.145 eV and 37.5 meV using mean field methods.34 The negative sign of J2 determined in the present work is consistent with these works but the magnitude, |J2| = 0.5 meV, is somewhat lower. Gao et al. determined J2 = −5 meV34 while Kim and Pyun reported J2 = −4 meV.29 The discrepancy likely results from the extra degree of freedom and physical insight allowed by the δ parameter; it can be seen from Fig. 9 that the reported values of J2 would result in dQ/dV peaks much sharper and narrower than the experimental ones. It is not possible to compare the values determined as a function of y since prior work assumed that the interaction parameters did not vary as a function of the defect concentration.34,46,64
The effect of the fitting process itself on the determined parameters can also be considered, as shown in Fig. 12j–l. This method is known as “parallel coordinates” and is described elsewhere.65,66 All input parameters in the optimisation procedure and a map to the resulting values of the objective function (f(θ)) from the fitting procedure are shown. For clarity, the values of ΔSvib were omitted from Fig. 12j–l as the convergence of the optimisation procedure was found to be insensitive to this parameter. To produce these plots, all data from the brute force method and the simplex procedure were aggregated together. The values of the fit to the individual curves, dQ/dV and entropy profiles, are denoted here as 4Q′ and S′, respectively. A more comprehensive presentation of the fitting to all the experimental results is shown in the ESI,† Fig. S2.
Fig. 12j and k show that, for y = 0 and y = 0.1, the minimum 4Q′ and S′ values almost exactly coincide with the weighted fit to both curves, f(θ). However, with increasing amounts of excess Li, most clearly shown at y = 0.2 in Fig. 12l, quantitative differences between the fits to the two curves arise. The figure shows that the total objective value, f(θ) is almost exactly coincident with the value of S′, while the overall optimum value for dQ/dV, denoted by 4Q′, is linked to a different set of input energy parameters than the global optimum. However, the qualitative interpretation of increasing Li–Li repulsion is unaffected by fitting individually to dQ/dV or entropy profile curves, or a weighted sum of both curves, as shown in the ESI,† Fig. S2.
In general, Fig. 12j and k indicate increasing complexity in determining the overall optimum f(θ) as the excess Li amount, y, increases. The reason is that the peak widths and amplitudes of dQ/dV and entropy profiles become broader and weaker, respectively, as y increases. Consequently, there is less available information to determine the optimal parameter set. For example, for y = 0.2, a decrease in J1 can be compensated for by an increase in J2 with a minimal change in the fit quality. This observation has important implications for modelling voltage and entropy profiles in commercial cathodes with mean field methods because these electrodes are designed to intentionally suppress order/disorder transitions, i.e. peak amplitudes are reduced.
It is also likely that the assumption of the Bragg–Williams approximation that there are no correlations between the sublattice occupancies (i.e. that 〈n1n2〉 = 〈n1〉〈n2〉), becomes weaker as more pinned Li sites are present in the system. Therefore, we plan to validate these parameters further by performing Monte Carlo simulations using effective cluster interactions determined by density functional theory (DFT) calculations. Based on the work presented here, these simulations will account for changes in the lateral interaction parameters dependent on the lattice parameter. The simulations will determine the point terms in the near neighbourhood of the defects, therefore allowing for local clustering in the orbit of the defects, which could not be captured by the present model. However, the real value of the comparison between the experimental and simulated results is that the method allows for high throughput determination of the trends in the parameters, providing physical insight into the origins of the changes in the peaks.
4 Conclusions
We investigated the effect of excess Li, y (0 ≤ y ≤ 0.2) in Li1+yMn2−yO4 on entropy, voltage and dQ/dV profiles. Through numerical optimisation, we compared the results from a mean-field model with experimental entropy and dQ/dV results.From this work the following insights can be drawn:
(1) Entropy profiles revealed a systematic suppression of the order/disorder transition in the Li/vacancy structure as a function of the amount of excess Li, y, in the lattice.
(2) For all compositions, dQ/dV showed two peaks of unequal magnitudes and shapes. In accordance with previous work, these peaks were also suppressed by excess Li.
(3) Both profiles were modelled through mean-field simulations. An inherent problem in conventional models based on pairwise interactions is profile symmetry either side of x = 0.5, contrary to the experimental profiles. To model the observed peak asymmetry, simulations included a single correction term which allowed the interaction parameters to vary linearly over the intercalation range.
(4) Fitting both profiles through numerical optimisation revealed that pinned Li sites, proportional to the defect fraction xpin = 3y, resulted in an overestimation of the peak magnitude suppression if the interaction parameters were assumed to be unaffected by the defect concentration, y.
(5) The optimised interaction parameters indicated increased Li–Li repulsion and increased Li–lattice attraction (point term) with increasing excess Li, y.
(6) The same trend was obtained when separately optimising simulated fits to dQ/dV and entropy profiles, or when fitting a weighted sum of both profiles. Quantitative differences between the parameter values from individually optimised fits suggest limitations in the mean-field approximation for high excess Li spinels.
The work provides insight into the physical origins of the peaks in electrochemical and thermodynamic profiles of Li-ion cells, which could lead to a better understanding of the changes observed in aged cells. We highlight the importance of accounting for interaction parameter changes during intercalation, possibly resulting from elastic contributions or charge transfer (changes in oxidation state) during Li (de)insertion. Furthermore, numerical optimisation revealed challenges in fitting the profiles of electrodes in which order/disorder transitions have been intentionally suppressed, as in commercial cathodes. This suggests that the mean-field approximation, widely adopted in the battery community because of its high throughput, requires additional refinement to fully capture the physical processes during intercalation. Therefore, we plan to compare the results of mean-field simulations with Monte Carlo simulations parameterised by effective cluster interactions from DFT calculations, including effects arising from changes in the lattice during Li (de)insertion.
Conflicts of interest
There are no conflicts to declare.Acknowledgements
We are grateful to the STFC Batteries Network for a Proof of Concept Award (grant number: ST/N002385/1) and the Faraday Institution (faraday.ac.uk; EP/S003053/1), grant number FIRG003, for funding. MPM thanks Denis Kramer from the University of Southampton for his feedback on the mean field approach. MPM thanks Jamie Fairbrother from the Lancaster University Management School for discussions regarding the numerical optimisation approach.References
- M. S. Whittingham, Chem. Rev., 2004, 104, 4271–4301 CrossRef PubMed.
- M. M. Thackeray, Prog. Solid State Chem., 1997, 25, 1–71 CrossRef.
- J. B. Goodenough and Y. Kim, Chem. Mater., 2010, 22, 587–603 CrossRef.
- M. M. Thackeray, Y. Shao-Horn, A. J. Kahaian, K. D. Kepler, E. Skinner, J. T. Vaughey and S. A. Hackney, Electrochem. Solid-State Lett., 1998, 1, 7–9 CrossRef.
- B. Scrosati and J. Garche, J. Power Sources, 2010, 195, 2419–2430 CrossRef.
- J. Vetter, P. Novák, M. Wagner, C. Veit, K.-C. Möller, J. Besenhard, M. Winter, M. Wohlfahrt-Mehrens, C. Vogler and A. Hammouche, J. Power Sources, 2005, 147, 269–281 CrossRef.
- X. Han, M. Ouyang, L. Lu, J. Li, Y. Zheng and Z. Li, J. Power Sources, 2014, 251, 38–54 CrossRef.
- L. Zhou, M. Leskes, T. Liu and C. P. Grey, Angew. Chem., Int. Ed., 2015, 54, 14782–14786 CrossRef PubMed.
- B. Wu, V. Yufit, Y. Merla, R. F. Martinez-Botas, N. P. Brandon and G. J. Offer, J. Power Sources, 2015, 273, 495–501 CrossRef.
- K. Maher and R. Yazami, Electrochim. Acta, 2013, 101, 71–78 CrossRef.
- X.-F. Zhang, Y. Zhao, Y. Patel, T. Zhang, W.-M. Liu, M. Chen, G. J. Offer and Y. Yan, Phys. Chem. Chem. Phys., 2017, 19, 9833–9842 RSC.
- A. H. Thompson, Physica B+C, 1981, 105, 461–465 CrossRef.
- J.-S. Kim, J. Prakash and J. R. Selman, Electrochem. Solid-State Lett., 2001, 4, A141–A144 CrossRef.
- S. Al Hallaj, R. Venkatachalapathy, J. Prakash and J. R. Selman, J. Electrochem. Soc., 2000, 147, 2432–2436 CrossRef.
- Y. Reynier, R. Yazami and B. Fultz, J. Power Sources, 2003, 119-121, 850–855 CrossRef.
- Y. F. Reynier, R. Yazami and B. Fultz, J. Electrochem. Soc., 2004, 151, A422–A426 CrossRef.
- Y. Reynier, J. Graetz, T. Swan-Wood, P. Rez, R. Yazami and B. Fultz, Phys. Rev. B: Condens. Matter Mater. Phys., 2004, 70, 174304 CrossRef.
- N. S. Hudak, L. E. Davis and G. Nagasubramanian, J. Electrochem. Soc., 2015, 162, A315–A321 CrossRef.
- K. E. Thomas and J. Newman, J. Power Sources, 2003, 119-121, 844–849 CrossRef.
- K. E. Thomas, C. Bogatu and J. Newman, J. Electrochem. Soc., 2001, 148, A570 CrossRef.
- R. Yazami, Y. Reynier and B. Fultz, ECS Trans., 2006, 1, 87–96 Search PubMed.
- S. Bach, J. P. Pereira-Ramos, N. Baffier and R. Messina, Electrochim. Acta, 1992, 37, 1301–1305 CrossRef.
- S. Al Hallaj, R. Venkatachalapathy, J. Prakash and J. R. Selman, J. Electrochem. Soc., 2000, 147, 2432–2436 CrossRef.
- T. Kashiwagi, M. Nakayama, K. Watanabe, M. Wakihara, Y. Kobayashi and H. Miyashiro, J. Phys. Chem. B, 2006, 110, 4998–5004 CrossRef PubMed.
- Y. Kobayashi, Y. Mita, S. Seki, Y. Ohno, H. Miyashiro, M. Nakayama and M. Wakihara, J. Electrochem. Soc., 2008, 155, A14–A19 CrossRef.
- P. J. Osswald, M. Del Rosario, J. Garche, A. Jossen and H. E. Hoster, Electrochim. Acta, 2015, 177, 270–276 CrossRef.
- K. Kai, Y. Kobayashi, H. Miyashiro, G. Oyama, S.-I. Nishimura, M. Okubo and A. Yamada, ChemPhysChem, 2014, 15, 2156–2161 CrossRef PubMed.
- S. J. Bazinski and X. Wang, J. Electrochem. Soc., 2014, 161, A168–A175 CrossRef.
- S.-W. Kim and S.-I. Pyun, Electrochim. Acta, 2001, 46, 987–997 CrossRef.
- E. M. Perassi and E. P. M. Leiva, Electrochem. Commun., 2016, 65, 48–52 CrossRef.
- E. P. M. Leiva, E. Perassi and D. Barraco, J. Electrochem. Soc., 2017, 164, A6154–A6157 CrossRef.
- M. Otero, A. Sigal, E. Perassi, D. Barraco and E. Leiva, Electrochim. Acta, 2017, 245, 569–574 CrossRef.
- K. Maher and R. Yazami, J. Power Sources, 2014, 247, 527–533 CrossRef.
- Y. Gao, J. N. Reimers and J. R. Dahn, Phys. Rev. B: Condens. Matter Mater. Phys., 1996, 54, 3878–3883 CrossRef.
- R. J. Gummow, J. Electrochem. Soc., 1994, 141, 1178–1182 CrossRef.
- A. Van Der Ven, C. Marianetti, D. Morgan and G. Ceder, Solid State Ionics, 2000, 135, 21–32 CrossRef.
- M. P. Mercer, S. Finnigan, D. Kramer, D. Richards and H. E. Hoster, Electrochim. Acta, 2017, 241, 141–152 CrossRef.
- B. Ammundsen, G. R. Burns, M. S. Islam, H. Kanoh and J. Roziere, J. Phys. Chem. B, 1999, 103, 5175–5180 CrossRef.
- A. R. Natarajan, J. C. Thomas, B. Puchala and A. Van der Ven, Phys. Rev. B, 2017, 96, 134204 CrossRef.
- V. L. Chevrier, S. P. Ong, R. Armiento, M. K. Y. Chan and G. Ceder, Phys. Rev. B: Condens. Matter Mater. Phys., 2010, 82, 075122 CrossRef.
- M. Verbrugge, D. Baker, B. Koch, X. Xiao and W. Gu, J. Electrochem. Soc., 2017, 164, E3243–E3253 CrossRef.
- C. R. Birkl, E. McTurk, M. R. Roberts, P. G. Bruce and D. A. Howey, J. Electrochem. Soc., 2015, 162, A2271–A2280 CrossRef.
- C. R. Birkl, M. R. Roberts, E. McTurk, P. G. Bruce and D. A. Howey, J. Power Sources, 2017, 341, 373–386 CrossRef.
- T. Ohzuku and A. Ueda, J. Electrochem. Soc., 1997, 144, 2780–2785 CrossRef.
- H. Berg, J. O. Thomas, W. Liu and G. C. Farrington, A neutron diffraction study of Ni substituted LiMn2O4, Solid State Ionics, 1998, 112, 165–168 CrossRef.
- R. Darling and J. Newman, J. Electrochem. Soc., 1999, 146, 3765–3772 CrossRef.
- G. Ceder and A. Van Der Ven, Electrochim. Acta, 1999, 45, 131–150 CrossRef.
- W. Liu, K. Kowal and C. G. Farrington, J. Electrochem. Soc., 1998, 145, 459–465 CrossRef.
- J. A. Nelder and R. Mead, Comput. J., 1965, 7, 308–313 CrossRef.
- Y. Gao and J. R. Dahn, J. Electrochem. Soc., 1996, 143, 1783–1788 CrossRef.
- M. Wang and A. Navrotsky, J. Solid State Chem., 2005, 178, 1182–1189 CrossRef.
- J. Cho, J. Mater. Chem., 2008, 18, 2257–2261 RSC.
- A. Yamada, J. Solid State Chem., 1996, 122, 160–165 CrossRef.
- X. Hao, X. Lin, W. Lu and B. M. Bartlett, ACS Appl. Mater. Interfaces, 2014, 6, 10849–10857 CrossRef PubMed.
- C. P. Grey and N. Dupré, Chem. Rev., 2004, 104, 4493–4512 CrossRef PubMed.
- Y. J. Lee and C. P. Grey, J. Electrochem. Soc., 2002, 149, A103–A114 CrossRef.
- K. Thomas and J. Newman, J. Power Sources, 2003, 119, 844–849 CrossRef.
- V. I. Kalikmanov and S. W. De Leeuw, Solid State Ionics, 2002, 154-155, 195–201 CrossRef.
- E. V. Vakarin, J. P. Badiali, M. D. Levi and D. Aurbach, Phys. Rev. B: Condens. Matter Mater. Phys., 2000, 63, 014304 CrossRef.
- E. V. Vakarin and J. P. Badiali, J. Phys. Chem. B, 2002, 106, 7721–7724 CrossRef.
- T. Ohzuku, M. Kitagawa and T. Hitai, J. Electrochem. Soc., 1990, 137, 40–46 CrossRef.
- X. Q. Yang, X. Sun, S. J. Lee, J. McBreen, S. Mukerjee, M. L. Daroux and X. K. Xing, Electrochem. Solid-State Lett., 1999, 2, 157–160 CrossRef.
- M. R. Palacín, G. G. Amatucci, M. Anne and Y. Chabre, J. Power Sources, 1999, 81-82, 627–631 CrossRef.
- T. Kudo and M. Hibino, Electrochim. Acta, 1998, 43, 781–789 CrossRef.
- J. Heinrich and D. Weiskopf, Eurographics 2013 – State of the Art Reports, 2013.
- M. D'Ocagne, Coordonnées parallèles et axiales: méthode de transformation géométrique et procédé nouveau de calcul graphique déduits de la considération des coordonnées parallèles, Gauthier-Villars, Paris, 1885 Search PubMed.
Footnote |
| † Electronic supplementary information (ESI) available. See DOI: 10.1039/c8cp02989j |
| This journal is © the Owner Societies 2018 |

