 Open Access Article
Creative Commons Attribution 3.0 Unported Licence
Probing hydrogen bonding interactions and impurity intercalation in gibbsite using experimental and theoretical XANES spectroscopy†
Grant J.
McIntosh
 *ab and
Andrew
Chan
 b
b
aLight Metals Research Centre, University of Auckland, Private Bag 92019, Auckland, New Zealand. E-mail: g.mcintosh@auckland.ac.nz
bSchool of Chemical Sciences, University of Auckland, Private Bag 92019, Auckland, New Zealand
First published on 3rd September 2018
Abstract
The Al and O K-edge XANES spectra of Bayer process gibbsite are examined, both experimentally and with plane wave density functional theory, and transition assignments are made. We confirm that the broad transitions in Al K-edge spectra are fundamentally the same as those in more ordered and well-studied corundum, and typical of octahedrally coordinated aluminium. Analysis of O K-edge spectra reveals that while much of the initial edge transition structure (535–548 eV) is due to O 2p hybridization with Al orbitals, the lowest energy region (∼535–539 eV) is particularly influenced by O–H states which are heavily perturbed by hydrogen bonding interactions. We therefore tentatively suggest that an unexplained structure at 539 eV in O K-edge spectra of corundum may be due to surface hydroxylation. Finally, we examined Na K-edge spectra, as sodium is the major impurity in these materials and implicated in perturbation of the evolution of materials properties with calcination through the transition aluminas. Density functional theory calculations find sodium replacement of in-sheet H-atoms is the most thermodynamically stable site for sodium inclusion. We subsequently confirm this assignment spectroscopically, explicitly demonstrating the precise location of Na+ impurities for the first time.
1. Introduction
Alumina is an extremely important industrial material, widely used in catalysis1–6 and adsorption.7–11 However, by far the largest consumer is the primary aluminium production industry that, in addition to using alumina as the primary feedstock, employs it as the dry scrubbing agent for hydrogen fluoride generated in the reduction cell.12–14 With many of alumina's applications crucially dependent on its surface chemistry, it is necessary to understand the evolution of these properties from the precursor to final product.Calcination of gibbsite, Al(OH)3, or boehmite, AlOOH, are the most common production routes for a variety of important alumina polymorphs. Although specific surface areas are low, both are also sorbents in their own right,15–18 and their surface chemistry is similarly of interest. Gibbsite and boehmite possess ordered crystal structures exhibiting sheets of octahedrally coordinated aluminium cations and weak inter-sheet bonding mediated by hydrogen bonds (H-bonds) between hydroxyl moieties of opposing planes. Current mechanisms posit that the hydroxyls are progressively lost as H2O(g) during calcination, with most of the inter-sheet regions collapsing and covalent Al–O bonds forming in their place.19,20 As these transformations are pseudomorphic,21 volume losses are incorporated internally, leading to the cleaving of some of these sheets to ultimately become much of the internal porosity. The chemistry of alumina is thus arguably dominated by residual hydroxyl content and surface relaxation of these internal surfaces.20
Understanding these processes is therefore important in controlling the properties and performance of alumina surfaces. X-ray absorption near edge structure (XANES) spectroscopy is a powerful technique to probe surface chemistry and element-specific local chemical environments. However, spectra can be extremely difficult to interpret. This is particularly true of transition aluminas as aluminium cations can be 4, 5, or 6-fold coordinated with considerable disorder in the occupancy of these sites, with occupancy also varying with phase.19,22–24 This in turn impacts interpretations of oxygen spectra, which are highly sensitive to the bonding interactions involved.25
Computational methods can be a powerful supplement in this regard. However, approaches require careful benchmarking before application to complicated systems such as the transition aluminas. Corundum and gibbsite are extremely attractive model systems for initial studies as they are single phase materials that exhibit cations with well-defined crystallographic locations, occupying octahedral sites exclusively. Additionally, these compounds exhibit only oxide or hydroxide interactions respectively.
A further complication stems from impurities. It has been demonstrated that sodium, the largest impurity in Bayer process aluminas,26 can significantly impact surface chemistry,27–29 textural properties,30 and even phase transformation.31 Sodium is observed to surface segregate during calcination,31,32 consistent with DFT and experimental studies on sodium-doped γ-Al2O3 of Digne et al.26 who demonstrated the energetic favourability of sodium in surface sites analogous to protons in hydroxyl groups, relative to bulk incorporation. It has considerable impacts on surface acidity,27,28 and thus the demand for sodium-free alumina drives the need for acid leaching procedures.33
Understanding the location of sodium in precursor materials is important for understanding evolution with calcination and, given some observed commonalities with hydrogen26 may make sodium a useful proxy by which to study protons (invisible to X-ray techniques such as XRD, XPS, and XAS). Indeed, Eremin et al.34,35 argue for proton replacement by Na+ as the primary intercalation mechanism during crystal growth. Lee et al.36 computationally confirm this exchange is energetically feasible. Comparison with lithium-intercalated gibbsite also suggests occupation of vacant octahedral sites is possible.37,38 Understanding sodium is also significant for technologically important materials. For example, β-sodium alumina, a solid electrolyte, relies on sodium ion migration through conduction planes consisting of loose-packed layers rich in sodium cations.
In this study we therefore consider Al, O, and Na K-edge XANES spectra of standard Bayer gibbsite samples. Being far more crystallographically ordered and less complicated than the wider class of transition aluminas, this material provides a convenient platform to benchmark core hole-inclusive pseudopotential methods to aid future experimental and theoretical studies of more complex and important classes of metal oxides and doped metal oxides.
2. Methods
2.1. Experimental methodology
Bayer gibbsite was sourced from a large commercial alumina refinery whose identity is confidential (although is expected to be a representative material), and used as received. Pure corundum, −100 mesh, was purchased from Sigma-Aldrich. X-ray absorption near edge structure (XANES) spectroscopy was performed on the Soft X-ray (SXR) beamline at the Australian Synchrotron.39 The storage ring was operated at 3 GeV to provide a photon flux of ∼5 × 10¹¹ s−1 200 mA for the duration of the experiments. Powdered alumina samples were mounted onto drain current holders using carbon tape then introduced into UHV conditions (∼8 × 10⁻¹⁰ mbar). Monochromated and elliptically polarized soft X-rays produced from an undulator insertion device were focussed to a 0.2 × 0.5 mm spot using a double crystal monochromator. Partial electron yield (PEY) and total fluorescence yield (TFY) measurements were optimized using a channeltron electron multiplier and multichannel plate, respectively. All XANES data were processed using the QANT Igor macro (version 1.9, 2017) developed by Gann et al.40 All spectra were collected using a flood gun to compensate for sample charging then normalised against the I0 current measured simultaneously on a gold mesh. Photon energy calibration was performed over the Al, O, and Na K-edges using signals from Al foil, MnO and NaCl powder reference materials, respectively, measured concurrently to account for photon energy drift. Spectra were recorded in a single scan with stepsizes of 0.17 eV, 0.10 eV, and 0.10 eV for Al, Na and O K-edges respectively, and at a scan rate of 0.5 s per step. Finally, all spectra are normalized as per convention (pre-edge baseline set to zero, post-edge to 1).2.2. Computational methodology
All XANES spectra were computed with the XSPECTRA code41,42 This package computes the X-ray absorption cross-section by evaluating Fermi's golden rule: | (1) |
![[small psi, Greek, tilde]](https://www.rsc.org/images/entities/i_char_e0e3.gif) 〉 by the linear operator T:
〉 by the linear operator T:|ψ〉 = T|![[small psi, Greek, tilde]](https://www.rsc.org/images/entities/i_char_e0e3.gif) 〉 〉 | (2) |
This operator is expressed in terms of projector functions 〈![[p with combining tilde]](https://www.rsc.org/images/entities/i_char_0070_0303.gif) R,n| and all-electron and pseudo- partial waves 〈
R,n| and all-electron and pseudo- partial waves 〈![[small variant phi, Greek, tilde]](https://www.rsc.org/images/entities/i_char_e12c.gif) R,n| and 〈φR,n|, respectively:
R,n| and 〈φR,n|, respectively:
 | (3) |
These functions are centred around atomic sites R. The partial pseudowave centred on the absorber atom R0 can be shown41,42 to be:
 | (4) |
And the absorption cross-section subsequently:
 | (5) |
Gougoussis et al.42 then introduce the S operator with a view to evaluating eqn (1) within the ultrasoft pseudopotential scheme:44
 | (6) |
![[H with combining tilde]](https://www.rsc.org/images/entities/i_char_0048_0303.gif)
![[H with combining tilde]](https://www.rsc.org/images/entities/i_char_0048_0303.gif) |ψ〉 = ES|ψ〉 |ψ〉 = ES|ψ〉 | (7) |
![[G with combining tilde]](https://www.rsc.org/images/entities/i_char_0047_0303.gif) (x) (for real x) can be defined:
(x) (for real x) can be defined: | (8) |
Finally, it has been shown42 that combining eqn (1), (4), and (8) leads to:
 | (9) |
The matrix element is evaluated with the Lanczos recursion method.45 This method therefore allows the absorption cross-section to be evaluated practically from conventional DFT-based band structure calculations, using ultrasoft pseudopotentials. This alleviates problems with popular multiple scattering-based alternatives where a cluster size around the absorber must specified while also avoiding the muffin-tin approximation.46 However, it does require care in choosing unit cell sizes and particularly large supercells are usually required, thereby demanding more computational resources. Generally, it also requires the use of pseudopotentials explicitly incorporating a core hole. These require explicit benchmarking, and indeed this is one of the primary aims of this work.
Eqn (5) helps to highlight the connection between absorption cross-section and the overlap of states computed with pseudopotentials, and therefore interpretation of XANES peaks as electronic transitions. This interpretation has become less popular relative to multiple scattering paradigms which lead more naturally to the interpretation of all peaks as scattering events associated with the outgoing photoelectron wave. Eqn (9) demonstrates that this view is also encapsulated in treatment by the XSPECTRA package with ![[G with combining tilde]](https://www.rsc.org/images/entities/i_char_0047_0303.gif) (x) the propagator of the electron wave (evaluated within the framework of DFT calculations with ultrasoft pseudopotentials). However, much emphasis will still be placed in this work on the conceptual framework that views the absorption cross-section as the result of core electron excitation into the valence band as this approach is still widely used by experimentalists to interpret the spectra of metallic cations in particular.47–50 In such cases, interpretation based on crystal field theory is very common. As such, we will make extensive use of projected density of states (pDOS) in order to make closer connection to the prior experimental assignments.
(x) the propagator of the electron wave (evaluated within the framework of DFT calculations with ultrasoft pseudopotentials). However, much emphasis will still be placed in this work on the conceptual framework that views the absorption cross-section as the result of core electron excitation into the valence band as this approach is still widely used by experimentalists to interpret the spectra of metallic cations in particular.47–50 In such cases, interpretation based on crystal field theory is very common. As such, we will make extensive use of projected density of states (pDOS) in order to make closer connection to the prior experimental assignments.
First-principles calculations, including SCF calculations, geometry optimizations, and simulated XANES spectra were undertaken by plane-wave density functional theory using the PBE approximation51 with the QUANTUM-ESPRESSO suite of codes.52,53 Troullier–Martins norm-conserving pseudopotentials were generated for Al and Na with 3s, 3p, and 3d valence orbitals; the 3s occupancy of sodium was set to 0.5 to account for its tendency toward ionisation. Oxygen was generated with 2s, 2p and 3d valence orbitals. Pseudopotentials of all absorbing atoms in XANES calculations were generated analogously using the ATOMIC code, but include core-hole effects simulated by restricting the occupancy of 1s orbitals to a single electron.
The Al and O K-edge spectra for corundum and the Na K-edge spectrum of NaCl were simulated in order to benchmark our pseudopotentials. Locations of Al3+ and O2− in corundum (R![[3 with combining macron]](https://www.rsc.org/images/entities/char_0033_0304.gif) c) were read from PDF-card 46-1212, and used to construct 2 × 2 × 2 supercells (240 atoms) without further optimization. The PDF-card 83-1728 was employed to determine the location of Na+ and Cl− in NaCl (Fm
c) were read from PDF-card 46-1212, and used to construct 2 × 2 × 2 supercells (240 atoms) without further optimization. The PDF-card 83-1728 was employed to determine the location of Na+ and Cl− in NaCl (Fm![[3 with combining macron]](https://www.rsc.org/images/entities/char_0033_0304.gif) m) from which a 3 × 3 × 3 supercell (216 atoms) was constructed and also used without further optimization. The large cells were required to keep absorbing centres in neighbouring periodic images sufficiently distant during XANES simulations as to be effectively non-interacting.
m) from which a 3 × 3 × 3 supercell (216 atoms) was constructed and also used without further optimization. The large cells were required to keep absorbing centres in neighbouring periodic images sufficiently distant during XANES simulations as to be effectively non-interacting.
Sodium-containing gibbsite, on the other hand, does not possess a known structure and geometries were necessarily constructed computationally. Initial geometries were taken from PDF-card 70-2038 for pure gibbsite. Pre-optimized dimensions of the 448 atom (2 × 2 × 2) supercell (P121/n1) are a = 17.368 Å, b = 10.156 Å, and c = 19.472 Å, with α = 90.0°, β = 94.54°, and γ = 90.0°. Appropriate replacements of protons by sodium were made, with geometry optimizations then performed with the PWscf code on the supercells using a (1 × 1 × 1) k-point grid, a plane wave energy cutoff of 45 Ry, and a density cutoff of 540 Ry. Full cell optimization was performed with symmetry ignored.
For XANES simulations the final geometries were subjected to SCF energy calculation on a (3 × 3 × 3) k-point grid, a plane wave energy cutoff of 80 Ry, and a density cutoff of 960 Ry. XANES spectra were computed from −10 eV to 50 eV, where the Fermi level is set to zero energy, over a (4 × 4 × 4) k-point grid. Broadening parameters for transitions were chosen to best qualitatively match experimental spectra as discussed below. The energy scales of the simulated spectra were offset by a constant value chosen in order to achieve the closest match with experiment.
3. Results and discussion
3.1. Benchmarking Al, O, and Na K-edge XANES spectra
Al K-edge spectra of corundum have been simulated previously with extremely good agreement with experiment.54–57 Our spectra similarly show very good agreement with experiment (Fig. 1) which are also consistent with previous measured spectra.58–60 All features A–G2 up to ∼22 eV above the edge are reproduced with the exception of the pre-edge feature p. Calculations repeated without including a core-hole in the absorber pseudopotential (Fig. S1, ESI†) demonstrate very poor agreement, indicating that these cannot be neglected. The pre-edge is attributed to a weak transition that arises as a consequence of symmetry-breaking,20 either due to distortion inherent in the AlO6 units or vibrational motion.57 The pDOS calculations confirm previous assignments describing p as a dipole-forbidden 1s → 3s excitation in the absorber Al atom Al*,57,58 as understood within the crystal field theory/electronic excitation paradigm.61 We do not find evidence of p being a consequence of the hybridisation of Al p and O p orbitals as suggested following the multiple scattering calculations of Mottana et al.,60 although the transition may indeed involve some O 2p contribution.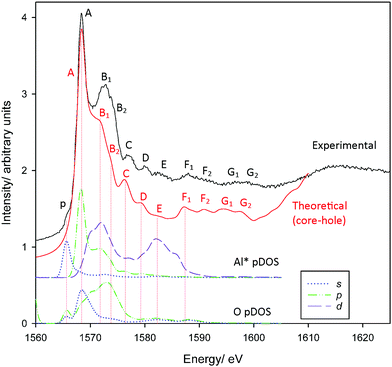 | ||
| Fig. 1 Measured and calculated PEY Al K-edge XANES spectra of corundum. Also provided are Al* 3s, 3p, 3d and O 2s, 2p pDOS results. | ||
Other peaks also agree broadly with the assignments of Li et al.58 Incidentally, these assignments are consistent with changes in intensity following changes in selection rules when examining L2,3-edge spectra.62–64 Peak A coincides with an Al* 3p band consistent with previous assignment as a Laporte-allowed a1g(1s) → t1u(3p-like) transition. However, we find here that the 3p-band is split on interaction with neighbouring O-atoms, and peak A is perhaps more appropriately considered a transition into Al*(3p)–O(2s) hybrid states. The second mixed state, Al*(3p)–O(2p), coincides with peaks B1/B2 as does an Al*(3d) band. We find the 3d states are broadly split into two groups, consistent with t2g–eg splitting predicted with crystal field theory. Experimental assignments describe peaks B1/B2 as an Al*-centred a1g(1s) → t2g(3d-like) transition.58 In a strict Oh environment this transition should be Laporte-forbidden. Local symmetry breaking and hybridisation could relax these rules sufficiently to describe the observed intensity, however, it may also be reasonable to re-assign these transitions as primarily Al*(3p)-like, or a mixture of both. We will return to this point shortly.
The influence of Al*(3p) orbitals or mixing with adjacent (ligand) orbitals is supported by the low intensity of peak E. This is assigned as an a1g(1s) → eg(3d-like) transition,58 which is also strictly forbidden, and our pDOS calculations confirm a coincidence with Al* 3d-bands. The low intensity of peak E suggests that symmetry breaking alone is insufficient to allow the t2g(3d-like) bands to contribute to peaks B1/B2. Overlap with orbitals predominantly from adjacent atoms is required for Al*(3d) states to contribute to peaks B1/B2.
Finally, peak D is assigned as a multiple scattering event.58 While all transitions can be interpreted as multiple scattering events, we confirm this assignment is reasonable insofar as there are no clear coincidences with the local band structure that would otherwise provide a definable electronic transition.
O K-edge spectra for corundum are reproduced in Fig. 2. Overall, there is extremely good agreement in features B-H2. As with the Al K-edge, pre-edge features p1 and p2 were not reproduced. However, p1 and p2 are present in the carbon tape substrate20 (see Fig. S2, ESI†) and are most likely either epoxide transitions or, less likely, defects/vacancies from beam damage25 or oxygen scavenging.65
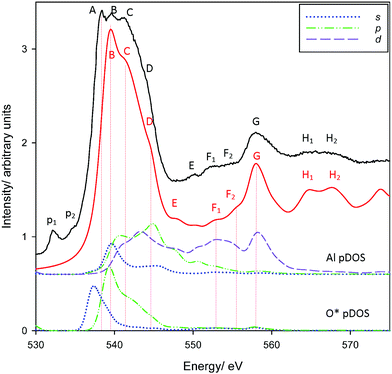 | ||
| Fig. 2 Measured and calculated PEY O K-edge XANES spectra of corundum. Also provided are Al* 3s, 3p, 3d and O 2s, 2p pDOS results. | ||
Most importantly, one of the primary edge features (A) is not reproduced. Experimental spectra show three distinct peaks, A–C, with a shoulder D. The theoretical spectrum shows three peaks, tentatively ascribed as peaks B–D although this is ambiguous. However, shifting the theoretical spectrum ∼2 eV lower (equivalent to assigning these bands as A–C) shows an overall poorer agreement with experiment, resulting in less consistency in the intensities of assigned features and worse agreement in the transition energies of peaks E–H2. The possible origin of the unexplained peak A will be considered shortly. The scaled spectrum of the carbon tape background (Fig. S2, ESI†) makes it is clear that the pre-edge features p1 and p2 are artefacts and will not contribute appreciably to the spectrum of corundum. The inclusion of Al and O pDOS demonstrate that the edge is predominantly excitation into the O*(2p) valence band, which in turn coincide with features in the 3s, 3p, and 3d pDOS from directly-bonded Al atoms. This agrees with prior experiments that argue that the O K-edge is largely due to excitation of O 1s electrons into unoccupied O 2p states hybridized with the orbitals of the bonding atom.20,25,64–67 Our pDOS calculations provide some further detail, indicating that peak B is largely O*(2s)–Al(3s), peak D arguably O*(2s)–Al(3d), although peak C may be a complicated mixture with Al 3p and 3d states. However, no bands match peak A. This is therefore either due to a physical process not modelled with XSPECTRA, or is the consequence of a missing feature in our chosen supercell.
Finally, to benchmark Na K-edge spectra, experimental and simulated spectra for NaCl are provided in Fig. 3. As with the theoretical Al and O K-edge spectra, peaks ∼20–30 eV above the absorption edge tend to be a little more intense than their experimental counterparts. Otherwise, intensity and transition energies are in extremely good agreement. We identify 11 modes up to ∼25 eV above the absorption edge in the experimental spectra, with all reproduced in the modelled spectrum. Theory underestimates experimental energies very slightly, generally by at most 0.5 eV, in the labelled peaks. The pDOS calculations are again often consistent with crystal field splitting considerations. The pre-edge represents a a1g(1s) → a1g(3s) transition, again strictly forbidden in pure octahedral environments. However, a deviation from theory occurs with the strong edge features A and C, which we find are transitions into states of almost exclusively Na(3p) character. The otherwise triply degenerate Na(3p) states of t2g-symmetry, as understood through crystal field theory, are split on interaction with Cl 3s and 3p states, as seen between Al3+ and O2− in corundum.
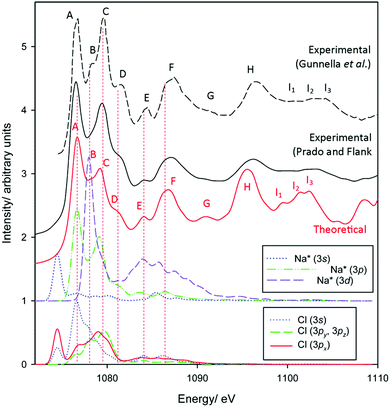 | ||
| Fig. 3 Measured and calculated Na K-edge XANES spectra of sodium chloride. Experimental data have been reproduced from Gunnella et al.68 and Prado and Flank.69 | ||
The Na(3d) state is also split into two distinct bands consistent with t2g and eg states. Excitation into the Laporte-forbidden t2g-like state shows a strong correspondence with peak B. This feature, somewhat observed experimentally, is observed most prominently in the measurements of Gunnella et al.68 This also coincides with bands in the Cl valence states, particularly in the 3s band. Given the highly symmetric environment in NaCl, this indicates that t2g-transitions do indeed exhibit non-zero intensity due to overlap with adjacent orbitals. This argues therefore that the B1/B2 peaks in the Al K-edge spectrum of corundum represent both split t1u(3p-like) and t2g(3d-like) transitions.
Peak D corresponds to transitions into a largely pure Na(3p) state. Features E and F may also represent transitions into Na(3p) states, now interacting with Cl 3s orbitals, and may also exhibit some contributions from eg(Na* 3d-like) bands, although the latter again should be dipole forbidden.
3.2. Geometry optimization of sodium-doped gibbsite.
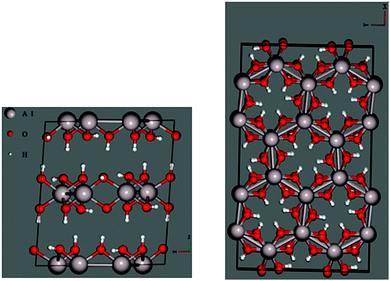
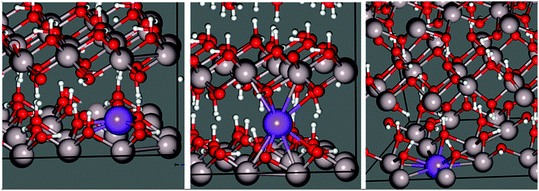
Before performing similar analyses on less-studied gibbsite, we must first locate the most thermodynamically stable crystallographic position for Na+ in a gibbsite matrix. In pure gibbsite, two broadly distinct sets of protons are observable (Fig. 4 left). These run either parallel to the c-axis, bonding AlO6 sheets together, or within the ab-plane. We refer to the former environment as inter-sheet, and the latter in-plane. The AlO6 sheets also possess a number of octahedral cation vacancies (Fig. 4 right). All are potential sites for sodium inclusion or intercalation.Replacing one proton of each class with Na+ leads to two sodium-substituted models, each necessarily losing symmetry as a consequence of substitution (Fig. 5). Geometric parameters after full cell optimization (Table 1) reveal little difference in the overall dimensions between the two structures or with those crystallographically determined for pure gibbsite. The in-plane sodium conformation is found to be 25.0 kJ mol−1 (0.259 eV) lower in energy than the inter-sheet structure. Therefore, if sodium intercalation does occur by way of proton replacement, it should be overwhelmingly present in the in-plane conformation. This agrees with the findings of the computational study of Lee et al.36
| Cell length/Å | Cell angle/° | E/Ry | |||||
|---|---|---|---|---|---|---|---|
| a | b | c | α | β | γ | ||
| Measured | 17.368 | 10.156 | 19.472 | 90.000 | 94.540 | 90.000 | n.a. |
| Inter-sheet | 17.482 | 10.224 | 19.456 | 90.083 | 92.748 | 89.919 | −6889.657 |
| In-plane | 17.519 | 10.232 | 19.375 | 90.042 | 92.803 | 89.958 | −6889.676 |
| Octahedral | 17.596 | 10.256 | 19.522 | 90.153 | 92.256 | 89.806 | −6924.413 |
A third stable intercalation mode is found in which sodium occupies an octahedral cation vacancy (Fig. 5 right). To conserve charge, an OH− counter-ion is initially placed in the inter-sheet region, modelled after the observed structure of lithium intercalated compounds.37,38 This means, however, that the energy of this structure cannot be directly compared with the hydrogen substitution models.
These structures differ considerably in terms of local coordination. Coordination polyhedra and their geometries are shown70 in Fig. 6. Inter-sheet sodium is located in the centre of a distorted trigonal prismatic oxygen polyhedron (bond lengths vary from 2.12–2.43 Å) with an effective coordination of 5.12. In-plane sodium, on the other hand, sits on the face, or just above the centre, of octahedral cation vacancy polyhedron, in the plane of the hydroxyl groups. It is primarily in a three-coordinate trigonal planar structure (in the face of the octahedron) with shorter Na–O distances of 2.08–2.15 Å. This is supported by an effective coordination number of 3.23. Deviations from 3.00 are due to more distant interactions (2.57–2.80 Å) with two additional oxygen atoms present in the underside of the Al-rich sheet, and is therefore quasi-five-fold coordinated. With its near-association with the octahedral vacancy, this environment could also be considered a highly distorted octahedral coordination.
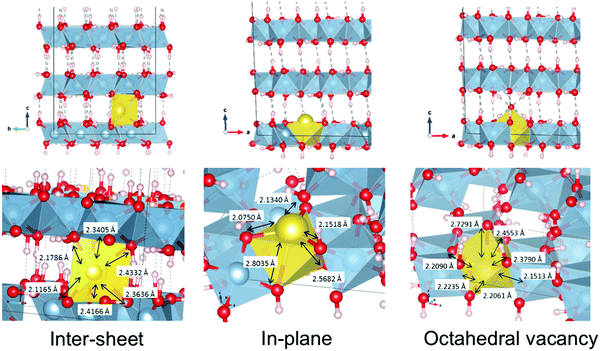 | ||
| Fig. 6 Geometries and coordination polyhedra of optimized intercalated sodium environments in gibbsite. | ||
In the explicitly octahedral environment itself, sodium recesses into the vacancy (in-plane with aluminium cations). However, the migration of the hydroxyl counter-ion during optimization ultimately results in an almost 7-fold coordination, although the effective coordination number of 5.65 reflects the long Na+–OH− bond length (2.73 Å). This close Na+–OH− proximity will be the lowest energy arrangement as the charges stabilize one another electrostatically.
Analogously, coordination of lithium by chloride counter-ions is found in gibbsite intercalation compounds with Li–Cl distances measured to be 3.75 Å.37 Average bond lengths are very similar, 2.31, 2.35, and 2.34 Å for inter-sheet, in-plane, and octahedral coordination respectively. However, the very different geometries should make the structures easy to differentiate in XANES spectroscopy.
3.3. Al K-edge spectra of gibbsite
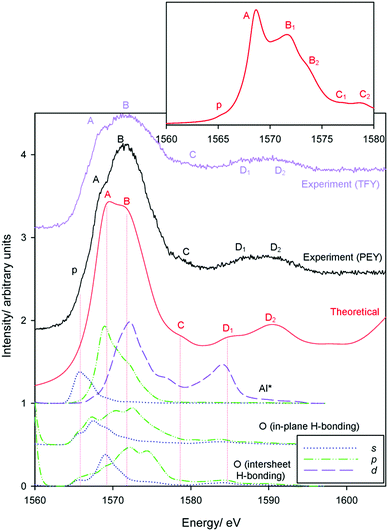
Local Al3+ geometries in gibbsite are, as in corundum, exclusively octahedral. Consequently, both compounds should exhibit very similar transitions. Local Al3+ environments are more disordered in gibbsite,59,71 broadening XANES transitions and obscuring similarities. Experimental spectra in both PEY and TFY modes are given in Fig. 7, and agree with previous measurements.72 Theory matches experiment very well, with all features of the PEY and TFY spectra modelled; a constant broadening term of 1.5 eV (compare with 0.6 eV with corundum) was employed to account for greater local disorder.The barely resolved measured pre-edge feature p at 1566 eV appears poorly described by theory, but is well described when applying a narrower broadening factor (0.6 eV – Fig. 7 inset). Measured transitions A–D are all very well described, with theory helping to highlight transition C that is otherwise difficult to discern experimentally.
Theoretically narrowing peaks beyond that achievable experimentally (Fig. 7 inset) highlights the close correspondence between Al absorption features in corundum (Fig. 1) and gibbsite. For example, peak B splits into two transitions in gibbsite, also seen in corundum. This correspondence indicates that band assignments of Li et al.58 for corundum may be directly applicable to gibbsite – see Table 2. The Al*(3s) band maximum coincides with peak p, again indicating a symmetry forbidden a1g(1s) → a1g(3s) transition for octahedrally coordinated Al3+. The strong edge transition (peak A) at 1568.5 eV is primarily Al(3p) in nature, but (as with corundum and NaCl) exhibits coincidence with O(2s) bands. In this system, we recognise each hydroxyl group and the associated O-atom may exist in differing environments particularly depending on whether it participates in in-plane or intersheet H-bonding. As also seen in corundum, the Al*(3p) states mix to form Al*(3p)–O(2s) and Al*(3p)–O(2p) bands, the latter coinciding with both peak B and a t2g(3d-like) band. The narrower bands in Fig. 7 (inset) suggests an additional peak between A and B1, arguing that the resonances between ∼1570–1575 eV are a consequence of both Al*(3p)–O(2p) and t2g(Al* 3d-like) transitions.
| Peak label corundum (gibbsite) | E (corundum)/eV | E (gibbsite)/eV | Assignment | Source |
|---|---|---|---|---|
| p (p) | 1566.0 | 1566 | a1g(1s) → a1g(3s-like) | K-edge58 |
| A (A) | 1568.7 | 1568.5 | a1g(1s) → t1u(3p-like) | K-edge58 |
| B1, B2 (B) | 1572.2, 1573.5 | 1571 | a1g(1s) → t2g(3d-like)/ | K-edge58 |
| a1g(1s) → Al*(3p)–O(2p) | This work | |||
| C (C) | 1576.3 | 1578 | Multiple scattering | K-edge58 |
| E (D) | 1582.2 | ∼1585 | a1g(1s) → eg(3d-like) | L-edge64 |
Peak C (1578 eV) does not show a strong correlation with electronic states. This again suggests a lack of a well-defined electronic transition, consistent with prior experimental assignments as ‘multiple scattering events’. Peak D1 has some Al*(3d)-character, consistent with an eg(Al* 3d-like) band. However, this is not the primary contribution to the D1/D2 peaks, which similarly lack a clear correspondence with electronic transitions, and noting the a1g → eg transition should be dipole forbidden.
3.4. O K-edge spectra of gibbsite
Oxygen environments are significantly more complicated due to their involvement with a range of possible hydrogen bonding interactions. Such coordination differences are highlighted in Fig. 8 for several representative, but not exhaustive, examples. Simulated spectra were generated assuming a broadening factor of 1.0 eV, and an averaged spectrum was computed from these with weightings chosen in order to best match experiment (Fig. 9). All spectra were treated with the same energy offset prior to averaging, which was chosen by aligning the peak B maximum of the averaged curve with measurement.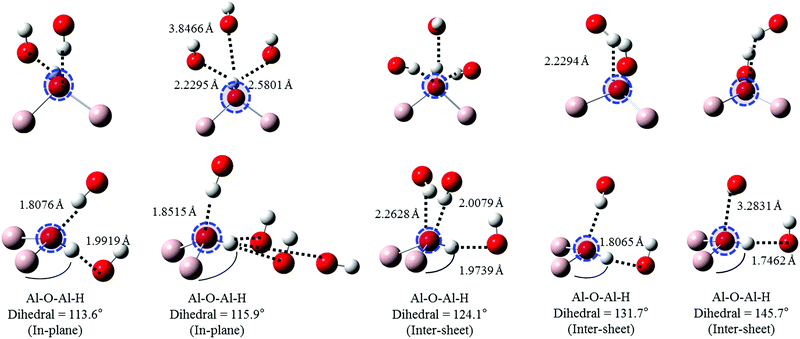 | ||
| Fig. 8 Local geometries of the oxygen atoms used in simulations of gibbsite O K-edge spectra as a function of increasing (covalently bonded) Al–O–Al–H dihedral angle. Excited atom is circled. | ||
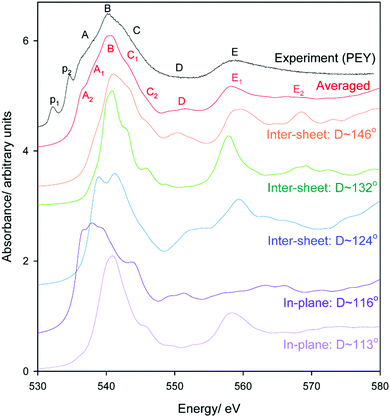 | ||
| Fig. 9 Experimental and simulated O K-edge spectra of gibbsite as a function of Al–O–Al–H dihedral angle D. An averaged spectrum is also provided; note the contribution of the D ∼ 116° is slightly over-represented to better match experiment as the selection in Fig. 8 is not necessarily reflective of the oxygen populations of gibbsite. | ||
Regarding local structure, all oxygen atoms are threefold coordinated. The Al–O–Al–H dihedral angle for inter-sheet interactions is found to range between ∼126.1–143.5°, generally more planar than in-plane coordination at 113.6–125.9°. However, the influence of dihedral angle, and consequently the change from inter-sheet to in-plane bonding, is minimal. The local geometries of oxygen with widely disparate dihedral angles of ∼114, ∼132, and ∼146° all appear to be similar (Fig. 8), with each involved in a single H-bonding acceptor interaction with the absorbing oxygen, and one H-bonding donor interaction with its associated proton. Individual spectra (Fig. 9) for these three environments all exhibit the intense edge feature B at ∼540 eV and transition E at 558 eV. Peaks C (∼545 eV) and E2 (∼570 eV) may intensify somewhat with increasing dihedral angle, however this trend isn’t clear cut.
The number and directionality of H-bonds are found to be significantly more influential than dihedral angle on absorption cross-section. The inter-sheet coordination environment with Al–O–Al–H dihedral ∼124° now sees the edge feature split into two. This corresponds with geometry changes in which the absorbing oxygen now accepts two H-bonds rather than one. The new edge peak shifts to lower energy, ∼539 eV, thereby contributing to the broad feature A in Fig. 9 that is not described by the single acceptor/donor H-bond environments described above.
Features are perturbed significantly more in the Al–O–Al–H dihedral D ∼ 116° geometry. In this case, the absorbing oxygen still accepts one H-bond, but now the associated hydrogen participates in 2–3 donor interactions. This subtle change sees peak E (560 eV) vanish and edge feature B split into 3–4 new peaks, all shifted to lower energy. This largely describes the measured A feature. In addition this H-bonding interaction also predicts a feature between C1 and C2 that helps to broaden region C in a manner consistent with the broad and featureless peak seen experimentally. It should be stressed that these major shifts arise from a difference in the H-bonding interactions of the proton, and not the absorbing oxygen itself. This is consistent with previous claims that oxygen is extremely sensitive to its local bonding interactions.72
To explore this splitting more deeply, partial XANES spectra in the 114° and 116° arrangements are explored in greater detail in Fig. 10. In the 114° geometry, the single edge peak is described by transitions into O 2p states with some overlap with O 1s and the adjacent H 1s states. An antibonding orbital (pointing along the [010] direction) of the O 2s/2py states with H 1s states provides the basis for a very weakly allowed pre-edge-like transition.
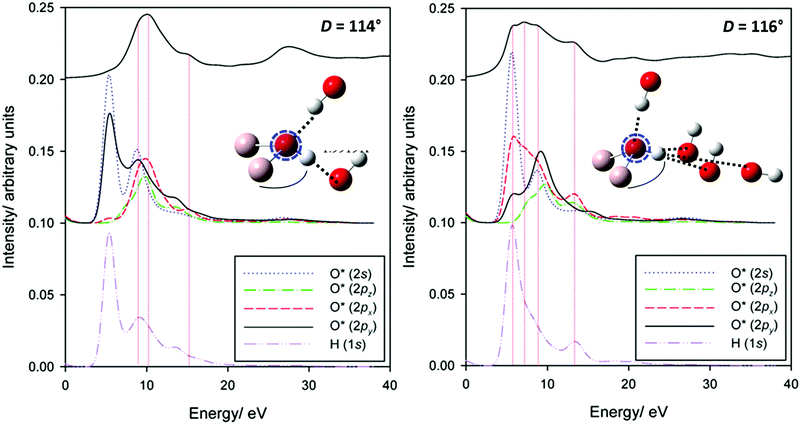 | ||
| Fig. 10 Partial O K-edge spectra for centres involved in either one (left) or three (right) hydrogen bonds. | ||
Contrast this with the 116° geometry system, where the O–H bond is now directed in the [110]-direction. The O 2px and O 2py bands are much broader, due to the H-bonding interactions in the ab-plane. The additional transitions involve these orbitals. Also important appears to be the local reduction of symmetry, relaxing selection rules. In addition to the broadening and shifting to lower energy in the low symmetry environment of the 2p-antibonding states commonly argued to dominate O K-edge structure, transitions into otherwise forbidden O 2s-dominated states are also now allowed. Finally, it is worth noting that band broadening with H-bonding interactions may be an explanation of the missing transition in O K-edge spectra of corundum (Fig. 2). That is, it is possible that a surface effect is necessary here. This may suggest surface hydrogenation. Further work is planned to explore this more deeply.
3.5. Na K-edge spectra for gibbsitic sodium impurities
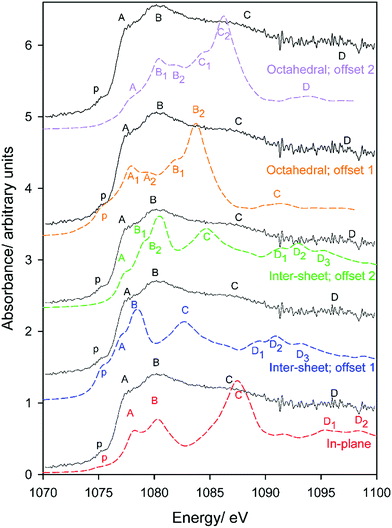
Finally, we address sodium impurities in gibbsite. While it has been speculated that it is intercalated within the sheet-like structure of the host hydroxide, with the replacement of protons by Na+ a likely candidate,34–36 to our knowledge there is no direct observation to verify this hypothesis.In Section 3.2 we suggested that the very different coordination environments observed for inter-sheet, in-plane, and octahedral vacancy sodium should provide distinctive XANES spectra. Simulated and experimental spectra are provided in Fig. 11. The local disorder noted in the optimized structures leads to the presence of what we interpret, in the first instance, as a weak pre-edge feature in all simulated spectra. With this assignment (offset 1), simulations of both the (higher energy) inter-sheet and octahedral vacancy models demonstrate poor agreement with experiment. In the inter-sheet model, feature A largely agrees, but features B, C, and D are ∼1, ∼3.5, and ∼5 eV lower than their corresponding measured transitions. The octahedral model shows good agreement for peaks p and A, however correspondences with other transitions become increasingly poor and ambiguous.
On the other hand, extremely good agreement is found in the energetically favourable in-plane conformation, with all transitions identified and exhibiting less than ∼0.5 eV deviation from measured energies. Transition intensities are in fair agreement when assuming a constant line broadening parameter of 0.6 eV, with higher energy transitions more intense. This strongly supports the possibility that sodium, and potentially other monovalent impurities, can replace H+ when intercalated or otherwise occluded within gibbsite.
The assumption that the lowest energy simulated transition corresponds with the measured pre-edge feature p at 1075.3 eV could arguably discriminate against the other models. A second energy offset (offset 2) to instead align the most intense transition B was therefore also considered. While the edge transitions now (unsurprisingly) agree reasonably well in the inter-sheet model, the pre-edge is necessarily missing and energies of transitions C and D at ∼1087 and 1097 eV experimentally are still underestimated by ∼2 and ∼4 eV. Even in this best-case scenario, simulations are still in poor agreement with measured spectra, which suggests the relative instability of this arrangement over the in-plane intercalation mode. The octahedral model shows much closer agreement when aligning the edge maxima, but ultimately predicts unobserved features (although these are potentially obscured experimentally by line broadening), under-predicts the energies of transitions at 1087 and 1097 eV by ∼1 and 4 eV respectively, and leaves the pre-edge unexplained. Therefore, only the in-plane geometry provides good agreement with experiment, and is indeed is also the most thermodynamically stable phase.
Finally, we make assignments for the experimental transitions Fig. 12. The in-plane intercalation model sees sodium almost recess into an octahedral vacancy and as such shows similarities with assignments for Al3+ in corundum and gibbsite as well as Na+ in NaCl. The weak pre-edge again corresponds with transition into Na+(3s) states (an a1g(1s) → a1g(3s) transition). The edge transition is primarily Na* 3p in nature, and B the overlap of a split Na* 3p state and a Na* 3d band.
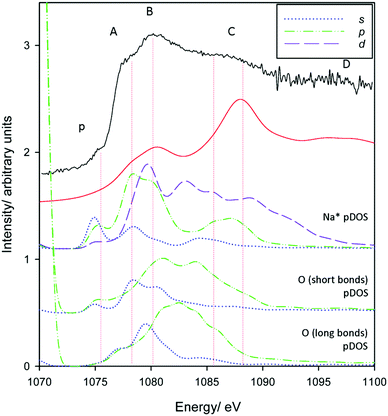 | ||
| Fig. 12 pDOS calculations for Na* 3s, 3p and 3d bands for the preferred in-plane intercalation model. Also included are the O 2s and O 2p bands from the short distance (∼2.1 Å) and long distance (2.5–2.8 Å) Na*–O bond lengths (see Fig. 6 centre). A broadening parameter of 1.5 eV is used. | ||
Oxygen atoms in the three shorter length Na–O interactions (Fig. 6 centre) in the highly distorted environment also appear to participate in the spectrum, whereas the longer bonds contribute to a much lesser extent. O 2s contributions to peak A are evident, and there appear to be both O 2s and 2p contributions to peak B. Peak C shows some coincidence with Na* 3p and 3d states with increasingly less contribution from O atoms, although may be purely ‘multiple scattering’. Peak D does not appear to match any obvious electronic transitions, and as such is also primarily multiple scattering.
4. Conclusions
Al, O, and Na-K-edge XANES spectra have been analysed for Bayer gibbsite, a common precursor for many commercial alumina products. Aluminium cations are unsurprisingly found to exhibit transitions almost indistinguishable from those in corundum, consistent with observations that spectra of metallic species are dictated by local coordination (crystal field interactions). We confirm previous assignments by referencing against pDOS calculations. However, we make the additional assignment for the peak in octahedrally coordinated cation generally assigned as a1g(1s) → t2g(3d-like) in K-edge spectra. This strongly overlaps with the presumably t1u(3p-like) bands mixing with host (or, under a crystal field theory interpretation, ligand) 2p orbitals at least in the case of oxides and chlorides. The t2g(3d-like) transitions, which are strictly Laporte forbidden, are allowed due to overlap with host/ligand orbitals. The corresponding eg(3d-like) transitions are too high in energy for significant overlap with host/ligand states and therefore transitions are much weaker.Oxygen spectra, on the other hand, are very sensitive to immediate bonding interactions. Successful simulation from first principles for gibbsite requires averaging over representative bonding scenarios, particularly those associated with differing hydrogen bonding interactions. Subtle differences in the H-bonding environment felt by the protons allows for H 1s–O 2s/O 2p mixing, broadening the O*(2p) bands responsible for the edge and allowing otherwise forbidden O 1s → O 2p transitions. An unexplained feature in simulated O K-edge spectra of corundum could potentially arise from analogous O–H interactions, and therefore could be explicitly due to surface chemistry, but this will have to be addressed in future works.
Finally, Na K-edge spectra have been used as a fingerprint to identify the likely coordination environment of sodium impurities. We argue that sodium effectively occupies octahedral cation vacancies within the Al-rich sheets, although lies slightly above the Al-plane as intercalation occurs by replacement of a hydrogen. This confirms prior theoretical predictions.36
Conflicts of interest
There are no conflicts to declare.Acknowledgements
The authors gratefully acknowledge the assistance of Dr Lars Thomsen, Dr Anton Tadich, and Dr Bruce Cowie of the Australian Synchrotron for assistance in collection of XANES spectra. We also thank the New Zealand Synchrotron Group for financial support during the measurement campaign. AC thanks the University of Auckland for financial support through a UoA Doctoral Scholarship. The authors are also very grateful for the support provided by NeSI in accessing high-performance computing facilities.Notes and references
- C. Morterra and G. Magnacca, Catal. Today, 1996, 27, 497–532 CrossRef.
- M. Trueba and S. P. Trasatti, Eur. J. Inorg. Chem., 2005, 3393–3403 CrossRef.
- P. J. Chupas and C. P. Grey, J. Catal., 2004, 224, 69–79 CrossRef.
- O. Boese, W. E. S. Unger, E. Kemnitz and S. L. M. Schroeder, Phys. Chem. Chem. Phys., 2002, 4, 2824–2832 RSC.
- R. Feng, S. Liu, P. Bai, K. Qiao, Y. Wang, H. A. Al-Megren, M. J. Rood and Z. Yan, J. Phys. Chem. C, 2014, 118, 6226–6234 CrossRef.
- Z. M. El-Bahy, R. Ohnishi and M. Ichikawa, Appl. Catal., B, 2003, 40, 81–91 CrossRef.
- S. Jagtap, M. K. N. Yenkie, N. Labhsetwar and S. Rayalu, Microporous Mesoporous Mater., 2011, 142, 454–463 CrossRef.
- A. Bhatnagar, E. Kumar and M. Sillanpää, Chem. Eng. J., 2011, 171, 811–840 CrossRef.
- J. Cheng, X. Meng, C. Jing and J. Hao, J. Hazard. Mater., 2014, 278, 343–349 CrossRef PubMed.
- D. Dayananda, V. R. Sarva, S. V. Prasad, J. Arunachalam and N. N. Ghosh, Chem. Eng. J., 2014, 248, 430–439 CrossRef.
- C. Yang, L. Gao, Y. Wang, X. Tian and S. Komarneni, Microporous Mesoporous Mater., 2014, 197, 156–163 CrossRef.
- G. J. McIntosh, G. E. K. Agbenyegah, M. M. Hyland and J. B. Metson, Langmuir, 2015, 31, 5387–5397 CrossRef PubMed.
- G. J. McIntosh, G. E. K. Agbenyegah, M. M. Hyland and J. B. Metson, JOM, 2016, 68, 2463–2471 CrossRef.
- G. J. McIntosh, J. B. Metson, T. Niesenhaus, T. Reek and L. M. Perander, JOM, 2014, 66, 2272–2281 CrossRef.
- J. Frenzel, A. F. Oliveira, H. A. Duarte, T. Heine and G. Seifert, Z. Anorg. Allg. Chem., 2005, 631, 1267–1271 CrossRef.
- A. W. P. Vermeer, J. K. McCulloch, W. H. van Riemsdijk and L. K. Koopal, Environ. Sci. Technol., 1999, 33, 3892–3897 CrossRef.
- J. Rosenqvist, P. Persson and S. Sjöberg, Langmuir, 2002, 18, 4598–4604 CrossRef.
- F. Granados-Correa and J. Jiménez-Becerril, J. Hazard. Mater., 2009, 162, 1178–1184 CrossRef PubMed.
- X. Krokidis, P. Raybaud, A.-E. Gobichon, B. Rebours, P. Euzen and H. Toulhoat, J. Phys. Chem. B, 2001, 105, 5121–5130 CrossRef.
- G. J. McIntosh, J. B. Metson and M. M. Hyland, Surf. Interface Anal., 2017, 49, 1351–1358 CrossRef.
- F.-S. Yen, P.-L. Cheng, H.-Y. Huang and T.-C. Lin, J. Am. Ceram. Soc., 2009, 92, 2089–2092 CrossRef.
- C. Pecharromán, I. Sobrados, J. E. Iglesias, T. González-Carreño and J. Sanz, J. Phys. Chem. B, 1999, 103, 6160–6170 CrossRef.
- Y. Kato, K.-i. Shimizu, N. Matsushita, T. Yoshida, H. Yoshida, A. Satsuma and T. Hattori, Phys. Chem. Chem. Phys., 2001, 3, 1925–1929 RSC.
- L. A. O’Dell, S. L. P. Savin, A. V. Chadwick and M. E. Smith, Solid State Nucl. Magn., 2007, 31, 169–173 CrossRef PubMed.
- E. O. Filatova, A. S. Konashuk, F. Schaefers and V. V. Afanas’ev, J. Phys. Chem. C, 2016, 120, 8979–8985 CrossRef.
- M. Digne, P. Raybaud, P. Sautet, D. Guillaume and H. Toulhoat, Phys. Chem. Chem. Phys., 2007, 9, 2577–2582 RSC.
- K. Jirátová and L. Beránek, Appl. Catal., 1982, 2, 125–138 CrossRef.
- P. Berteau, M.-A. Kellens and B. Delmon, J. Chem. Soc., Faraday Trans., 1991, 87, 1425–1431 RSC.
- S. Srinivasan, C. R. Narayanan, A. Biaglow, R. Gorte and A. K. Datye, Appl. Catal., A, 1995, 132, 271–287 CrossRef.
- G. J. McIntosh, H. Wijayaratne, G. E. K. Agbenyegah, M. M. Hyland and J. B. Metson, Light Metals. TMS The Minerals, Metals & Materials Series, Springer International Publishing, Cham, 2018, 533–539 Search PubMed.
- G. J. McIntosh, H. Wijayaratne, A. Chan, L. Perander and M. Hyland, Acta Mater., 2018, 153, 226–234 CrossRef.
- R. G. Haverkamp, J. B. Metson, M. M. Hyland and B. J. Welch, Surf. Interface Anal., 1992, 19, 139–144 CrossRef.
- Y. Y. Park, S. O. Lee, T. Tran, S. J. Kim and M. J. Kim, Int. J. Miner. Process., 2006, 80, 126–132 CrossRef.
- N. I. Eremin, M. I. Cherepanova and M. A. Maksakova, Sov. Non-Ferrous Met. Res., 1980, 8, 263–266 Search PubMed.
- N. I. Eremin, M. I. Cherepanova, N. S. Shmorgunenko and M. A. Maksakova, Sov. Non-Ferrous Met. Res., 1980, 8, 132–135 Search PubMed.
- M.-Y. Lee, A. L. Rohl, J. D. Gale, G. M. Parkinson and F. J. Lincoln, Trans. IChemE Part A, 1996, 74, 739–743 Search PubMed.
- A. V. Besserguenev, A. M. Fogg, R. J. Francis, S. J. Price, D. O'Hare, V. P. Isupov and B. P. Tolochko, Chem. Mater., 1997, 9, 241–247 CrossRef.
- S.-L. Wang, C.-Y. Cheng, Y.-M. Tzou, R.-B. Liaw, T.-W. Chang and J.-H. Chen, J. Hazard. Mater., 2007, 147, 205–212 CrossRef PubMed.
- B. C. C. Cowie, A. Tadich and L. Thomsen, AIP Conf. Proc., 2010, 1234, 307–310 CrossRef.
- E. Gann, C. R. McNeill, A. Tadich, B. C. C. Cowie and L. Thomsen, J. Synchrotron Radiat., 2016, 23, 374–380 CrossRef PubMed.
- M. Taillefumier, D. Cabaret, A.-M. Flank and F. Mauri, Phys. Rev. B: Condens. Matter Mater. Phys., 2002, 66, 195107 CrossRef.
- C. Gougoussis, M. Calandra, A. P. Seitsonen and F. Mauri, Phys. Rev. B: Condens. Matter Mater. Phys., 2009, 80, 075102 CrossRef.
- P. E. Blöchl, Phys. Rev. B: Condens. Matter Mater. Phys., 1994, 50, 17953–17979 CrossRef.
- D. Vanderbilt, Phys. Rev. B: Condens. Matter Mater. Phys., 1990, 41, 7892–7895 CrossRef.
- R. Haydock, V. Heine and M. J. Kelly, J. Phys. C, 1975, 8, 2591 CrossRef.
- J. J. Rehr and A. L. Ankudinov, Coord. Chem. Rev., 2005, 249, 131–140 CrossRef.
- C. Wei, Z. Feng, G. G. Scherer, J. Barber, Y. Shao-Horn and Z. J. Xu, Adv. Mater., 2017, 29, 1606800 CrossRef PubMed.
- V. Bilovol, A. V. Gil Rebaza, A. M. Mudarra Navarro, L. Errico, M. Fontana and B. Arcondo, Appl. Surf. Sci., 2017, 425, 1066–1073 CrossRef.
- A. K. Sinha, M. N. Singh, S. N. Achary, A. Sagdeo, D. K. Shukla and D. M. Phase, J. Magn. Magn. Mater., 2017, 435, 87–95 CrossRef.
- G. Della Ventura, F. Galdenzi, G. Cibin, R. Oberti, W. Xu, S. Macis and A. Marcelli, Phys. Chem. Chem. Phys., 2018, 20, 21764–21771 RSC.
- J. P. Perdew, K. Burke and M. Ernzerhof, Phys. Rev. Lett., 1996, 77, 3865–3868 CrossRef PubMed.
- P. Giannozzi, O. Andreussi, T. Brumme, O. Bunau, M. B. Nardelli, M. Calandra, R. Car, C. Cavazzoni, D. Ceresoli, M. Cococcioni, N. Colonna, I. Carnimeo, A. D. Corso, S. D. Gironcoli, P. Delugas, J. R. A. DiStasio, A. Ferretti, A. Floris, G. Fratesi, G. Fugallo, R. Gebauer, U. Gerstmann, F. Giustino, T. Gorni, J. Jia, M. Kawamura, H. Y. Ko, A. Kokalj, E. Küçükbenli, M. Lazzeri, M. Marsili, N. Marzari, F. Mauri, N. L. Nguyen, H. V. Nguyen, A. Otero-de-la-Roza, L. Paulatto, S. Poncé, D. Rocca, R. Sabatini, B. Santra, M. Schlipf, A. P. Seitsonen, A. Smogunov, I. Timrov, T. Thonhauser, P. Umari, N. Vast, X. Wu and S. Baroni, J. Phys.: Condens. Matter, 2017, 29, 465901 CrossRef PubMed.
- G. Paolo, B. Stefano, B. Nicola, C. Matteo, C. Roberto, C. Carlo, C. Davide, L. C. Guido, C. Matteo, D. Ismaila, C. Andrea Dal, G. Stefano de, F. Stefano, F. Guido, G. Ralph, G. Uwe, G. Christos, K. Anton, L. Michele, M.-S. Layla, M. Nicola, M. Francesco, M. Riccardo, P. Stefano, P. Alfredo, P. Lorenzo, S. Carlo, S. Sandro, S. Gabriele, P. S. Ari, S. Alexander, U. Paolo and M. W. Renata, J. Phys.: Condens. Matter, 2009, 21, 395502 CrossRef PubMed.
- D. Cabaret, P. Sainctavit, P. Ildefonse and A.-M. Flank, J. Phys.: Condens. Matter, 1996, 8, 3691–3704 CrossRef.
- R. Nemausat, B. Ch, G. Ch and D. Cabaret, J. Phys.: Conf. Ser., 2016, 712, 012006 CrossRef.
- D. Cabaret, E. Gaudry, M. Taillefumier, P. Sainctavit and F. Mauri, Phys. Scr., 2005, 131 CrossRef.
- D. Cabaret and C. Brouder, J. Phys.: Conf. Ser., 2009, 190, 012003 CrossRef.
- D. Li, G. M. Bancroft, M. E. Fleet, X. H. Feng and Y. Pan, Am. Mineral., 1995, 80, 432–440 Search PubMed.
- P. Ildefonse, D. Cabaret, P. Sainctavit, G. Calas, A.-M. Flank and P. Lagarde, Phys. Chem. Miner., 1998, 25, 112–121 CrossRef.
- A. Mottana, T. Murata, A. Marcelli, G. Della Ventura, G. Cibin, Z. Wu and R. Tessadri, J. Appl. Crystallogr., 1998, 31, 890–898 CrossRef.
- J. L. Dehmer, J. Chem. Phys., 1972, 56, 4496–4504 CrossRef.
- C. Weigel, G. Calas, L. Cormier, L. Galoisy and G. S. Henderson, J. Phys.: Condens. Matter, 2008, 20, 135219 CrossRef.
- J. A. V. Bokhoven, T. Nabi, H. Sambe, D. E. Ramaker and D. C. Koningsberger, J. Phys.: Condens. Matter, 2001, 13, 10247 CrossRef.
- E. O. Filatova and A. S. Konashuk, J. Phys. Chem. C, 2015, 119, 20755–20761 CrossRef.
- E. O. Filatova, A. S. Konashuk, S. S. Sakhonenkov, A. A. Sokolov and V. V. Afanas’ev, Sci. Rep., 2017, 7, 4541 CrossRef PubMed.
- H. Y. Huang, R. T. Yang, D. Chinn and C. L. Munson, Ind. Eng. Chem. Res., 2003, 42, 2427 CrossRef.
- G. S. Henderson, D. R. Neuville and L. Cormier, Chem. Geol., 2009, 259, 54–62 CrossRef.
- R. Gunnella, M. Benfatto, A. Marcelli and C. R. Natoli, Solid State Commun., 1990, 76, 109–111 CrossRef.
- R. J. Prado and A. M. Flank, Phys. Scr., 2005, 165 CrossRef.
- K. Momma and F. Izumi, J. Appl. Crystallogr., 2011, 44, 1272–1276 CrossRef.
- H. Saalfeld and M. Wedde, Z. Kristallogr., 1974, 139, 129–135 CrossRef.
- Y. F. Hu, R. K. Xu, J. J. Dynes, R. I. R. Blyth, G. Yu, L. M. Kozak and P. M. Huang, Geochim. Cosmochim. Acta, 2008, 72, 1959–1969 CrossRef.
Footnote |
| † Electronic supplementary information (ESI) available: Corundum Al K-edge spectrum simulated without core-hole-inclusive pseudopotentials, and the O K-edge spectrum of carbon tape (background). See DOI: 10.1039/c8cp02463d |
| This journal is © the Owner Societies 2018 |

