
 Open Access Article
 This Open Access Article is licensed under a
 Creative Commons Attribution 3.0 Unported Licence
Liquid–liquid phase separation and evaporation of a laser-trapped organic–organic airborne droplet using temporal spatial-resolved Raman spectroscopy
Aimable
Kalume
a,
Chuji
Wang
b,
Joshua
Santarpia
c and
Yong-Le
Pan
 *a
*a
aU.S. Army Research Laboratory, 2800 Powder Mill Rd, Adelphi, MD 20783, USA. E-mail: yongle.pan.civ@mail.mil
bMississippi State University, Starkville, MS 39759, USA
cSandia National Laboratory, Albuquerque, NM 87123, USA
First published on 14th June 2018
Abstract
Chemical reactions in aerosol particles can occur between the reactive components of the particle or between the particle and its surrounding media. The fate of atmospheric aerosols depends on the environment, the composition and the distribution of components within a particle. It could be very interesting to see how a liquid aerosol particle behaves in ambient air if the particle is composed of mixed chemicals. Do the chemical components remain homogeneously mixed within a particle or separate as the mixed liquid is aerosolized? How do the chemicals within a droplet separate and interact with the air? In this paper, a single microdroplet formed from an organic–organic mixture of diethyl phthalate (DEPh) and glycerol was investigated using laser-trapped position-resolved temporal Raman spectroscopy. For the first time, we were able to directly observe the gradient distributions of the two chemicals at different positions within such an airborne droplet, their time-resolved processes of liquid–liquid phase-separation, and changes of the physical microstructure and chemical micro-composition in the droplet. The results revealed that DEPh migrated to the surface and formed an outer layer and glycerol was more concentrated in the interior of the droplet, DEPh evaporated faster than glycerol, and both organic chemicals within the mixed droplet evaporated faster than either of them within their pure droplets. This technique also provides a new method for studying the fine structure and chemical reactions of different molecules taking place inside a particle and at the interface of a particle with the surrounding microenvironment.
Introduction
Airborne aerosol particles play an important role in a wide variety of domains including the global climate, earth's radiation budget1–7 and human health.8–10 In the atmosphere, they are involved in atmospheric chemical reactions, such as ozone depletion6,11 and combustion processes.1,3,5 In the pharmaceutical industry, inhalation aerosol products are used to treat a wide variety of symptoms;8–10 and in household sprays, they are widely used in daily life.12–14 How these aerosols undergo reactions or interact with the surrounding media in each of the aforementioned scenarios depends on multiple parameters including the structural, composition, physical and chemical properties of the particles, as well as those of the surrounding environment. The interphase mass-transfer at the particle–medium interface, often comprising adsorption, desorption, solvation and surface reactions, is significantly pronounced in liquid particles.15 It could be very interesting to see whether the components within a droplet are still kept in a homogeneously mixed phase or separate from each other as a mixed liquid, which is formed by multiple chemicals, or are aerosolized into ambient air. If they go through a phase separation process, how do the chemicals within the droplet separate and interact with the air? Such fundamental questions continue to challenge the aerosol physical chemistry or chemical physics communities and remain an interesting subject of study.Over the past century, substantial experimental progress has been made on a better understanding of droplets resting on substrates.16–19 Some studies have focused on deciphering properties of multicomponent aerosols and probing the evaporation dynamics of mixed droplets in a controlled environment or inside a spray.18,20–22 You and co-workers22 demonstrated liquid–liquid phase separation in droplets containing organic compounds mixed with inorganic salts; they found that the separation process is related to the relative humidity and the oxygen-to-carbon (O![[thin space (1/6-em)]](https://www.rsc.org/images/entities/char_2009.gif) :C) elemental ratio of the droplet. The phase process was reported mostly for the cases where the ratio of oxygen to carbon O:C < 0.5 but not for when O:C ≥ 0.8. The same group, later, showed that the phase separation has no evident correlation to either temperature or molecular weight of the individual components of the mixture.21 Using chemical imaging techniques at the nanometer scale, O’Brien and co-workers20 showed that mixed organic–inorganic droplets were not homogenous; they rather presented a gradient of concentration with the most organic liquid located at the outer layer, due to a lower surface tension of the organic liquid than that of the inorganic liquid.
:C) elemental ratio of the droplet. The phase process was reported mostly for the cases where the ratio of oxygen to carbon O:C < 0.5 but not for when O:C ≥ 0.8. The same group, later, showed that the phase separation has no evident correlation to either temperature or molecular weight of the individual components of the mixture.21 Using chemical imaging techniques at the nanometer scale, O’Brien and co-workers20 showed that mixed organic–inorganic droplets were not homogenous; they rather presented a gradient of concentration with the most organic liquid located at the outer layer, due to a lower surface tension of the organic liquid than that of the inorganic liquid.
Recently, there have been quite a few reports23–31 on the study of phase separation in droplets suspended in air. Zhang et al.23 studied the hygroscopic properties of Mg(NO3)2 droplets, as they were levitated by an electrodynamic balance, using Raman spectroscopy. Kwamena et al.24 proposed a model to predict the equilibrium morphology of two immiscible aerosol phases and it was found to be in good agreement with a previously studied decane/NaCl/aqueous system by the same group.25 Corsetti et al.26 studied gasoline–ethanol mixed droplets and they reported that the longer lifetimes were correlated to higher ethanol concentrations. Recently, Gorkowski et al.27 utilized the Raman spectra of laser trapped organic–inorganic mixed droplets to distinguish various morphologies (homogenous droplets, core–shell and partially engulfing microstructures) of the droplet at different times by performing a meticulous fitting of morphology dependent Raman peaks. Marcolli and Krieger studied phase changes during the hygroscopic cycles of mixed organic/inorganic systems.28 Song et al. found the core–shell morphology to be the prevalent configuration of liquid–liquid-phase-separated tropospheric organic/AS/H2O particles.31 Freedman's group studied the phase separation in an organic aerosol, and they observed the size dependence of morphology for some systems in which large particles phase separate and small particles remain homogeneous.30,31
Direct spectroscopic methods, such as infrared or Raman spectroscopy, have proven to be useful for the chemical characterization of single-component liquid aerosols, however, the efficiency of these methods can be tempered by the complexity in the chemical composition of multicomponent aerosols.32 While phase separation studies have flourished in the case of organic–inorganic mixed droplets, there are few reports on organic–organic droplets, where Raman spectroscopy is further disfavored by similarities in vibrational modes for various organic compounds, resulting in low chemical specificity in terms of Raman shift. Gorkowski et al.33 demonstrated phase-separation in multicomponent droplets, made up of glycerol or a squalene core, coated with a shell of secondary organic aerosol. Other studies included characterizing spatial gradients in composition within phase separated particles, the properties of core–shell particles, and how this morphology and size affect the phase-separation and evaporation rates.28–30,34–37 In this paper, we studied single organic–organic airborne droplet systems using our recently developed laser-trapped position-resolved temporal Raman spectroscopy.38,39 The phase-separation and the evaporation processes in ambient air were observed from a mixed microdroplet formed by diethyl phthalate (DEPh), a simulant of the VX nerve agent, and glycerol at different initial volume ratios. The advanced spatial- and time-resolved Raman spectroscopy allows us to directly observe the morphology, phase-separation, and evaporation process within the multicomponent organic–organic microdroplet in a core–shell microstructure simultaneously.
Experimental setup
The experimental setup utilized in this work has been described previously,38,39 therefore, only the details pertinent to this study are given here. Diethyl phthalate (Sigma Aldrich, 99.5% purity) and glycerol (Sigma Aldrich, ≥99% purity) compounds were used as the test materials without further purification. Three liquid samples (mixtures of DEP–glycerol in 2:1, 1:1, and 1:2 initial volume ratios) were prepared and kept in 25 mL glass bottles. For each sample, droplets (average initial diameter of ∼20–22 μm) were generated using a low-temperature drop-on-demand single-jet piezoelectric dispensing device (Microfab MJ-ATP-01, 30 μm diameter orifice).
As shown in Fig. 1, the single droplet was trapped with a tightly focused 488 nm hollow laser beam, with an output power of ∼750 mW. After trapping, the scattered Raman signal was focused into a spectrograph (Princeton Instruments IsoPlane SCT-320) and dispersed by a 1200 grooves per mm grating with a blaze wavelength of 750 nm. Raman spectra were continuously recorded by using an electron-multiplying charge-coupled device (EMCCD, Princeton Instr., ProEM) in its image or graph mode. In order to monitor the dynamic process of the microdroplets in ambient air, imaging Raman spectra were periodically recorded every 15 s, and each of these images was integrated for 1 s for signal accumulation. The elastic scattering of 488 nm light within a scattered angle of 90° ± 2° was recorded by using a photomultiplier tube (PMT). Its intensity variation was used to compare with the simulated resonance scattering spectrum computed using the Lorenz–Mie theory for particle size determination.38 Under the experimental conditions, a magnified image of a 20 μm droplet formed an image on the EMCCD with a 100 pixel diameter. In order to record the Raman scattering image, a magnified image of the droplet is projected onto the entrance of the spectrograph and only a small slice is allowed to pass through a narrow slit (10 μm). Therefore, the vertical spatial position is achieved by selecting the Raman signal from different vertical pixels on the detector. Raman spectra from different horizontal positions were obtained by scanning the projected image across the narrow slit to cover different sampling slices horizontally. In such an arrangement, each pixel is equally corresponding to a 200 nm × 200 nm area size of the droplet in the geometry. However, the image resolution is restricted by the Abbe diffraction limit  , the best spatial resolution that we achieved was 600 nm from the droplet.
 | ||
| Fig. 1 Experimental setup for measuring position-resolved temporal Raman spectra and particle size from a laser-trapped single airborne aerosol particle. ASL: aspheric lens; CSM: concave spherical mirror; DBS: dichroic beam splitter; L: lens; LP: long-pass filter; M: mirror; MO: microscopic objective; PMT: photomultiplier tube. | ||
In the aerosolizing process, glycerol was premixed with methanol to allow it to go through the piezo-electric activated nozzle due to the high viscosity, within our standard operating conditions. Methanol was also used as a co-solvent to facilitate the mixing of glycerol and DEPh, which are practically immiscible. By varying the mixing ratio of methanol and the testing chemicals, we were able to change the initial size of the droplet of the testing chemicals. We had previously found that methanol, mixed with testing chemicals, evaporated quickly (on the order of a few milliseconds) during the aerosolizing and trapping process and its signals were not detected in the Raman spectrum of the trapped microdroplets. In the data recording process, a time delay of 1 min was set before collecting the spectra for the complete evaporation of methanol after a testing droplet was trapped.
Results and discussion
Fig. 2 shows the typical Raman spectra of a laser-trapped single-microdroplet, obtained from each of the three liquid samples: DEPh, glycerol, and the DEPh–glycerol mixture. These spectra were obtained from the whole central vertical slice of the droplet with all signals summed from all vertical positions to represent the spectral signature of the whole droplet. Despite the large similarities in the lower-frequency spectral region, which are due to the common vibrational modes in both DEPh and glycerol molecules, one can observe that there are a few diagnostic peaks inherent to the particular chemical bonding of each individual compound. On the one hand, glycerol has a broad band at around 3366 cm−1, resulting from the multiple peaks of the O–H stretching mode, which is absent in the molecular structure of DEPh. On the other hand, DEPh has a C![[double bond, length as m-dash]](https://www.rsc.org/images/entities/char_e001.gif) O stretching mode with a Raman shift observed at ∼1733 cm−1 and another peak at ∼3080 cm−1 from the C–H stretching mode localized on the aromatic benzene ring. As expected, the Raman spectrum of the mixed DEPh–glycerol droplet (top curve) possesses a combination of the signature peaks from both individual components. The morphology dependent resonances, also known as whispering gallery modes (WGMs), were observed over the O–H stretching band.
O stretching mode with a Raman shift observed at ∼1733 cm−1 and another peak at ∼3080 cm−1 from the C–H stretching mode localized on the aromatic benzene ring. As expected, the Raman spectrum of the mixed DEPh–glycerol droplet (top curve) possesses a combination of the signature peaks from both individual components. The morphology dependent resonances, also known as whispering gallery modes (WGMs), were observed over the O–H stretching band.
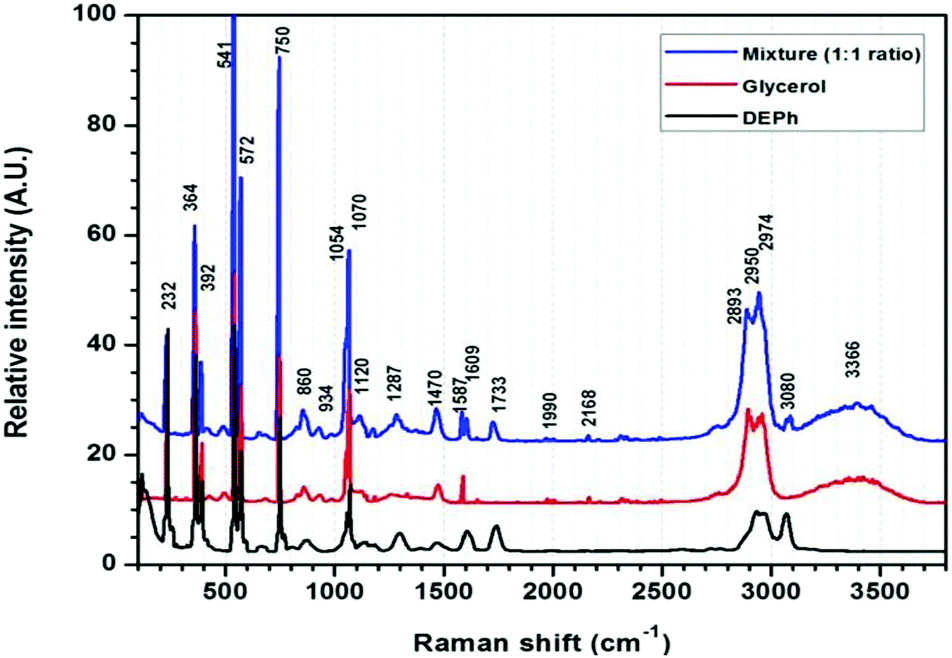 | ||
| Fig. 2 Raman spectra of the laser-trapped single droplets of DEPh, glycerol, and mixed DEPh–glycerol (1:1 initial ratio in volume). | ||
In the initial experiments, the evaporation of a mixed DEPh–glycerol microdroplet was monitored by continuously collecting Raman spectra at a 15 second interval, binning all the spectra vertically, which is the same as what the traditional single-particle laser-trapped Raman spectroscopy can provide. The representative time-resolved spectra for t = 1 min, 20 min, and 40 min are shown in Fig. 3(a). At the beginning (lower curve, time t = 1 min), the Raman spectrum exhibits a strong DEPh characteristic signal (∼1733 and 3080 cm−1 peaks, shaded in grey lines), which was highly attenuated at time t = 20 min and almost totally disappeared at time t = 40 min. In contrast, the glycerol signal (the broad band around 3366 cm−1, shaded in tiffany blue) decreases more slowly and shows little change in the first 20 min, as the evaporation got even slower after the DEPh peaks were cleared from the spectrum.
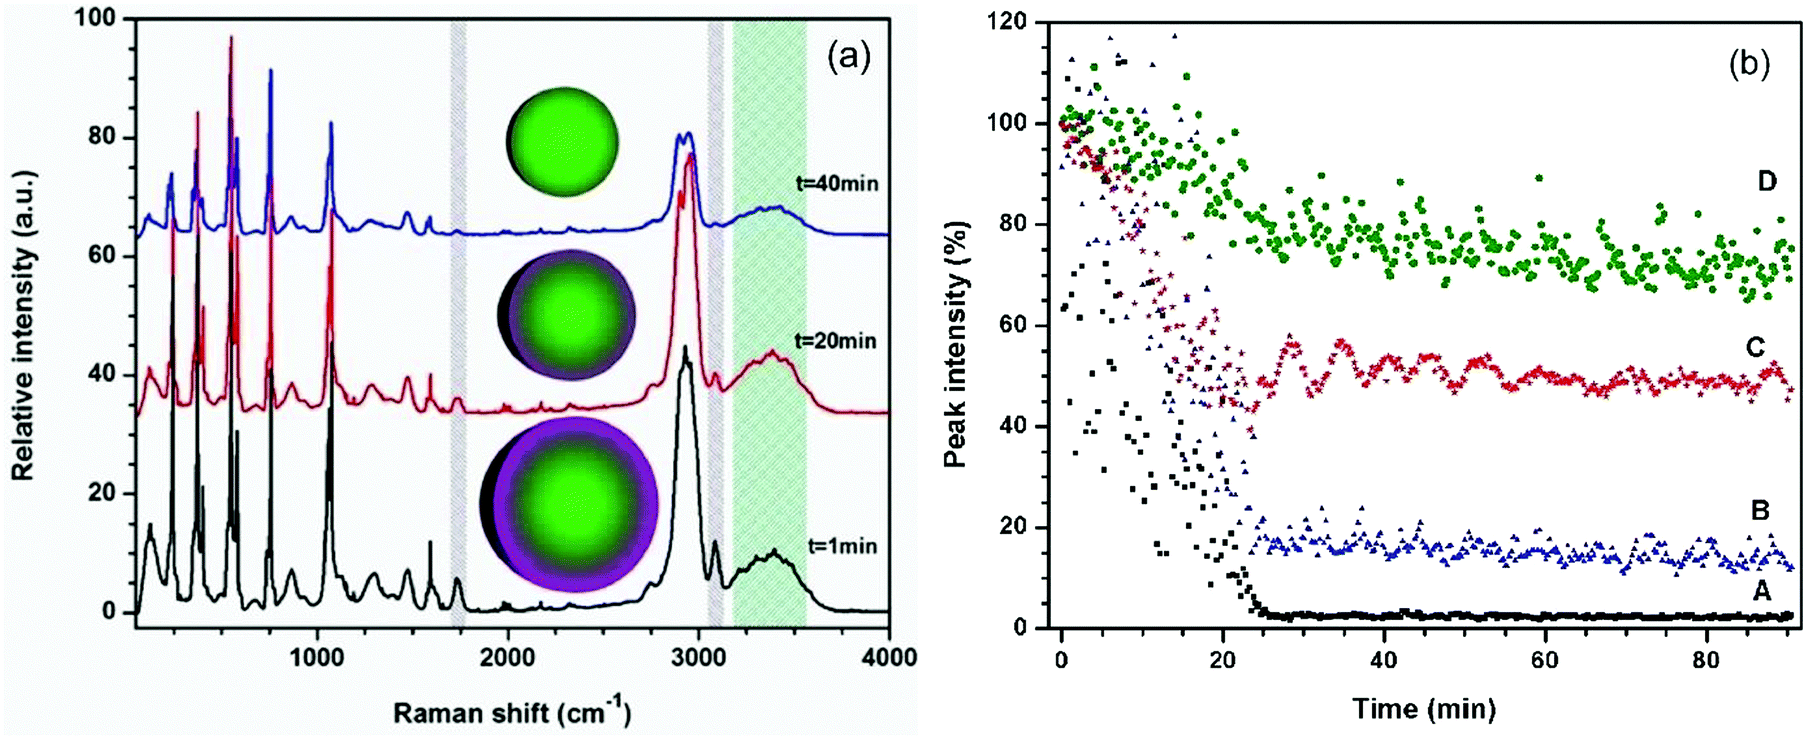 | ||
| Fig. 3 (a) Raman spectra recorded during the evaporation of a laser-trapped microdroplet of mixed DEPh–glycerol (initially 1:1 in volume ratio) at time t = 1 min, 20 min, and 40 min. (b) Relative intensity decays of the representative Raman peaks of a laser-trapped microdroplet: (A) the CO stretching at ∼1733 cm−1 from DEPh (shaded grey in (a)), (B) the C–H stretching at ∼3080 cm−1 from DEPh and partially from glycerol (shaded grey in (a)), (C) the CCC deformation stimulated Raman peak at ∼542 cm−1 from both DEPh and glycerol, and (D) the broad band around 3366 cm−1 from glycerol (shaded tiffany blue in (a)). | ||
The Raman intensities obtained from the characteristic peaks were measured and plotted against the evaporation time (with each initial peak intensity value set to 100%). As shown in Fig. 3(b), the Raman intensity of the DEPh CO stretching at ∼1733 cm−1 (lower black curve A) decreased at a faster rate (slope = −0.050% s−1), reached a minimum value <1%, and remained at such a value after 25 min of evaporation in ambient air. Note that in the beginning, the DEPh signal intensity was also subject to large amplitude fluctuations, due to the excitation-wavelength resonances40 within the droplet, which happen when the electromagnetic field of the excitation laser is in resonance with the micro-cavity of the droplet at a certain wavelength (see more detail in Fig. 4). A similar rapid decrease (slope = −0.052% s−1) in peak intensity was observed in the C–H stretching at ∼3080 cm−1 from DEPh (middle blue curve B), although the final value did not reach <1%, due to the overlap with the intensities from the neighbouring aliphatic C–H peak and the O–H broad band of glycerol. For most of the peaks in the low frequency region that are from the contribution of about half DEPh and half glycerol, such as the CCC deformation stimulated Raman peak ∼542 cm−1 (middle red curve C), a fast decay rate (slope = −0.043% s−1) was initially observed, then about 50% remained with a slow decay rate similar to that of glycerol (slope = −0.001% s−1). In contrast, the decrease in the Raman band intensity, only from glycerol, at around 3366 cm−1 decreased at a slower rate with a slope = −0.012% s−1 (top green curve D) initially, which is 5 times slower than that of DEPh. After the evaporation of the DEPh shell, the signal from glycerol with some remaining DEPh continued to decrease at a much slower rate (slope = −0.002% s−1), which is comparable to that of the single component glycerol droplet (slope = −0.003% s−1), as shown in Table 1.
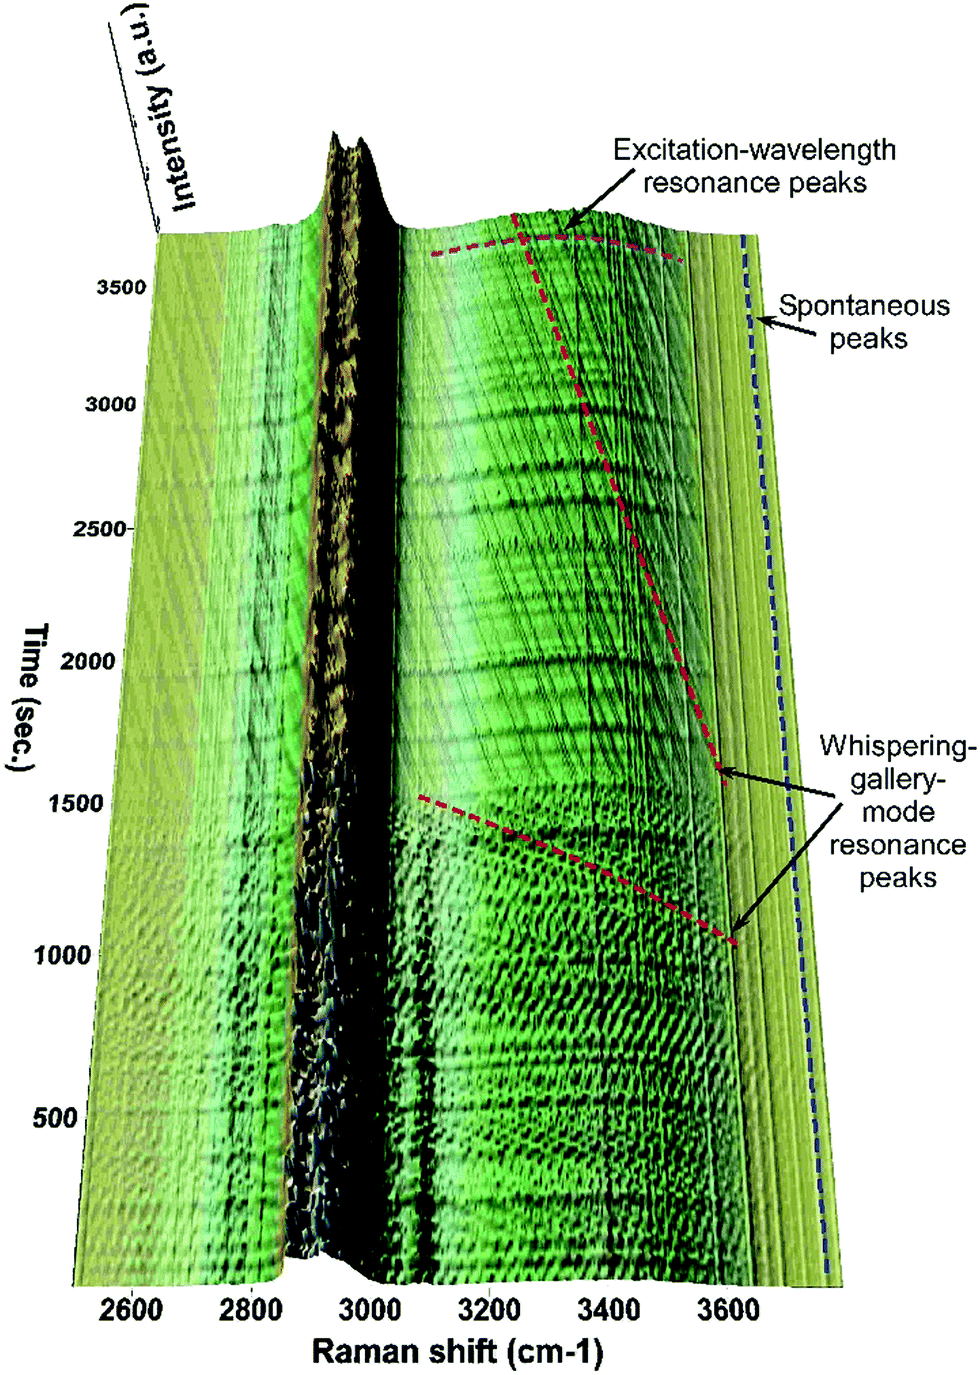 | ||
| Fig. 4 Time-resolved Raman spectra showing the temporal dynamics of the spontaneous and resonance Raman peaks taking place during the evaporation of a mixed DEPh–glycerol droplet. | ||
| Raman shift (cm−1) | Assignment (curve in Fig. 3(b)) | Origin | Ratea (% s−1) | Rateb (% s−1) |
|---|---|---|---|---|
| Note: S.R.S: stimulated Raman scattering; mix: mixed DEPh–glycerol microdroplet; pure: a droplet formed of one pure chemical.a Rate: the first 25 min of the evaporation process with mixed DEPH and glycerol.b Rate: final phase of the evaporation process after t = 25 min after most of the DEPh had evaporated. | ||||
| 542 | CCC deform. (C) | S.R.S (mix) | −0.043 | −0.001 |
| 1733 | CO (A) |
DEPh (mix) | −0.050 | <−0.001 |
| 3080 | C–H (ring) (B) | DEPh (mix) | −0.052 | −0.001 |
| DEPh (pure) | −0.013 | |||
| 3366 | O–H (D) | Glycerol (mix) | −0.012 | −0.002 |
| Glycerol (pure) | −0.003 | |||
In comparison with the respective pure compound experiments, the decay rates of the Raman peak for DEPh and glycerol in a mixed droplet were roughly 4 times faster (Table 1). The relative evaporation rate of different substances within a multicomponent droplet is difficult to quantify, as it is sensitive to multiple parameters, which include the gas–liquid interface equilibrium, the activation energy, the surface tension, the intermolecular forces within the individual substances or between different compounds and the constantly changing molar fraction during the whole evaporation process. For instance, an earlier study on water-in-oil microemulsions reported slower evaporation rates than that in pure liquids, due to the limitation of water diffusion in oil.41 In this work, as mentioned in the experimental method section, DEPh and glycerol were not completely miscible initially. Their dissolution was facilitated by the addition of a small quantity of methanol, creating a well-mixed solution by an endothermic process. After laser-trapping, the rapid evaporation of methanol from the microdroplet left behind two barely miscible liquids, which quickly transformed through phase-separation into a core–shell microstructure.
Following the same procedure, the intensity decrease of all Raman peaks was plotted as a function of time. Table 2 shows the intensity decay rates. They provide a reliable qualitative chemical discrimination referring to the peaks exclusively from DEPh as those having the steepest decay slope, in contrast to those from glycerol exhibiting the slowest decay. Between the two cases, there are peaks due to vibrational modes common to both compounds. Such a case is portrayed by a rapid decrease during the DEPh evaporation and a slower rate later, similar to the decay rate observed in pure glycerol microdroplets. This can be seen in the intensity decrease of a stimulated Raman peak (∼542 cm−1), as shown in the middle red plot C of Fig. 3(b). As previously reported,38,39 our experimental system provides high quality (S/N ratio) spectra and the full width at half maximum (FWHM) is ∼25 cm−1 for spontaneous Raman peaks and 10 cm−1 for stimulated Raman peaks on average. Due to the overlap and the congestion in the signature spectral range, the slope values may not be able to clearly distinguish the origin of some weak Raman peaks. This approach of monitoring the Raman intensity decrease can be used for the deconvolution of the normally complicated vibrational spectra of multicomponent droplets in the cases where individual compounds have different evaporation rates. Overall, the decay rates from the Raman peak intensity can be listed from fast to slow in the order of RDEPhinmixeddroplet > RDEPhinpuredroplet > Rglycerolinmixeddroplet > Rglycerolinpuredroplet; more details on the absolute evaporation rates obtained from the measurements will be further analysed later.
| Observed Raman shift (cm−1) | Suggested assignment42–44 | Origin (main contributor) | Ratea (% s−1) | Rateb (% s−1) |
|---|---|---|---|---|
| Note: DEPh: diethyl phthalate; gly: glycerol; S.R.S: stimulated Raman scattering; mix: mixed DEPh–glycerol microdroplet; indiv.: individual component microdroplet.a Rate: the first 25 min of the evaporation process with mixed DEPh and glycerol.b Rate: the final phase of the evaporation process (after t = 25 min) after most of the DEPh had evaporated; intermolec.: intermolecular; deform.: deformation; str.: stretching; sym.: symmetric; antisym.: antisymmetric. | ||||
| 232 | S.R.S | DEPh/gly | −0.035 | <0.001 |
| 364 | S.R.S/intermolec. H-bond | DEPh/gly | −0.052 | −0.002 |
| 392 | S.R.S | DEPh/gly | −0.043 | −0.002 |
| 542 | S.R.S/CCC deform. | DEPh/gly | −0.043 | −0.001 |
| 749 | S.R.S | DEPh/gly | −0.029 | −0.004 |
| 860 | C–C str. | DEPh/gly | −0.023 | −0.002 |
| 934 | CH2 rock | Gly | −0.009 | −0.002 |
| 1054 | C–C ring/C–O str | DEPh | −0.024 | −0.003 |
| 1069 | CH2 twist | DEPh | −0.041 | −0.002 |
| 1119 | C–O str. | Gly | −0.018 | −0.001 |
| 1261 | CH2 twist | Gly | −0.016 | −0.002 |
| 1287 | C–C ring | DEPh | −0.024 | −0.001 |
| 1304 | CH2 twist | DEPh | −0.025 | −0.001 |
| 1470 | CH2 deform. | Gly | −0.014 | −0.002 |
| 1587 | DEPh | −0.039 | −0.003 | |
| 1609 | CC ring | DEPh | −0.025 | −0.001 |
| 1655 | DEPh | −0.037 | −0.003 | |
| 2893 | C–H sym., str. | Gly | −0.014 | −0.002 |
| 2826 | C–H str. | Gly | −0.016 | −0.002 |
| 2935 | C–H str. | DEPh/gly | −0.018 | −0.002 |
| 2949 | C–H antisym., str. | DEPh/gly | −0.02 | −0.002 |
| 2974 | C–H str. | DEPh/gly | −0.02 | −0.002 |
| 3080 | C–H ring | DEPh | −0.052 | −0.001 |
| 3366 | O–H str. | Gly | −0.012 | −0.002 |
Compiling all the Raman spectra obtained from the central vertical slice, which were continuously recorded at 15 second intervals for about a one-hour period, Fig. 4 shows a portion of the 3D time-resolved Raman spectra of the mixed DEPh–glycerol droplet. It is easy to visualize that the Raman intensity of the C–H peak at ∼3080 cm−1 from the aromatic ring of DEPh kept dropping until it disappeared after ∼25 min. The fast evaporation during that time is also confirmed by a quick blue-shift in frequencies of the WGM resonance peaks, observed over the O–H broad band. The peak lines vertically distributed (along the time-axis direction) without any frequency shift are the Raman peaks (stimulated Raman scattering and spontaneous) at a fixed Raman shift. While the peak lines (dashed and purple) horizontally distributed (parallel to the Raman shift axis) at various time points mark the illuminating laser wavelength resonance peaks. As the droplet was evaporating and the size was shrinking with time, the input laser wavelength resonances occurred at certain sizes. The resonance peaks within the first 25 min are more congested than those after 25 min. This feature also suggests that the evaporating rate during the initial phase of evaporation is faster than that in the later time of the process. After the first ∼25 min, the remaining droplet was mostly made of glycerol and the WGMs (marked with dashed red line) were shifting at a slower rate, comparable to that observed in the experiments of individual glycerol droplets. This sudden change in the frequency shifting rate at the 25th min confirms our observation of the core–shell morphology, and this observation is consistent with the sudden change in the Raman intensity decrease for the band frequencies attributed to both DEPh and glycerol.
In order to further investigate the micro composition and morphology of such a multicomponent droplet suspended in air, we probed the Raman signal at various positions (at a 600 nm × 600 nm resolution) within the droplet using the position-resolved temporal laser-trapped Raman spectroscopic technology.39 In Fig. 5, each of the three panels shows a portion of the imaging Raman spectra, obtained through a 10 μm narrow slit, vertically aligned with the centre of the droplet and from which Raman spectra were retrieved from three different vertical spots, indicated as A–C. Fig. 5(a) shows the position-resolved Raman spectra obtained from the three spots of this mixed droplet at time t = 1 min. The signal originating from the surface area (A and B positions on the droplet cartoon) exhibits stronger DEPh peaks, while the glycerol signal predominates at the middle (position C) of the droplet. The same pattern was consistently observed over a period of time, with a rapid decrease in the intensity of DEPh. In Fig. 5(b), the DEPh signal is barely detectable at the middle of the droplet, but it is still visible around the surface positions. In Fig. 5(c), the glycerol signal is predominant at every position of the projected Raman image, but the signal of DEPh has almost disappeared. This approach provided a direct and indubitable experimental observation of the phase separation, physical microstructure, and the distribution of chemical compositions. It unveiled the typical core–shell morphology, where glycerol was highly concentrated at the core and was surrounded by DEPh that formed the outer layer. In contrast to the Raman spectra obtained from the whole slice, as shown in Fig. 3, the Raman peak from DEPh collected around the droplet surface at positions A and B is barely visible yet still detectable at 40 min (after 25 min); but, there is no DEPh signal at the middle position (curve C), as shown in Fig. 5(c).
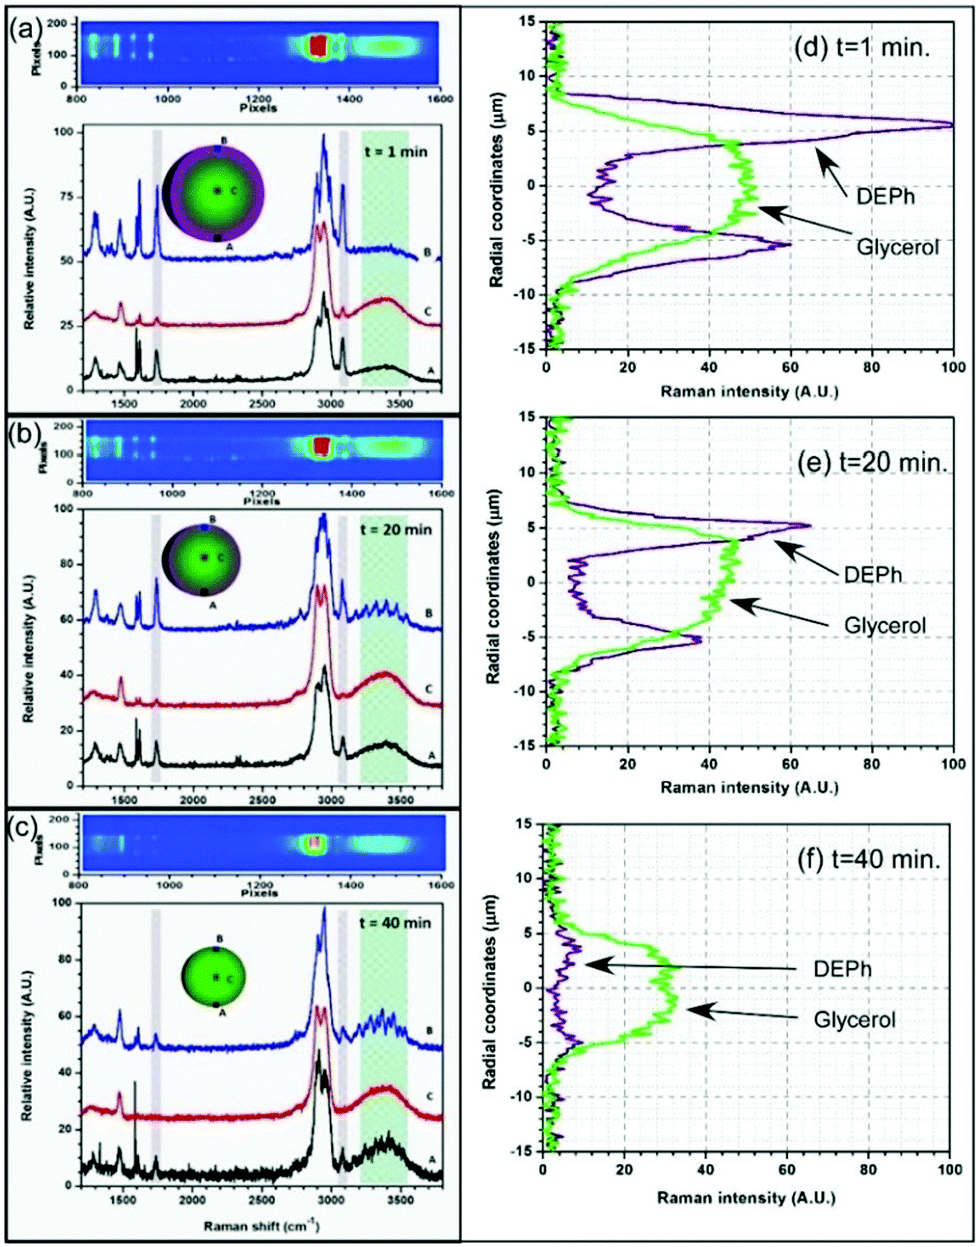 | ||
| Fig. 5 Raman spectra obtained from three typical positions (600 nm × 600 nm area) near the bottom, in the middle, and near the top of the droplet at time t = (a) 1 min, (b) 20 min, and (c) 40 min from a laser-trapped droplet of mixed DEPh and glycerol initially with a 1:1 volume ratio. The Raman intensity distributions of the representative peaks from DEPh (CO stretch peak at ∼1733 cm−1) and glycerol (the broad O–H stretching band at ∼3366 cm−1) along the vertical diameter of the droplet at time = (d) 1 min, (e) 20 min and (f) 40 min, respectively. | ||
Fig. 5(d–f) presents the Raman intensity from the representative peaks of DEPh (CO stretching band at ∼1733 cm−1) and glycerol (the broad O–H stretching band at ∼3366 cm−1) at different positions along the vertical diameter of the droplet at time t = 1 min, 20 min and 40 min, respectively. They were obtained from the Raman spectra of all the pixels along the central vertical slice. As the scattering intensity of the spontaneous Raman peak is proportional to the molar concentration of the scattering molecules and the illumination light intensity, the analysis of relative Raman intensity was able to support the quantitative measurements of molar concentration.45,46 If the laser has the same intensity distribution along this central diameter, the Raman intensity gives the chemical distribution along this diameter. At time = 1 min, Fig. 5(a) clearly indicates that DEPh is more distributed near the droplet surface, while glycerol is mainly in the central region. For a transparent droplet, the laser gives stronger illumination at the back (the top) than at the front surface (the bottom) along the laser propagating direction due to the focusing effect of the droplet; so, the Raman scattering is stronger at the top area than that at the bottom area even with the same chemical concentration. Although there are published calculations for the laser intensity distribution within a microsphere and the different distributions along the diameter depending on the particle size, refractive index, and laser spatial profile,47 we experienced difficulties in obtaining an accurate laser intensity distribution in our case of a non-plane wave illumination (counter-propagating focused hollow beams). However, with no doubt, the Raman intensity distribution in Fig. 5(e and f) revealed the two chemical distributions even without the correction of the laser intensity allocation. From time t = 1 min to 20 min, then at 40 min, it shows that the droplet kept shrinking from about 15 μm, to 13 μm, then to 11 μm in diameter with most of the DEPh located near the droplet surface and evaporated first; while glycerol mainly remained in the central region with slower evaporation. Both chemicals remained at constant concentrations in the middle region and reached similar values at the surface after DEPh was almost completely evaporated, as shown in Fig. 5(f).
The laser-trapped droplets formed similar core–shell structures at different initial sizes and mixing ratios. Fig. 6 shows the Raman intensity distribution of the two representative peaks from DEPh (CO stretching band at ∼1733 cm−1) and glycerol (the broad O–H stretching band at ∼3366 cm−1) along the central vertical diameter of three laser-trapped droplets at time = 1 min. The three droplets were formed by a mixture of DEPh and glycerol at an initial ratio by volume and size in diameter of (a) DEPh:glycerol = 2:1 and about 10 μm; (b) DEPh:glycerol = 1:1 and about 15 μm; (c) DEPh:glycerol = 1:2 and about 10 μm, respectively. Although the three droplets were formed by different volume ratios of DEPh and glycerol with a different droplet size initially, DEPh always migrated to the surface quickly, and glycerol mainly stayed in the central region, to form the gradient core–shell morphology. The data found from the EPA website (https://comptox.epa.gov) show different physical and chemical properties for DEPh and glycerol. These variances are mostly due to the different long-range intermolecular interactions among molecules of these liquids. For instance, under laboratory ambient conditions (∼60% relative humidity, 15 °C and 1 atm), the good ability of glycerol molecules to form stronger hydrogen bonds results in a higher viscosity (64.1 cP) and surface tension (49.7 dyn per cm) than those of DEPh (6.75 cP and 37.1 dyn per cm, respectively), and causes a slower flow and evaporation of glycerol than that of DEPh, even though they are in the droplet format in the super-micron size region. In their phase-separation and evaporation processes, the airborne droplets composed of the two poorly miscible chemical liquids first formed a core–shell like structure with gradient distributions in the separation regions, then DEPh with a lower surface tension and viscosity migrated to the surface and evaporated first, and later, glycerol gradually evaporated containing some remaining DEPh with a much lower evaporating rate. This is consistent with the observation from mixed organic–inorganic droplets with the lower surface tension organic liquid at the outer layer.20
 | ||
| Fig. 6 Raman intensity distribution of representative peaks obtained from DEPh (CO stretching band at ∼1733 cm−1) and glycerol (the broad O–H stretching band at ∼3366 cm−1) along the vertical diameter of three laser-trapped droplets at time = 1 min. The three droplets are formed by a mixture of DEPh and glycerol at an initial ratio by volume and size in diameter of (a) DEPh:glycerol = 2:1 and about 13 μm; (b) DEPh:glycerol = 1:1 and about 17 μm; and (c) DEPh:glycerol = 1:2 and about 13 μm. | ||
The phase-separation and evaporation processes of the two chemicals were further quantitatively analysed. Fig. 7(a) presents the squared radius (surface area/4π) of the overall droplet (the outside shell of DEPh) and the glycerol core (inside part) shrinking with the thickness of the DEPh shell. The radii were read from the edge positions of the outside shell and the core at half the intensity of the representative Raman distributions, as shown in Fig. 5(d–f), at different times. This indicates that both chemicals evaporated faster with a covering shell of DEPh, and the thicker the cover, the faster the evaporation. They follow a relationship from the simulated mode as R2 = aT2 + bT + c, where R is the radius of the droplet or the core, T is the thickness of the shell, and a, b, and c are constants related to the properties of the two chemicals and the surrounding air. Fig. 7(b) shows the squared radius (surface area/4π) of the pure DEPh droplet, the overall droplet and the glycerol core in the mixed droplet changes with time. This indicates again that both chemicals evaporated faster with an outside covering shell than their own pure droplets, and DEPh evaporated much faster than glycerol in both mixed and pure droplets. They all follow a linear evaporating process with a simulated mode as R2 = at + b, where t is the time, and a and b are constants. From the simulation, we obtained the evaporation rate for DEPh and glycerol in their mixed and pure droplets as 0.53 μm2 min−1, 0.40 μm2 min−1, 0.11 μm2 min−1, and 0.03 μm2 min−1, respectively. Although the absolute evaporation rates d(R2)/dt of glycerol that we obtained (0.11 μm2 min−1 and 0.03 μm2 min−1 for the core in a mixed droplet and for the pure droplet, respectively) are much smaller than the reported data (0.5 μm2 min−1 and 0.4 μm2 min−1, respectively, which are estimated from Fig. 8 in ref. 34), the change tendency of the radii with time or the shell thickness is similar. Further, our study was carried out under different experimental conditions, with a different covering chemical (DEPh rather than dioctyl-phthalate (DOP)) and without any gas stream flow field around the droplet, which could accelerate the evaporation of the droplet.
 | ||
| Fig. 7 Squared radius (R2 = surface area/4π) of the overall droplet (outside shell of the DEPh) and the glycerol part (inside core) of the mixed DEPh and glycerol droplet, and their pure droplet shrink with (a) the thickness of the DEPh shell T, and (b) time t. The corresponding curves are the fitted results. | ||
Summary
Liquid–liquid phase-separation and evaporation from individual laser-trapped organic–organic droplets in ambient air were explored using the spatial-resolved temporal Raman spectroscopic technology. A mixed droplet was formed by diethyl phthalate (DEPh) and glycerol at initial volume ratios of 2:1, 1:1, and 1:2. Individual single droplets were optically trapped by a highly focused counter-propagating hollow laser beam and allowed to freely evaporate, while the chemical composition and the morphology were continuously monitored by Raman spectroscopy. Spatial-resolved temporal Raman spectroscopy revealed the phase-separation process and shed light on the dynamics taking place within the droplet, during the entire evaporation process. The DEPh–glycerol droplets present a typical core–shell morphology, with a glycerol-rich core and DEPh highly concentrated around the core, forming the outer layer. DEPh evaporated faster than glycerol whether it is in a mixed or a pure droplet, but both DEPh and glycerol within the mixed droplet evaporated faster than either of them within their own pure droplets. With this powerful technique, as demonstrated in this study, we may extend our investigation to more complicated cases such as multi-layer phase separation and evaporation dynamics, which will provide new insights into the chemical and physical properties of aerosol particles.
Conflicts of interest
The authors declare no competing financial interest.Acknowledgements
Support of the Defense Threat Reduction Agency (HDTRA1621520) and the US Army Research Laboratory mission funds is gratefully acknowledged.References
- J. H. Bae and C. T. Avedisian, Combust. Flame, 2004, 137, 148–162 CrossRef.
- K. W. Dammann, R. Hollmann and R. Stuhlmann, Adv. Space Res., 2002, 29, 1753–1757 CrossRef.
- D. R. Gentner, S. H. Jathar, T. D. Gordon, R. Bahreini, D. A. Day, I. El Haddad, P. L. Hayes, S. M. Pieber, S. M. Platt, J. de Gouw, A. H. Goldstein, R. A. Harley, J. L. Jimenez, A. S. Prevot and A. L. Robinson, Environ. Sci. Technol., 2017, 51, 1074–1093 CrossRef PubMed.
- G. Myhre, C. E. L. Myhre, B. H. Samset and T. Storelvmo, Nature Education Knowledge, 2013, 4, 7 Search PubMed.
- A. Oasmaa, I. Fonts, M. R. P. Samaniego, M. E. G. Perez and M. P. Perez, Energy Fuels, 2016, 30, 6179–6200 CrossRef.
- S. Solomon, Rev. Geophys., 1988, 26, 131–148 CrossRef.
- A. L. Steiner, D. Mermelstein, S. J. Cheng, T. E. Twine and A. Oliphant, Earth Interact., 2013, 17, 1–22 CrossRef.
- M. M. Bailey, E. M. Gorman, E. J. Munson and C. Berkland, Langmuir, 2008, 24, 13614–13620 CrossRef PubMed.
- A. J. Hickey, P. G. Durham, A. Dharmadhikari and E. A. Nardell, J. Controlled Release, 2016, 240, 127–134 CrossRef PubMed.
- S. W. Stein and C. G. Thiel, J. Aerosol Med. Pulm. Drug Delivery, 2017, 30, 20–41 CrossRef PubMed.
- S. N. Pandis, A. S. Wexler and J. H. Seinfeld, J. Phys. Chem., 1995, 99, 9646–9659 CrossRef.
- R. L. Corsi, J. Siegel, A. Karamalegos, H. Simon and G. C. Morrison, J. Atmos. Environ., 2007, 41, 3161–3165 CrossRef.
- S. Losert, N. von Goetz, C. Bekker, W. Fransman, S. W. Wijnhoven, C. Delmaar, K. Hungerbuhler and A. Ulrich, Environ. Sci. Technol., 2014, 48, 5366–5378 CrossRef PubMed.
- M. E. Quadros and L. C. Marr, Environ. Sci. Technol., 2011, 45, 10713–10719 CrossRef PubMed.
- P. Davidovits, C. E. Kolb, L. R. Williams, J. T. Jayne and D. R. Worsnop, Chem. Rev., 2006, 106, 1323–1354 CrossRef PubMed.
- C. Diddens, J. G. M. Kuerten, C. W. M. van der Geld and H. M. A. Wijshoff, J. Colloid Interface Sci., 2017, 487, 426–436 CrossRef PubMed.
- A. A. Gunay, S. Sett, J. Oh and N. Miljkovic, Langmuir, 2017, 33, 12007–12015 CrossRef PubMed.
- S. Karpitschka, F. Liebig and H. Riegler, Langmuir, 2017, 33, 4682–4687 CrossRef PubMed.
- W. Xu, R. Leeladhar, Y. T. Kang and C. H. Choi, Langmuir, 2013, 29, 6032–6041 CrossRef PubMed.
- R. E. O'Brien, B. Wang, S. T. Kelly, N. Lundt, Y. You, A. K. Bertram, S. R. Leone, A. Laskin and M. K. Gilles, Environ. Sci. Technol. Lett., 2015, 49, 4995–5002 CrossRef PubMed.
- Y. You and A. K. Bertram, Atmos. Chem. Phys., 2015, 15, 1351–1365 CrossRef.
- Y. You, L. R. Wolff and A. K. Bertram, Atmos. Chem. Phys., 2013, 13, 11723–11734 CrossRef.
- Y. H. Zhang, M. Y. Choi and C. K. Chan, J. Phys. Chem. A, 2004, 108, 1712–1718 CrossRef.
- N. O. Kwamena, J. Buajarern and J. P. Reid, J. Phys. Chem. A, 2010, 114, 5787–5795 CrossRef PubMed.
- J. Buajarern, L. Mitchem and J. P. Reid, J. Phys. Chem. A, 2007, 111, 9054–9061 CrossRef PubMed.
- S. Corsetti, R. E. Miles, C. McDonald, Y. Belotti, J. P. Reid, J. Kiefer and D. McGloin, J. Phys. Chem. A, 2015, 119, 12797–12804 CrossRef PubMed.
- K. Gorkowski, H. Beydoun, M. Aboff, J. S. Walker, J. P. Reid and R. Sullivan, Aerosol Sci. Technol., 2016, 50, 1327–1341 CrossRef.
- C. Marcolli and U. K. Krieger, J. Phys. Chem. A, 2006, 110, 1881–1893 CrossRef PubMed.
- M. Song, C. Marcolli, U. K. Krieger, D. M. Lienhard and T. Peter, Faraday Discuss., 2013, 165, 289–316 RSC.
- M. A. Freedman, Chem. Soc. Rev., 2017, 46, 7694–7705 RSC.
- D. P. Veghte, M. B. Altaf and M. A. Freedman, J. Am. Chem. Soc., 2013, 135, 16046–16049 CrossRef PubMed.
- L. Pasternack, J. W. Fleming and J. C. Owrutsky, J. Opt. Soc. Am. B, 1996, 13, 1510–1516 CrossRef.
- K. Gorkowski, N. M. Donahue and R. C. Sullivan, Environ. Sci. Technol., 2017, 51, 12154–12163 CrossRef PubMed.
- A. K. Ray, B. Devakottai, A. Souyri and J. L. Huckaby, Langmuir, 1991, 7, 525–531 CrossRef.
- A. K. Ray and R. Nandakumar, Appl. Opt., 1995, 34, 7759–7770 CrossRef PubMed.
- J. P. Reid, B. J. Dennis-Smither, N.-O. A. Kwamena, R. E. H. Miles, K. L. Hanford and C. J. Homer, Phys. Chem. Chem. Phys., 2011, 13, 15559–15572 RSC.
- D. Stewart, C. Cai, J. Nayler, T. C. Preston, J. P. Reid, U. Krieger, C. Marcolli and Y.-H. Zhang, J. Phys. Chem. A, 2015, 119, 4177–4190 CrossRef PubMed.
- A. Kalume, L. A. Beresnev, J. L. Santarpia and Y. L. Pan, Appl. Opt., 2017, 56, 6577–6582 CrossRef PubMed.
- A. Kalume, E. Zhu, C. Wang, J. Santarpia and Y. L. Pan, Opt. Lett., 2017, 42, 5113–5116 CrossRef PubMed.
- J. Popp, I. Hartmann, M. Lankers, M. Trunk and W. Kiefer, Phys. Chem. Chem. Phys., 1997, 101, 809–813 Search PubMed.
- J. H. Clint, P. D. I. Fletcher and I. Todorov, Phys. Chem. Chem. Phys., 1999, 1, 5005–5009 RSC.
- R. L. Aggarwal, L. W. Farrar, B. G. Saar, T. H. Jeys and R. B. Goodman, Report 1175, Massachusettes Institute of Technology Lincoln Laboratory, Lexington, Massachusetts, 2013.
- E. Mendelovici, R. L. Frost and T. Kloprogge, J. Raman Spectrosc., 2000, 31, 1121–1126 CrossRef.
- W. Meng, G. Jin-Ju, W. Zhong-Bo and W. Zun-Yao, Chin. J. Struct. Chem., 2013, 32, 890–902 Search PubMed.
- K. H. Fung and I. N. Tang, Appl. Spectrosc., 1992, 46, 159–162 CrossRef.
- S. Sisanis, M. Aleksandrova and K. Schaber, Aerosol Sci. Technol., 2011, 45, 751–757 CrossRef.
- D. Q. Chowdhury, P. W. Barber and S. C. Hill, Appl. Opt., 1992, 31, 3518–3523 CrossRef PubMed.
| This journal is © the Owner Societies 2018 |