
 Open Access Article
 This Open Access Article is licensed under a Creative Commons Attribution-Non Commercial 3.0 Unported Licence
Ultrafast dissociation features in RIXS spectra of the water molecule
Emelie
Ertan
 *a,
Viktoriia
Savchenko
bc,
Nina
Ignatova
bc,
Vinícius
Vaz da Cruz
b,
Rafael C.
Couto
b,
Sebastian
Eckert
d,
Mattis
Fondell
e,
Marcus
Dantz
f,
Brian
Kennedy
e,
Thorsten
Schmitt
f,
Annette
Pietzsch
e,
Alexander
Föhlisch
de,
Faris
Gel'mukhanov
bc,
Michael
Odelius
*a and
Victor
Kimberg
*bc
*a,
Viktoriia
Savchenko
bc,
Nina
Ignatova
bc,
Vinícius
Vaz da Cruz
b,
Rafael C.
Couto
b,
Sebastian
Eckert
d,
Mattis
Fondell
e,
Marcus
Dantz
f,
Brian
Kennedy
e,
Thorsten
Schmitt
f,
Annette
Pietzsch
e,
Alexander
Föhlisch
de,
Faris
Gel'mukhanov
bc,
Michael
Odelius
*a and
Victor
Kimberg
*bc
aDepartment of Physics, Stockholm University, AlbaNova University Center, 10691 Stockholm, Sweden. E-mail: emelie.ertan@fysik.su.se; odelius@fysik.su.se
bTheoretical Chemistry and Biology, Royal Institute of Technology, 10691 Stockholm, Sweden. E-mail: kimberg@kth.se
cInstitute of Nanotechnology, Spectroscopy and Quantum Chemistry, Siberian Federal University, 660041 Krasnoyarsk, Russia
dInstitut für Physik und Astronomie, Universität Potsdam, Karl-Liebknecht-Strasse 24-25, 14476 Potsdam, Germany
eInstitute for Methods and Instrumentation in Synchrotron Radiation Research G-ISRR, Helmholtz-Zentrum Berlin für Materialien und Energie, Albert-Einstein-Strasse 15, 12489 Berlin, Germany
fResearch Department Synchrotron Radiation and Nanotechnology, Paul Scherrer Institut, CH-5232 Villigen PSI, Switzerland
First published on 4th May 2018
Abstract
In this combined theoretical and experimental study we report on an analysis of the resonant inelastic X-ray scattering (RIXS) spectra of gas phase water via the lowest dissociative core-excited state |1s−1O4a11〉. We focus on the spectral feature near the dissociation limit of the electronic ground state. We show that the narrow atomic-like peak consists of the overlapping contribution from the RIXS channels back to the ground state and to the first valence excited state |1b−114a11〉 of the molecule. The spectral feature has signatures of ultrafast dissociation (UFD) in the core-excited state, as we show by means of ab initio calculations and time-dependent nuclear wave packet simulations. We show that the electronically elastic RIXS channel gives substantial contribution to the atomic-like resonance due to the strong bond length dependence of the magnitude and orientation of the transition dipole moment. By studying the RIXS for an excitation energy scan over the core-excited state resonance, we can understand and single out the molecular and atomic-like contributions in the decay to the lowest valence-excited state. Our study is complemented by a theoretical discussion of RIXS in the case of isotopically substituted water (HDO and D2O) where the nuclear dynamics is significantly affected by the heavier fragments' mass.
1 Introduction
Vibrationally resolved resonant inelastic X-ray scattering (RIXS) has provided insight into electronic and molecular properties in the gas phase,1–6 in liquids7–9 and in solids.10,11 Through studies of gas phase O2 and N2, we have gained information on the effect of parity on RIXS selection rules,6 quantum beats,3 the potential energy surface (PES)1 and ionisation thresholds.2 In liquids, the potential energy surface and molecular dynamics have been investigated for acetone and water,7,9 as well as the hydrogen bonding dynamics of water.8 Even in a complex clay material like kaolinite, local vibrations of hydroxyl groups have been resolved.10 Of particular interest to current investigations are systems with a strong nuclear response to core-excitation.It has been well established by a series of experimental–theoretical studies that sharp atomic-like peaks may appear in RIXS4,12,13 and resonant Auger scattering (RAS)14–16 spectra of molecules. These sharp features are explained by the decay taking place in isolated atoms and are usually considered as fingerprints of ultrafast dissociation (UFD)17,18 in the core-excited state. This process has been observed in many diatomic16,18,19 and polyatomic14,15,20–22 molecules subsequent to dissociation of the core-excited molecule. In the cases where UFD leads to formation of a polyatomic core-excited fragment, the sharp atomic-like features may be broadened by vibrational structure.4
The water molecule is a simple system, in which we can observe this phenomenon.4 Nuclear dynamics in the energetically lowest dissociative core-excited state (|1s−1O4a11〉) induce ultrafast bond elongation in the water molecule, leading to UFD on a timescale comparable to the O1s core-hole lifetime (Γ−1 ∼ 4 fs).23 UFD of the water molecule has been observed in RAS,21 ion yield X-ray spectroscopy22 and electron–ion coincidence spectroscopy.20 In RAS experiments, the core-excited state dynamics was investigated and by comparison of the spectra of H2O and D2O, a fingerprint of UFD in the H2O molecule could be identified. The RAS process has also been investigated theoretically using multidimensional nuclear dynamics,24 identifying the dynamics on the dissociative core-excited |1s−1O4a11〉 state potential energy surface as the reason for the molecular fragmentation. The effect of UFD can be observed also in the spectrum of electronically elastic (referred to as “quasi-elastic” in what follows) RIXS of H2O, as was shown in a recent publication.4 Previous high-resolution RIXS measurements of the water molecule25 have shown a splitting in the emission line of the |1b−114a11〉 state in gas phase water. This was interpreted as contributions from X-ray fluorescence of both the intact water molecule and the OH fragment resulting from UFD.
In this publication we present ab initio theoretical spectrum simulations compared to vibrationally resolved RIXS measurements of the overlapping |1s−1O4a11〉 → |1b−114a11〉 and quasi-elastic RIXS decay channels of the water molecule. We combine high-resolution RIXS measurements with theoretical spectrum modelling based on multiconfigurational quantum chemistry and multidimensional quantum wave packet propagation. We show that the atomic-like peak in this case is constituted of contributions from both the decay channels and possesses vibrational fine-structure. The intensity of the quasi-elastic channel increases drastically due to the strong dependence of the transition dipole moment on molecular geometry.
The paper is organized as follows. Details on the experimental methods are presented in Section 2.1. The background for electronic structure calculations is discussed in Section 2.2 and the theory for the nuclear dynamics simulation and the orientational averaging of the RIXS cross section is discussed in Section 2.3 and Section 2.4, respectively. In Section 3, the results are summarized and discussed. In particular, in Section 3.2 we discuss the background for the R-dependence of the transition dipole moment of the quasi-elastic scattering channel. In Section 3.3 the results of a one-dimensional model of the ultrafast dissociation are presented and discussed. The theoretical RIXS spectrum is presented and discussed in comparison to the experimental results in Section 3.5. Lastly, the effect of isotope substitution on the dissociation dynamics is discussed in Section 3.6. Our findings are summarized in Section 4.
2 Methods
2.1 Experiment
Detailed descriptions of the experiment can be found elsewhere.4,5 In short, the experimental data were acquired using the RIXS end station of the ADRESS beam line26 at the Swiss Light Source. The signal emitted from the sample volume was detected using a spherical variable-line-space high-resolution RIXS spectrometer SAXES.27 The photon energy ω, used for the excitation of the sample, was tuned in the energy interval 531.95–535.18 eV; near resonance with the lowest core-excited state |1a−114a11〉. The resonantly scattered photons were detected at 90 degrees from the synchrotron radiation propagation direction using linear horizontal and linear vertical polarizations of X-rays, which allows for anisotropy study of the RIXS spectra measured for 90 and 0 degrees relative to the incoming photons’ polarization. The total experimental resolution was 75 meV.2.2 Ab initio calculations
In this investigation we include two RIXS decay channels of the |1s−1O4a11〉 core-excited state; the quasi-elastic scattering back to the ground state |GS〉 = |1a21(O1s),2a21,1b22,3a21,1b21〉 and the inelastic scattering to the |1b−114a11〉 valence-excited state, | (1) |
| dcg(R1,R2) = (0,dycg,dzcg), dcv(R1,R2) = (dxcv,0,0) | (2) |
The electronic structure calculations were carried out in the restricted active space self-consistent field (RASSCF)28 framework in the MOLCAS version 8.229,30 computational software. In RASSCF calculations, the total space of active orbitals is divided into three subspaces, with different restrictions with regard to the number of holes and electrons. These subspaces are referred to as RAS1 (wherein a restricted number of electron holes is allowed), RAS3 (wherein the number of electrons is restricted), and RAS2 (wherein a full CI is carried out on the remaining electrons depending on the configurations in RAS1 and RAS3). The following notation is adopted from ref. 31 to denote the active space used in the calculations: RAS(n,l,m;i,j,k). n, l and m refer to the total number of active electrons, the maximum number of allowed holes in RAS1 and the maximum number of electrons allowed in RAS3, respectively, and i, j, k to the number of MOs in the RAS1, RAS2 and RAS3 subspaces.
The calculations were performed in Cs symmetry using the ANO-RCC32 basis set augmented with a diffuse Rydberg basis set (2s2p1d) placed at the oxygen atom, in line with previous studies.4,5 Scalar relativistic effects were included, via the combination of the Douglas–Kroll–Hess (DKH) method33,34 with the atomic mean field (AMFI) approximation,35 for a better description of the core-excited state energies.
Using second-order perturbation theory (RASPT2),28,36 dynamic correlation was added, resulting in a correction to the energies obtained from RASSCF. An imaginary shift of 0.1 a.u. was introduced to avoid problems with weakly interacting intruder states and multi-state RASPT2 was performed over the two lowest core-excited states for consistency with our previous studies.4,5 Using the RAS state interaction program (RASSI)37,38 the energies of the ground |1b−114a11〉 and |1s−1O4a11〉 states and the corresponding transition dipole moments (in dx, dy, dz format) were obtained.
In accordance with the previous studies,4,5 the following MOs were included in the active space; 1a1(O1s), 2a1, 1b2, 3a1, 1b1, 4a1, 2b2, and 2b1, together with two additional virtual MOs of a′ symmetry and one additional virtual MO of a′′ symmetry to improve the description of the states.
The 2D stretching PESs were calculated at the RASPT2(10,1,0;1,10,0) level for all states to ensure compatibility in the calculation of the transition dipole moments. To target the specific core-excited state for simulation of RIXS, the O1s MO is placed in RAS1 and frozen at the Hartree–Fock level. Using the “highly-excited-state (HEXS)” scheme31 implemented in MOLCAS 8.2, configurations with a fully occupied RAS1 space could be excluded for the calculation of the core-excited state. This approach to model the core-excited state presented in this work is different from our previous studies, and gives a proper description of the transition dipole moments of the core-excited state.
The 2D PESs of the ground, core-excited and final valence-excited states are collected in in Fig. 1. The 2D map of the components of the transition dipole moments is shown in Fig. 2 in valence coordinates R1, R2.
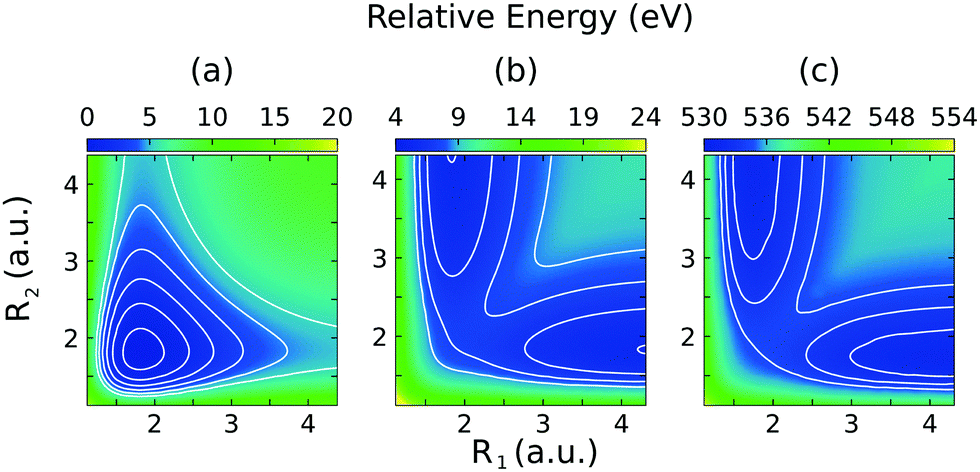 | ||
| Fig. 1 Potential energy surfaces for the ground |GS〉 (a), valence-excited |1b−114a11〉 (b), and core-excited |1s−1O4a11〉 (c) states of H2O for the stretching modes in valence coordinates R1, R2. The angle Θ = 104.2° is fixed to its equilibrium value in the ground state. The energy scale is relative to the ground state energy minimum. | ||
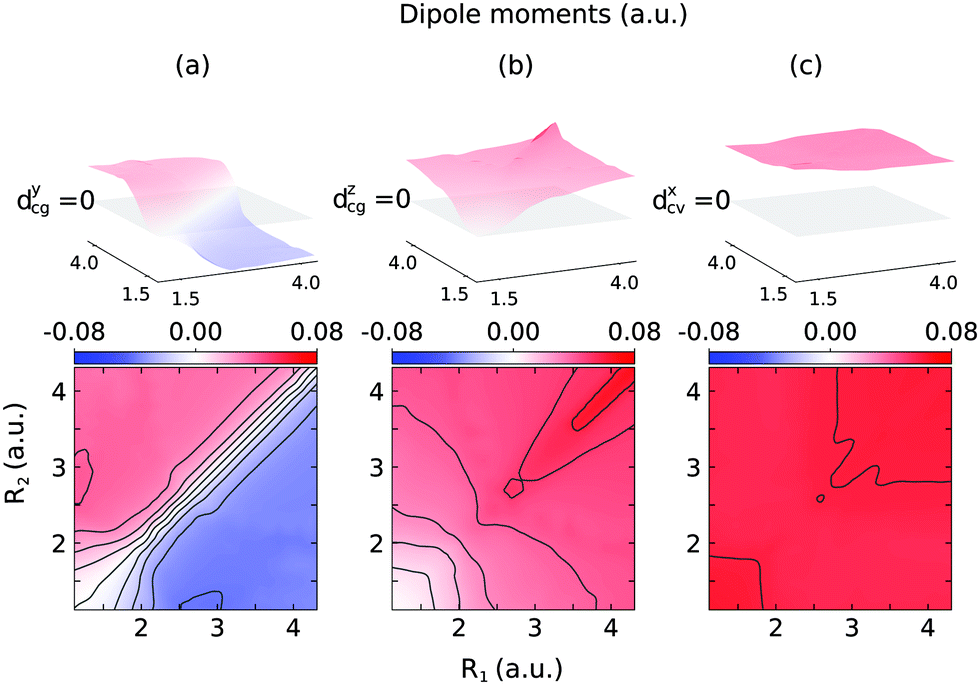 | ||
| Fig. 2 Components of the transition dipole moments in valence coordinates R1, R2 (same as in Fig. 1): dycg(R1,R2) (a), dzcg(R1,R2) (b), dxcv(R1,R2) (c). The upper indexes mark the component in the molecular frame, and g, c, and v in lower indexes stand for the ground |GS〉, core-excited |1s−1O4a11〉 and valence-excited |1b−114a11〉 states. | ||
2.3 Theory of RIXS
For simulations of the vibrationally resolved RIXS spectra we use the time-dependent solution of the nuclear Schrödinger equation in the valence coordinates R1, R2. As mentioned above, the bending mode is not excited in RIXS via the lowest core-excited state |1s−1O4a11〉. The 2D Hamiltonian for the stretching motion reads:4,39,40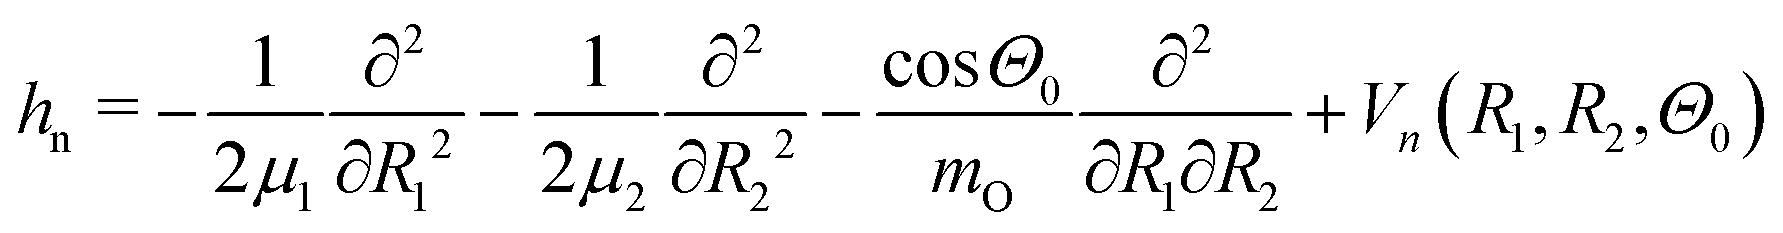 | (3) |
| |ψc(t)〉 = e−ıhct(e·dgc)|ν0〉, | (4) |
| |Ψ(t)〉 = e−ıhft|Ψ(0)〉, | (5) |
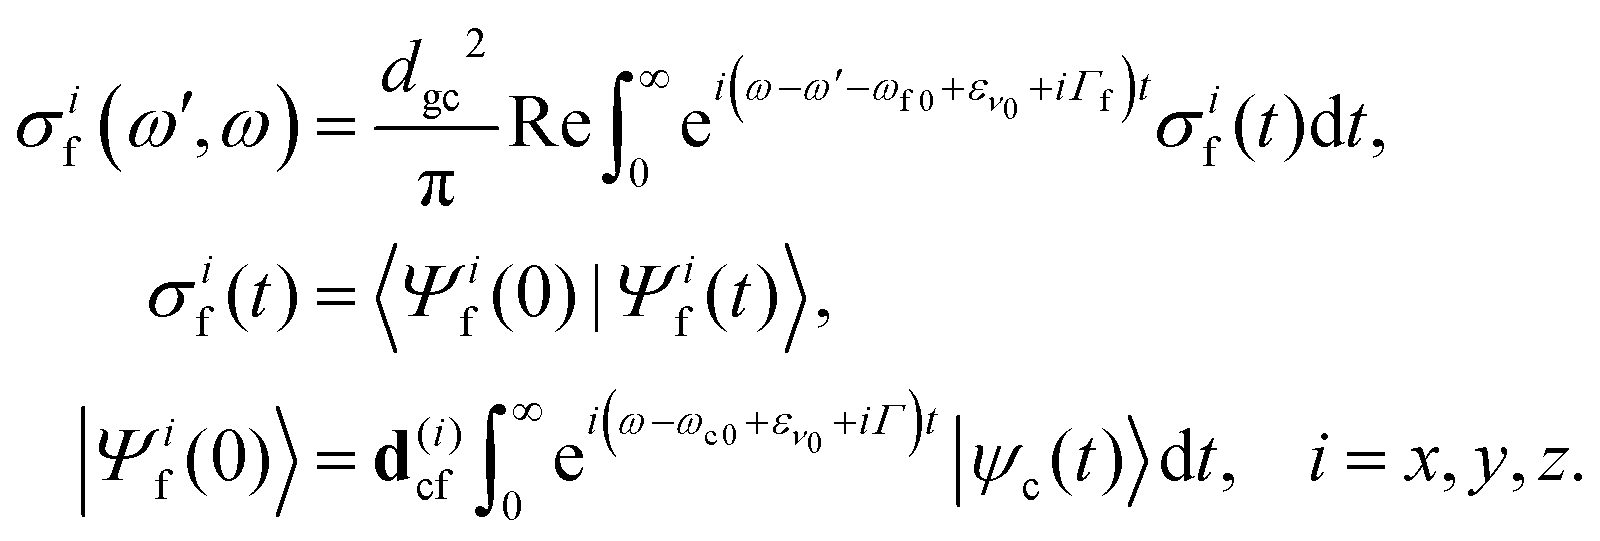
Here e′ is the polarization vector of the emitted photon, ω is the frequency of the incoming photon, and dcf is the transition dipole moment of the decay transition to the final electronic states f = g, v. ωc0 is the frequency for the transition between the minima of the ground state and the core-excited state, εν0 is the vibrational energy of the initial state and Γ = 0.08 eV23 is the core-excited state lifetime broadening (half-width half-maximum). The RIXS spectrum for each channel is computed as a half-Fourier transform of the autocorrelation function σ(t):
 | (6) |
| σ(t) = 〈Ψ(0)|Ψ(t)〉, |
| σ(ω′,ω) = σg(ω′,ω) + σv(ω′,ω). | (7) |
The theory outlined above represents the two-dimensional (2D) model of the nuclear dynamics in the water molecule. However, in the present paper we also analyzed the results of the one-dimensional (1D) model, which allows for a simpler physical interpretation of the studied processes. In the 1D model, we fix the R2 = R0 coordinate at its equilibrium position in the ground state, representing the localized stretching mode. Due to the symmetry of the water molecule, the 1D model provides spectra that are qualitatively similar to the full 2D description, yet much less computationally demanding.
2.4 Molecular orientation averaging
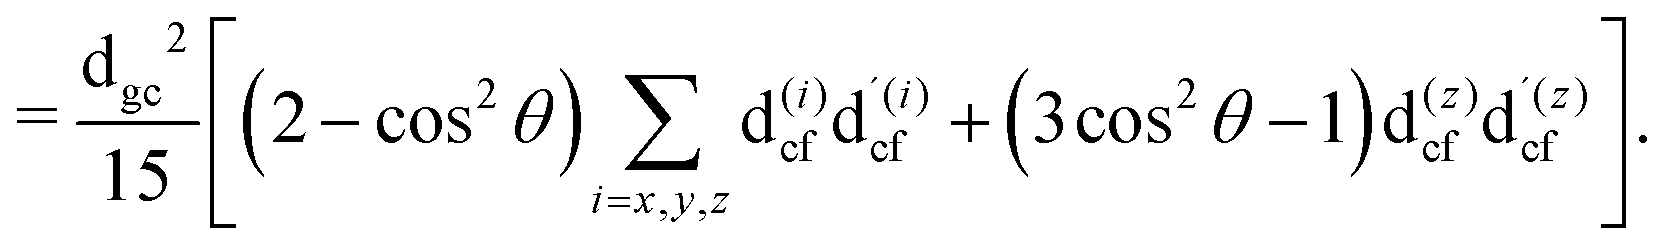
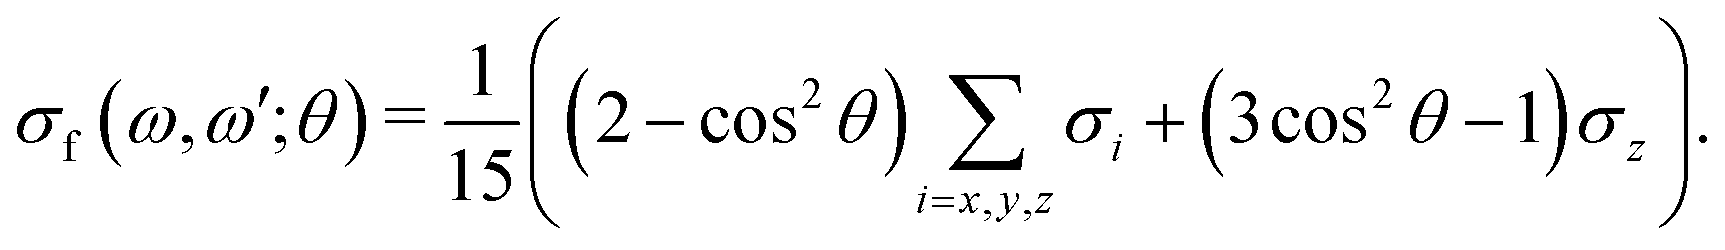
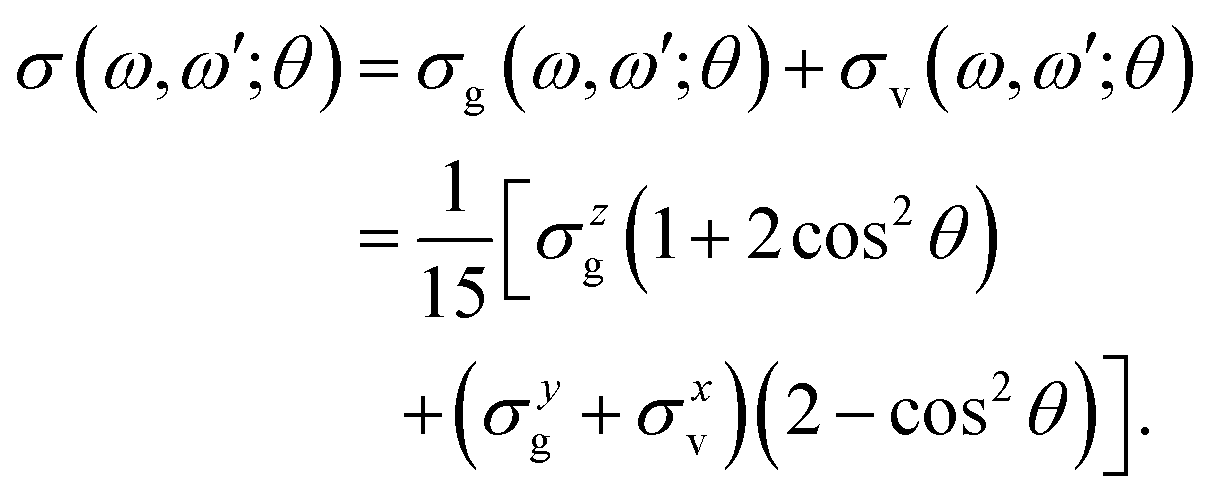
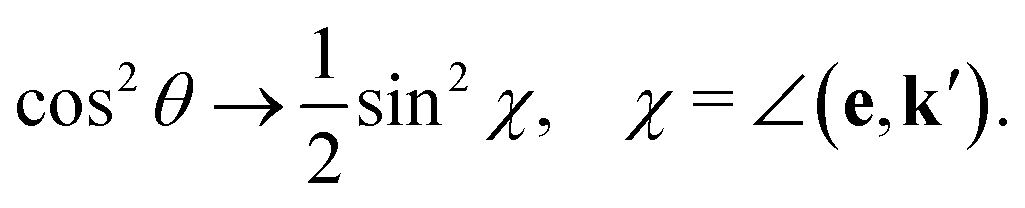
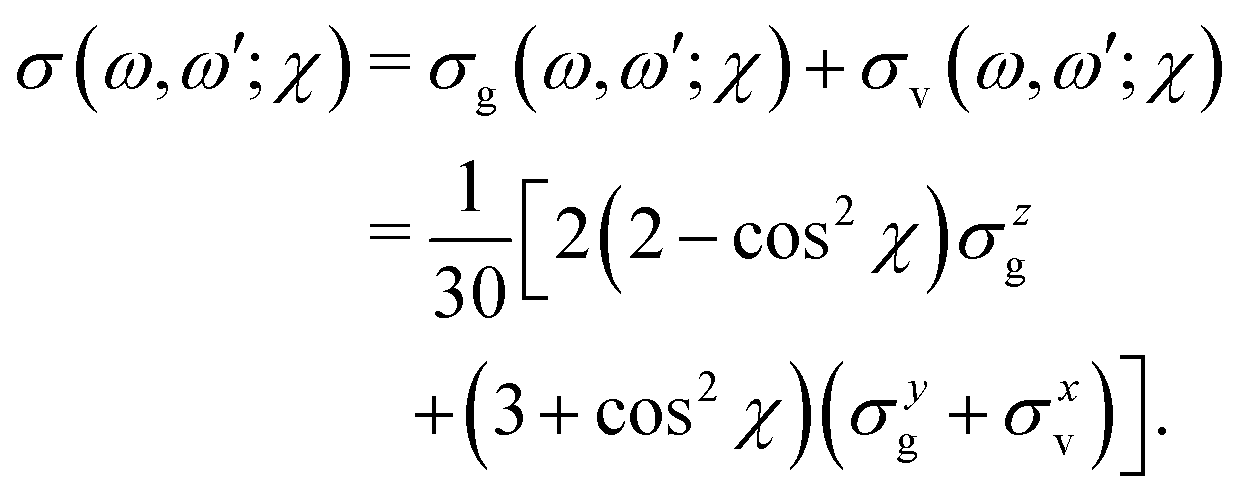
The gas phase water molecules studied here are randomly oriented. Therefore we should average the RIXS cross section eqn (6) over molecular orientations. As follows from our ab initio calculations summarized in Fig. 2, the orientation of the transition dipole moment dcg shows strong R-dependence due to the strong R-dependence of its y-component dygc. Let us note that the initial wave function |ν0〉 is localized around the ground state equilibrium geometry, where the variation of the dygc, dzgc is not so strong, and thus the R-dependence for the excitation can be neglected. Hence in what follows, we assume that dgc ≡ dcg(R0) = const. This approximation allows us to sufficiently simplify the description of the anisotropy effects and computational expenses while providing a reasonable accuracy of the overall spectra, as is confirmed by comparison with the exact theory, which can be found elsewhere.41 The core-excited wave packet is distributed along a wide R-range, so the R-dependence of the transition dipole moments on the decay transition is fully taken into account.The dependence of the RIXS cross section, in eqn (6), on molecular orientation originates from the relative orientations of the vectors of transitions dipole moments dgc = const, dcf(R) and dcf(R1)
 | (8) |
 | (9) |
 | (10) |
 | (11) |
 | (12) |
 | (13) |
 | (14) |
 | (15) |
The ith component of the RIXS cross section can be written in the time-dependent representation as follows
3 Results and discussion
3.1 Potential energy surfaces
The relation of the 2D PESs of the ground state, Fig. 1(a), and the |1s−1O,4a11〉 core-excited state, Fig. 1(c), has already been investigated elsewhere.4,5 Hence, here we will focus on the characteristics of the PES of the dissociative valence-excited state, |1b−11,4a11〉, Fig. 1(b) and compare to the characters of the ground state and core-excited state PESs. Along the localized stretching mode, both the valence-excited and core-excited states have dissociative PESs. Starting from a bond length of 3 a.u., the PESs are parallel, which can be seen in Fig. 4. This will be of crucial importance to the RIXS UFD features in the RIXS spectra, as will be discussed in Section 3.3. The characters of the valence-excited and the ground state PES are instead very different. However, at long bond distance, where the H2O molecule is represented by the OH and H fragments, the radical ground state of OH, |1σ22σ23σ21π3〉, is a spatially degenerate doublet due to the open 1π shell. Hence the molecular ground and |1b−114a11〉 states approach a shared dissociation limit for distortion along the localized stretching coordinate.Along the symmetric stretching coordinate, Qs = R1 + R2, the PESs of the core- and valence-excited states have very similar (bound) character, apart from the PES of the core-excited state being slightly deeper. Compared to that of the ground state, the PES of the valence-excited state is more shallow along the symmetric stretching coordinate. For distortion along the symmetric stretching coordinate, where the H2O molecule is represented by O and H + H fragments, the ground state and the valence-excited state asymptotically both reach the 3P ground state of the O fragment, generated by the 2p4 configuration.
Notice that the ground state of the OH fragment is labeled in terms of linear C∞v symmetry and the ground state of the O fragment is labeled in terms of the atomic term symbol in the text above.
3.2 R-dependence of the transition dipole moment on the quasi-elastic scattering channel
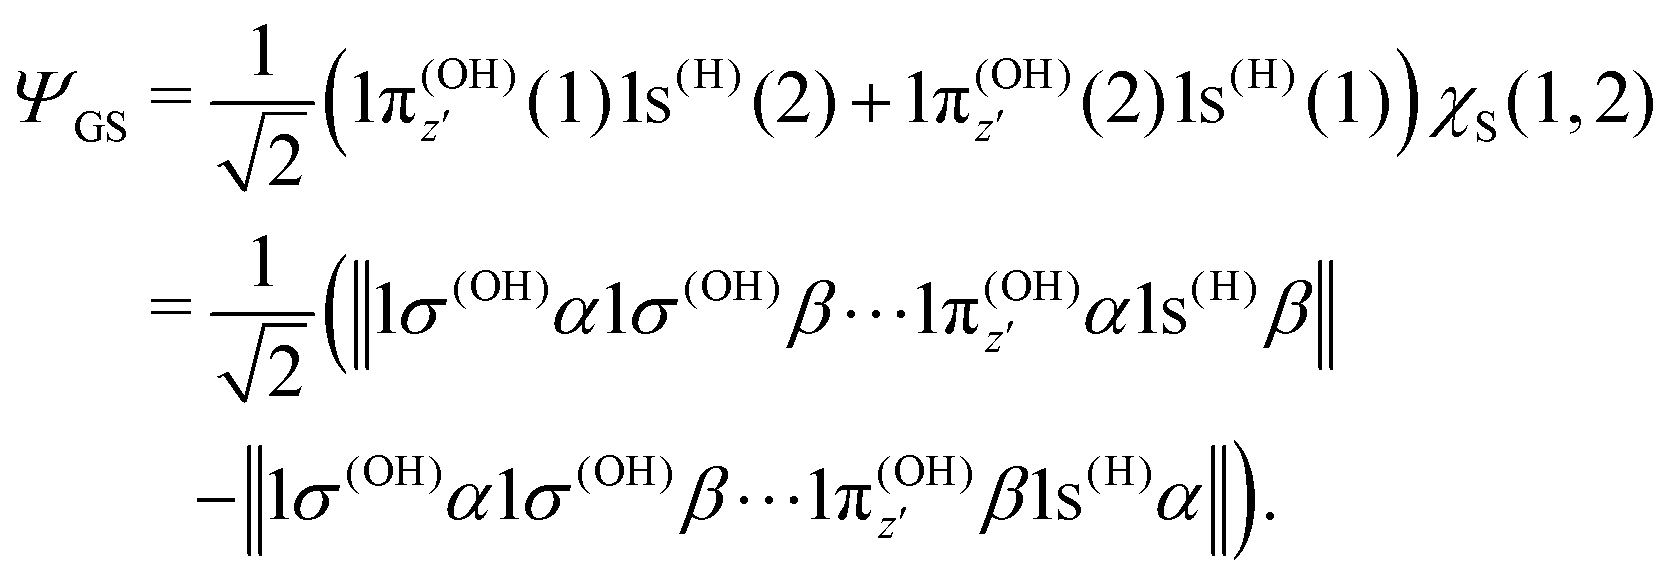
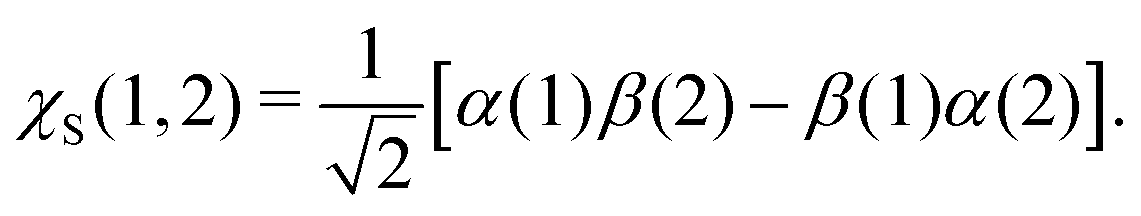
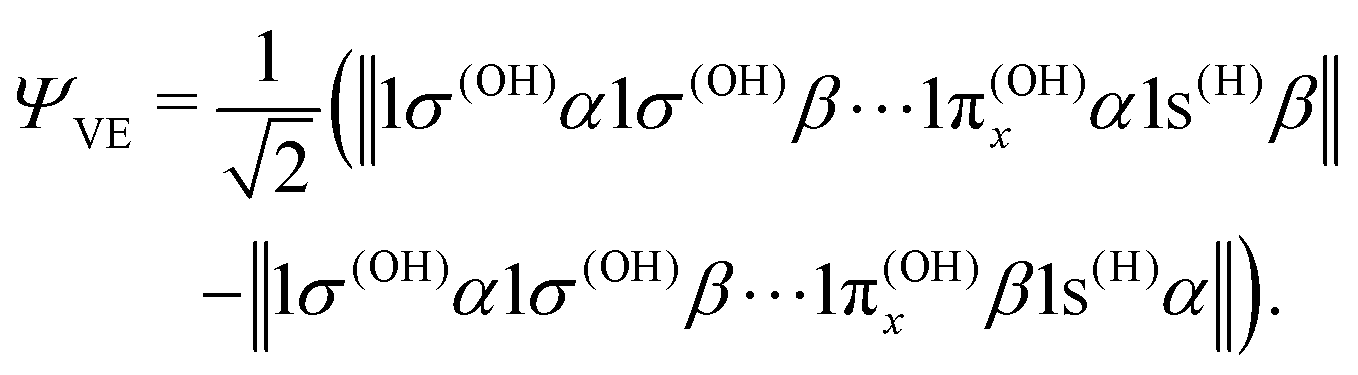
The transition dipole moment of the transition between the core-excited and ground states, dcg, shows a strong R-dependence as shown in Fig. 2(a and b). At the ground state equilibrium geometry, dcg only has a component along the z-axis in the molecular frame, and a zero component along the y-axis. However, the y-component grows with elongation of one of the OH bonds. The physical reason for the rotation of this transition dipole moment dcg is the symmetry breaking resulting from the geometric distortion. At equilibrium geometry, the ground state wave function, ΨGS, is represented by the following Slater determinant: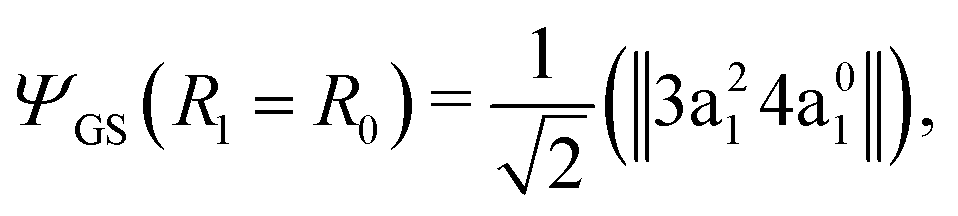 | (16) |
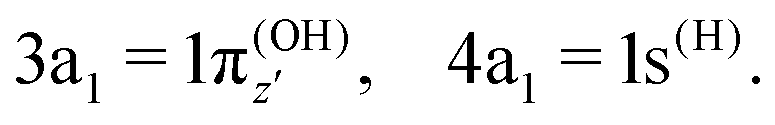
To understand the R-dependence of dcg, we can compare the asymptote of the wave functions of the ground, valence-excited and core-excited states at long OH separation, approximating R1 = ∞. We start with the ground state wave function. The molecular 3a1 and 4a1 orbitals transform, at R1 = ∞, into linear combinations of the OH 1π and H 1s orbitals of the fragments (see Fig. 3),
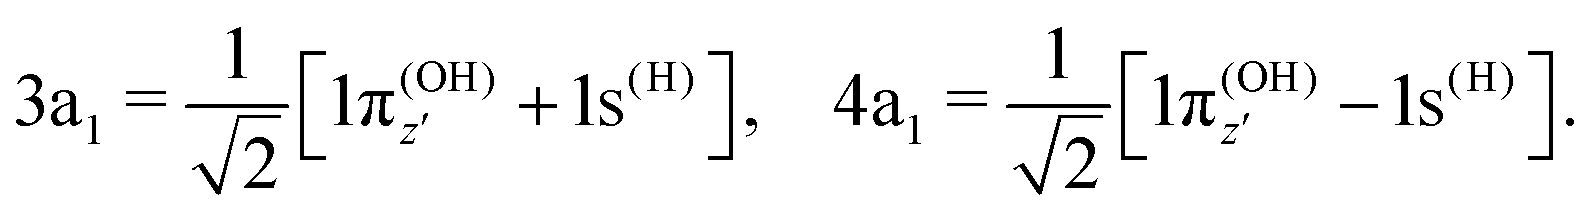 | (17) |
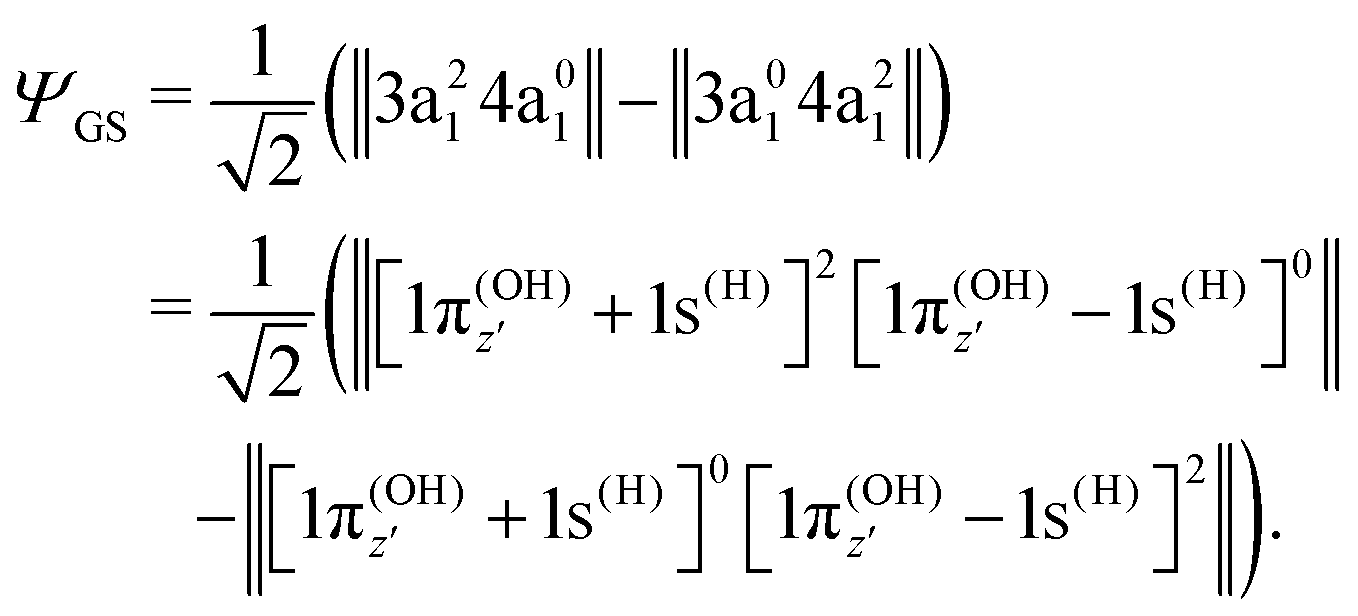 | (18) |
 | (19) |
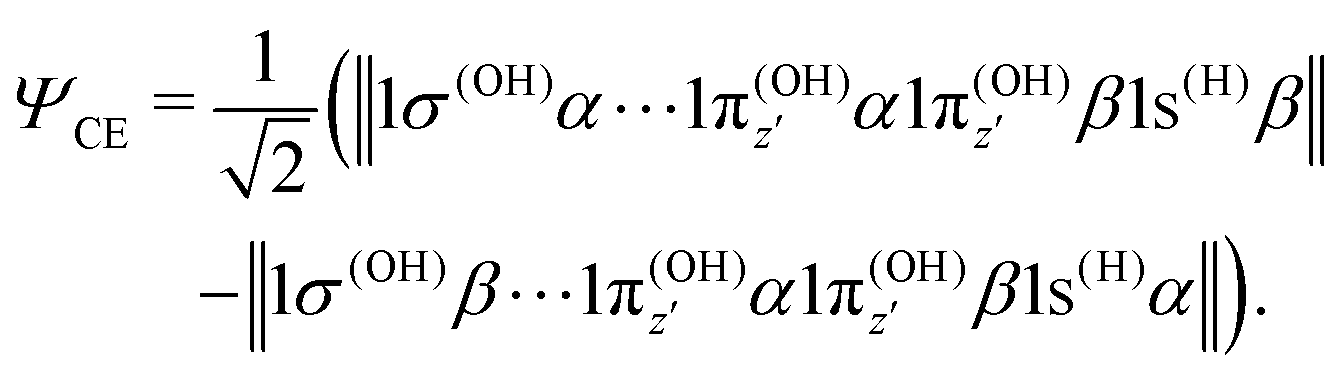
where α and β are the spin functions. For the core-excited state, as seen in Fig. 3, the 3a1 and 4a1 MOs instead transform at R1 = ∞ into:
 | (20) |
 | (21) |
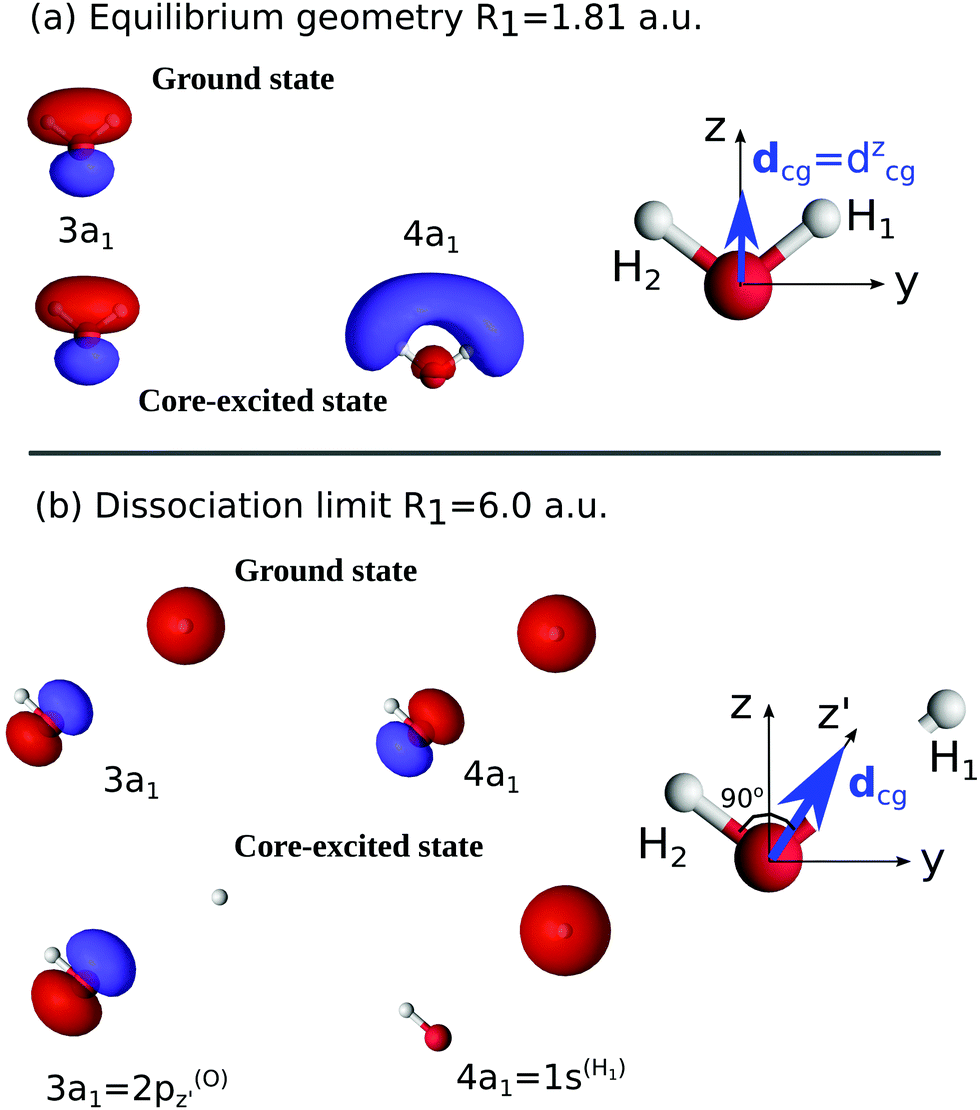 | ||
| Fig. 3 Natural orbitals at the equilibrium geometry R1 = R2 = 1.81 a.u. (a) and at the dissociation limit R1 = 6.0 a.u. (b). The rotation of the transition dipole moment dcg in the course of the dissociation is shown. | ||
We may also look at the asymptote of the valence-excited state wave function, ΨVE, in the same manner. At R1 = ∞, the 1b1 MO of the water molecule transforms into the 1π orbital of the OH fragment:
| 1b1 = 1π(OH)x, | (22) |
 | (23) |
3.3 Formation of the ultrafast fragmentation features in the RIXS spectra via dissociative core-excited states: 1D model
The lowest core-excited state in water |1s−1O4a11〉 is a dissociative state.4 When promoted to this state the molecule undergoes ultrafast breaking of the OH bond leading to an OH fragment and a H fragment as dissociation products. Due to the high energy release (about 3 eV) and low mass of the H fragment, the dissociation time is comparable to the core-hole lifetime of 4 fs.23 In the RIXS spectra, we see the fingerprint of UFD in the formation of an atomic-like peak corresponding to decay in the OH fragment. The process of the formation of this atomic-like peak is illustrated in the 1D model in Fig. 4. The ground state vibrational wave packet |ν0〉 is initially located near the minimum of the ground state PES, U0. The wave packet is promoted to the core-excited state PES, Uc, at moment τ = 0, and then it starts to propagate along the gradient leading to elongation of an OH-bond, reaching the dissociation region (∼6 a.u.) at τ ∼ 6 fs. As concluded by our previous study,4 the 1D model can properly describe the position of the atomic-like peak but not its exact profile. Indeed, the atomic-like resonance corresponds to the decay in the OH fragment, and due to this it is affected by the vibrational structure of the OH molecule. Nevertheless, we will focus on the 1D model of the atomic-like peak formation as it provides a very clear physical picture of the process. The full 2D model is used for comparison with experiment (see Section 3.5).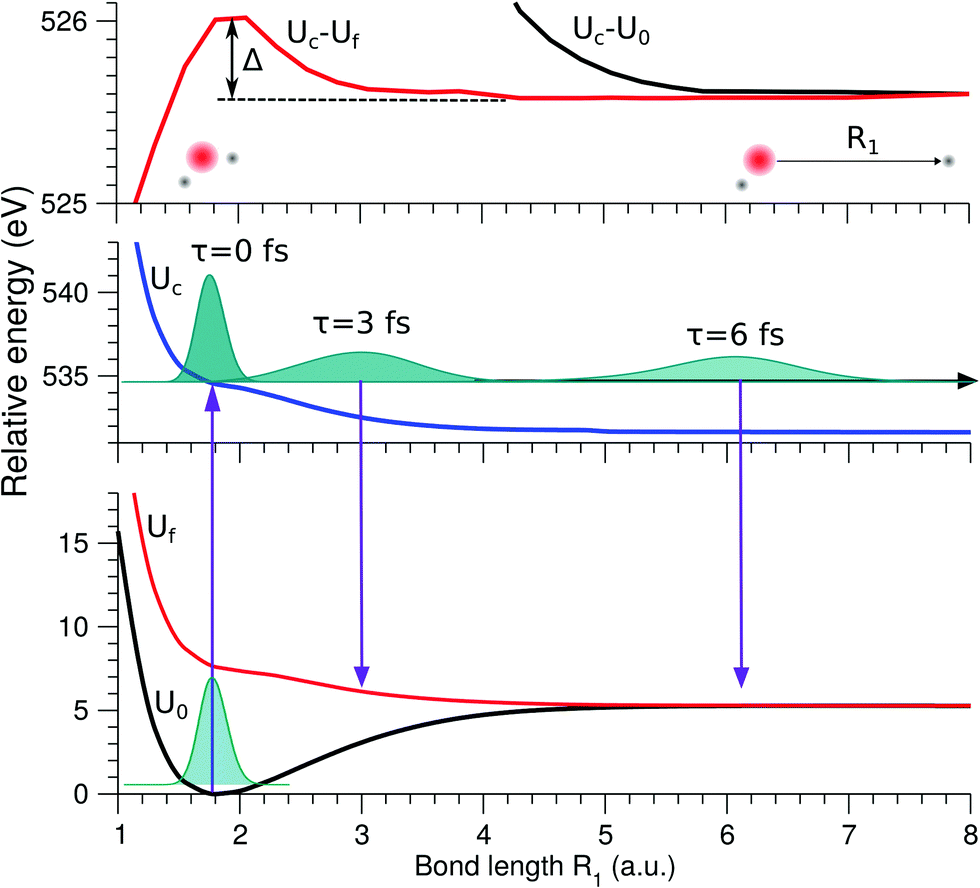 | ||
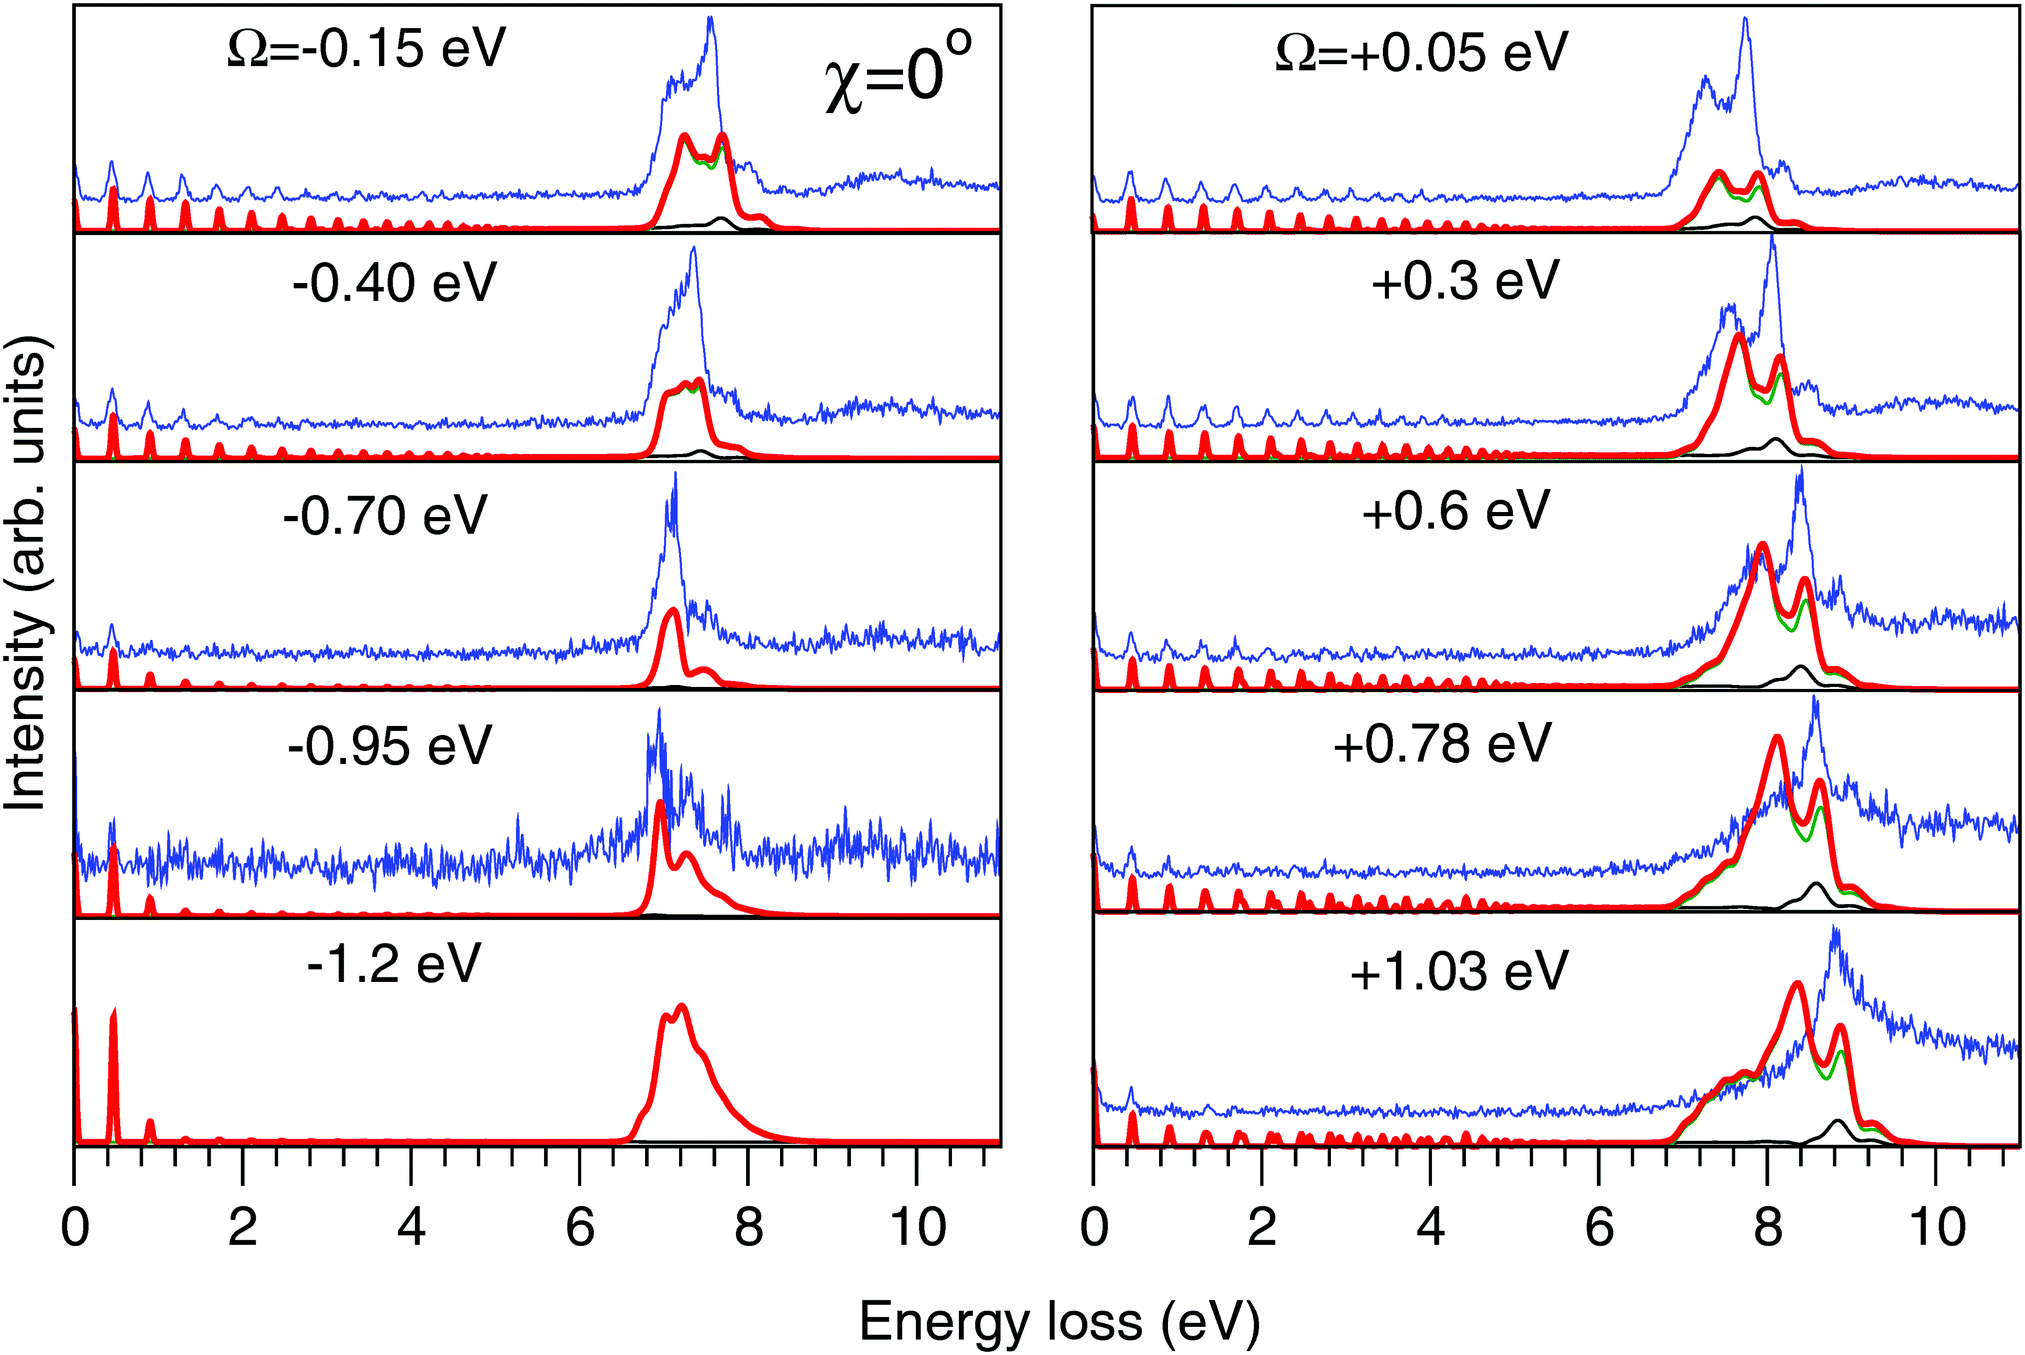
| Fig. 4 Scheme of the formation of the atomic-like and “pseudo-atomic” peaks following core-excitation of the water molecule to the |1s−1O4a11〉 state. The 1D cuts of the 2D stretching PES (Fig. 1) of the ground U0, core-excited Uc, and final Uf states are shown along single OH-bond (R1), while the second OH bond is kept at R2 = R0 = 1.81 a.u. The square of the core-excited wave packet at different propagation times, τ, is shown by shaded areas. The upper plot shows the energy difference between the core-excited and two final states of the RIXS process. The change in Uc − Uf (red line) between R1 = R0 and R1 ≈ 3 a.u., Δ ≈ 0.45 eV, corresponds to the energy splitting between the molecular band and the atomic-like peak in RIXS on top of the resonance (see Fig. 5, Ω = 0). | ||
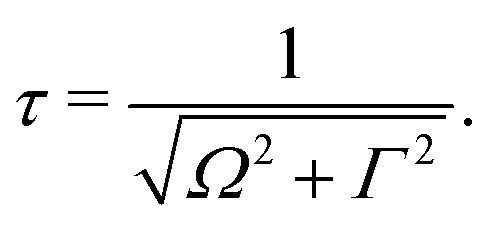
The excitation energy dependence of the RIXS spectra computed in the 1D model (Fig. 5) shows contributions from the decay channel to the ground state (blue line), valence-excited state (red line) and the total RIXS profile σ for χ = 90° eqn (15) (black line). At the dissociation limit, the ground and valence-excited states are degenerate (see Fig. 4), which implies that both RIXS decay channels yield their respective atomic-like peaks at the same photon emission energy ∼526.2 eV. The position of the atomic-like peak does not depend on the excitation energy, since the decay is taking place in the OH fragment (see dashed line in Fig. 5). Instead, as it is clearly seen in Fig. 5, the intensity of the atomic-like peak depends strongly on the photon excitation energy. Indeed, the strongest contribution is observed near the X-ray absorption resonance (Ω = ω − ω0c = 0), while for increasing of the positive detuning, Ω, the intensity of the atomic-like peak disappears. This is a well known effect, and is explained by the effective scattering duration,42 introduced as:
 | (24) |
 | ||
| Fig. 5 Theoretical RIXS spectra in the 1D model illustrating the formation of the atomic-like peak. X-ray detuning dependence of the spectral contribution from RIXS to the ground electronic state (blue line) and the lowest valence excited |1b−114a11〉 state (red line), as well as the total profile (black line) are shown. Ω = ω − ω0c is the detuning from the resonance with the core-excited |1s−1O4a11〉 state at ω0c = 534.15 eV; χ = 90°. | ||
As a general rule, a considerable increase of the spectral contribution from the molecular band relative to the atomic-like peak is observed following the increase of the absolute value of the detuning |Ω|42 (see Ω = 1 eV in Fig. 5). However, in the present case we instead observe an asymmetry with regard to the detuning dependence of the atomic-like peak and molecular band and would like comment on this. Let us consider the case Ω = −1 eV (lowest panel of Fig. 5). In this case we would expect a rather short scattering duration, according to the estimation using eqn (24). In full agreement with this, the atomic-like peak has, in principle, completely vanished for the quasi-elastic RIXS channel (blue line). However, for the inelastic RIXS channel the atomic-like peak is still very strong. This unexpected behavior can be explained by a particularity of the PESs of the core-excited and final valence-excited states. Indeed, from Fig. 4 we observe that the PESs, Uc and Uf, are nearly parallel to each other. Inspecting the energy difference between the curves, Uc − Uf, presented in the upper panel in Fig. 4, we can conclude that the PESs are parallel starting from a bond length of 3 a.u., corresponding to a bond elongation of 1.2 a.u. from the equilibrium geometry. This means that the wave packet reaches the region where the PESs are parallel at half the time it takes to reach the dissociation region at 6 a.u. The change in Uc − Uf (red line) between R1 = R0 and R1 ≈ 3 a.u., Δ ≈ 0.45 eV, approximately corresponds to the energy splitting between the molecular band and atomic-like peak in RIXS on top of the resonance (see Fig. 5, Ω = 0). It is worthwhile to note that this effect may also explain the double-peak |1b−114a11〉 structure in pre-edge RIXS in liquid water,8 where the UFD is limited due to local structure and the formation of the atomic-like peak is suppressed.
The strong similarity of the PESs of the core-excited and final states results in collapse of the vibrational structure.42 In the case of a bound to bound transition, the collapse effect causes vibrational progression to shrink to a single line; in a continuum to continuum transition, like the one studied here, the similarity of the PESs results in a strong narrowing of the spectral line, which now becomes similar to the atomic-like peak at 526.2 eV emission energy. In other words, even as we observe a “pseudo-atomic” peak, the profile of the inelastic RIXS channel at Ω = −1 eV, nevertheless, has a molecular character determined by the decay transition in the distorted H2O molecule. However, the peculiarity of the PESs produces a characteristic RIXS profile, which is very different from the one obtained at Ω = 1 eV. This effect is clearly absent in the quasi-elastic decay channel, where the shapes of the core-excited and final state PESs differ significantly from each other, as can be seen in the plot of U0 − Uc displayed in the upper panel of Fig. 4. Consequently, only the decay transitions in the OH fragment will contribute to σg in this energy range, resulting in a very weak signal at high detuning (see blue line), as is expected from a general discussion based on eqn (24).
In the present subsection we discussed the formation of RIXS spectra near the dissociation limit of the H2O molecule based on a simplified 1D model. However, the insights obtained for the 1D model could be fully applied for the discussion of an accurate 2D calculation in comparison with the experiment (see Section 3.5).
3.4 Complete breakdown of the Franck–Condon approximation in the RIXS spectra
The Franck–Condon (FC) principle43,44 states that the transition dipole moment is independent of the nuclear coordinates for the considered electronic transition. This approach usually provides reliable results when the electronic states involved are well isolated and the molecular symmetry is not broken in the course of the nuclear dynamics. However, the Franck–Condon approximation often breaks down for RIXS transitions. The water molecule is an example of a system where this occurs. As was discussed above, the transition dipole moment dcg experiences a sharp R-dependence due to a change in molecular symmetry during dissociation (see Fig. 3). 1D cuts of the transition dipole moment components dycg (red line) and dzcg (blue line) as a function of R1 (with R2 = R0) are shown in Fig. 6(a). We see how the dipole moment gradually rotates as a result of C2v symmetry breaking during the dissociation; from pointing purely along the z-axis immediately following excitation, to instead pointing in a direction orthogonal to the remaining OH bond in the course of dissociation, due to the change of molecular symmetry from C2v to C∞v. Moreover, its value increases significantly in response to the OH bond elongation. | ||
| Fig. 6 Crucial importance of the R-dependence of the dycg and dzcg components in the atomic-like peak formation. (a) R-dependence of the transition dipole moment components in the 1D case dycg(R1) (red line) and dzcg(R1) (blue line), R2 = R0 = 1.81 a.u.; the R-independent dipole moment approximation is shown by the black line dcg(R0) = dzcg(R0) = 0.018 a.u. (b) 1D model: σg cross section (violet line) computed taking into account the R-dependence of the transition dipole moment dcg(R) vs. the cross section σFCg (black line) computed using dcg(R0) = const. Contributions from the σyg (red line) and σzg (blue line) components (see eqn (15)) are shown in the lower panel. (c) Same as in (b), but using 2D model simulations. All calculations are done for χ = 90°. | ||
To evaluate the effect of the breakdown of the FC approximation, we compare simulations performed with constant transition dipole moment, dcg = dzcg(R0) = 0.018 a.u., with the full description, according to eqn (5–6), going beyond the FC approximation. Only the z-component contributes to the RIXS cross section of the quasi-elastic channel within the FC approximation σFCg, and after orientation averaging it reads
 | (25) |
The simulated 2D RIXS spectra for the quasi-elastic decay channel are displayed in Fig. 6(c). In general, the same conclusions on the breakdown of the FC approximation can be drawn as in the 1D case, discussed above. However, in the 2D case, the intensity of the atomic-like peak increases tenfold due to the breakdown of the FC approximation. It is important to note that it is essential to perform simulations beyond the FC approximation in order to reproduce and explain the experimental data. Indeed, the atomic-like peak at around 8 eV energy loss gets significant contribution from the quasi-elastic decay channel (see Section 3.5). However, this contribution is severely underestimated in the FC approximation.
For the inelastic RIXS channel, the transition dipole moment displays a rather weak R-dependence (Fig. 2). This is due to the non-bonding character of the 1b1 MO. Hence the transition from 1b1 to O1s does not result in geometric distortion. The 2D simulations for this channel are performed fully beyond the FC approximation, and the RIXS spectra for different scattering geometries are displayed in Fig. 7 and 8. However, the similarity of the RIXS spectra within and beyond the FC approximation (not shown here) implies that the R-dependence of the transition dipole moment can be neglected for the inelastic channel.
 | ||
| Fig. 7 Experimental (thin blue line) and theoretical (thick red line) RIXS spectra in the 2D model for χ = 90°. Partial contributions from the quasi-elastic channel (thin black line) and inelastic channel to the |1b−114a11〉 state (thin green line) are shown. The experimental spectra are shifted horizontally for better visibility. Values of the detuning from the top of the |1s−1O4a11〉 resonance (ω = 534.15 eV) are shown in the figure. The intensities of the experimental and theoretical spectra are normalized to the amplitude of the second peak (ν = 1, energy loss ∼0.46 eV) of the quasi-elastic scattering channel. The experimental feature at about 10 eV results from the scattering to the higher valence-excited state |3a−114a11〉,25 which is not considered in the present paper. | ||
 | ||
| Fig. 8 Experimental (thin blue line) and theoretical (thick red line) RIXS spectra in the 2D model for χ = 0°. Other details are the same as in Fig. 7. | ||
3.5 2D calculations in comparison with the experimental results
The experimental RIXS spectra for different detuning values from the top of the |1s−1O4a11〉 resonance are displayed in Fig. 7 and 8 for the experimental geometries: χ = 90° and χ = 0°, respectively. The experimental spectra (blue lines) are superimposed on the corresponding theoretical spectra (thick red lines). The contributions of the two RIXS channels (1) are shown in thin black (quasi-elastic decay channel) and green (inelastic decay channel) lines. As the intensity of the elastic peak (0 eV energy loss) is affected by Thomson scattering, which was not taken into account in our theory, the intensities of the experimental and theoretical spectra are normalized to the amplitude of the second peak (ν = 1, energy loss ∼0.46 eV) of the quasi-elastic scattering channel. In the present investigation, we focus on the UFD feature around 8 eV energy loss and neglect the higher valence-excited states seen in the experimental profile. For example, the peak at around 10 eV energy loss corresponds to the |3a−114a11〉 RIXS final state,25 which was not included in our theoretical simulations. In the comparison of Fig. 7 and 8, we notice some anisotropy of the RIXS spectra measured at the χ = 90° and χ = 0° geometries (see Fig. 9(a) for the experimental set up scheme). The major difference is in the intensity of an elastic peak at 0 eV energy loss, which is a result of the forbidden Thomson scattering channel in the χ = 0° measurement. Moreover, we can see that the relative intensities of the quasi-elastic vibrational progression (0–5 eV) and inelastic band (7–9 eV) are different for the χ = 90° and χ = 0° geometries. This is in agreement with theoretical simulations for the polarization dependence, which are compared directly in Fig. 9. The total RIXS cross sections (panel (b)) are computed using the partial cross sections σyg, σzg, and σxv (panel (c)) according to eqn (14). One can see that the inelastic channel intensity increases for the χ = 0° geometry, as compared to the χ = 90° geometry. The fine structure of the RIXS profiles does not show any strong anisotropy, except for the elastic peak at 0 energy loss, where the partial cross section σyg vanishes.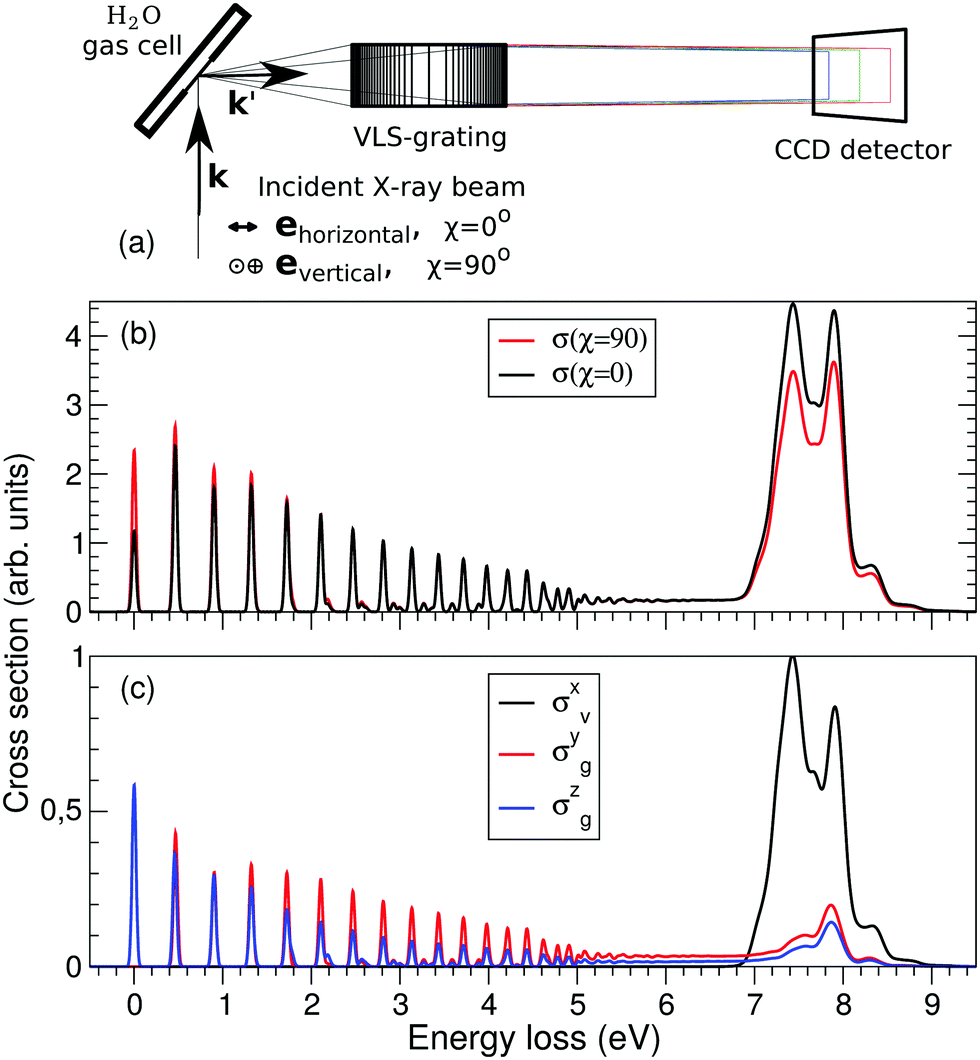 | ||
| Fig. 9 Polarization dependence of the RIXS cross sections. (a) Schematic representation of the experimental geometry for χ = 0 and 90 degrees measurements. (b) Theoretical total RIXS cross sections for the two measurement geometries used in the experiment, χ = 0° (black curve) and χ = 90° (red curve). (c) Partial cross sections used to compute the total σ(χ), see eqn (14). The excitation energy is tuned near the top of the XAS resonance, Ω = 0.05 eV. | ||
As was discussed above for the 1D model (Fig. 5), each of the two RIXS channels has two distinct parts: a molecular band and an atomic-like peak. Let us first consider the quasi-elastic RIXS channel (black curves) for the χ = 90° geometry (Fig. 7). The molecular band of this channel is represented by a long vibrational progression with an energy loss of 0.0–5.0 eV. This progression also reflects ultrafast propagation of the core-excited wave packet. Indeed, the vibrational progression is longer for excitation energies close to the |1s−14a11〉 resonance, where the scattering duration time is longest, and decreases rapidly with increasing detuning. The atomic-like peak – which we remember is the signature of the UFD – appears at 8 eV energy loss when the excitation energy is tuned to the |1s−1O4a11〉 resonance. The fine-structure of the atomic-like peak arises from the vibrational structure in the OH fragment, as discussed in Section 3.3. The intensity of the atomic-like peak is maximal for small detuning, and decreases rapidly with increasing the negative detuning, according to the scattering duration concept eqn (24). For the positive energy detuning, however, the peak intensity decreases at a slower rate. The same behavior is observed in the simulations using the 1D model (see Fig. 5). This asymmetric behavior can be explained by the shape of the core-excited PES. Indeed, for excitation energies corresponding to negative detuning, the core-excited state PES, Uc (Fig. 4), is shallow. As a result, less kinetic energy is transferred to the core-excited wave packet. Therefore the wave packet propagation is slow and the scattering duration time is too short for the wave-packet to reach the dissociation region. At higher excitation energies, on the other hand, the wave packet experiences a larger gradient of the PES, which results in fast dynamics, reflected in a strong UFD feature. Therefore, even larger positive detuning is required for the atomic-like peak to vanish. This situation cannot be observed in the experimental data due to the overlap with scattering from the |1s−1O2b12〉 core-excited state resonance at 536 eV.4,5
Now let us discuss the scattering channel reaching the valence-excited state (red lines in Fig. 7), which contributes intensity to the spectra near 8 eV energy loss. This transition results in a double-peak structure, representing both the molecular band and the atomic-like peak. This double-peak structure has already been discussed as an UFD feature in the literature.25 The experiment by Weinhardt et al.25 compares the relative intensities of the two peaks for the H2O, HDO and D2O isotopomers. The experiment in ref. 25 shows a clear decrease of the intensity of the component at higher energy loss due to isotopic substitution (HDO, D2O). Indeed, the dissociation of the bond with the heavier atom (D) is slower than that with H, and due to this the atomic-like peak intensity is lower. This experimental result is in perfect agreement with our theoretical simulations. We will discuss the details of the effect of isotopic substitution on dissociation in Section 3.6. The detuning dependence of the atomic-like peak of the valence-excited state shows exactly the same behavior as the atomic-like line for the quasi-elastic channel. Moreover, the molecular band of the valence-excited state shrinks to a narrow “pseudo-atomic” peak at large negative detuning due to the similarity of the core- and valence-excited state PESs (see discussion in Section 3.3). In the high-resolution RIXS experiment presented in Fig. 7, we also see a third small peak at 8.2 eV energy loss (panel Ω = +0.05 eV, Fig. 7). This peak is reproduced by our theoretical simulations and can now without a doubt be attributed to the vibrational structure of the OH fragment in the atomic-like peak.
We have, hence, made important new findings: the UFD feature consist of contributions from both quasi-elastic and inelastic decay channels. These channels are characterised by different vibrational structure and intensity and their interplay results in the splitting of the |1b−114a11〉 emission line. Fig. 7 and 8 show that our theoretical simulations underestimate the atomic-like intensity. We ascribe this disagreement to inaccuracy in the transition dipole moment calculation at the dissociative region. Variation of the active space to include two additional virtual MOs of a′ symmetry and one additional virtual MO of a′′ symmetry, as well as limiting the state-averaging, resulted in a 5–15% increase of the transition dipole moments. These changes result in a slight relative increase of the molecular contribution of the quasi-elastic channel, however, the relative intensities of the pseudo-atomic and atomic-like contributions are not affected.
3.6 Dissociation dynamics in the case of isotopic substitutes HDO and D2O
Fig. 10(a–e) shows the effect of isotopic substitution on the RIXS cross section. We will start by discussing components of the separate cross sections of the quasi-elastic and inelastic channels: σzg and σyg, where only the atomic-like peak is visible in the energy window displayed in Fig. 10, and σxv, where both the molecular band and the atomic-like peak lie in this energy window. In Fig. 10(a), we notice that the intensity of the atomic line of D2O is weaker than of HDO and H2O in σzg, Fig. 10(a). This is a consequence of the higher inertia of the deuterated molecules leading to slower dynamics of the D–O⋯D dissociation, resulting in a smaller signal of the OD fragment than of the OH fragment. The intensity of the atomic-like peak is comparable in the H2O (7.87 eV energy loss) and HDO (7.88 eV energy loss) spectra, since the HDO spectrum contains contribution from both the H⋯OD and D⋯OH dissociation. This is explained by the former pathway having a higher probability due to lower reduced mass.40 The spectrum of H2O displays a shoulder in the atomic-like peak at 7.58 eV energy loss. The spectrum of D2O shows a similarly split profile, with the main feature at 7.88 eV energy loss and the weak shoulder at 7.62 eV. In contrast, the spectrum of HDO displays a lack of intensity at the energy loss of the shoulder features in the H2O and D2O spectra. This effect can be explained by different vibrational structure in the dissociation fragments OH and OD.4 The vibrational frequency in OD is smaller than the one in OH, and in the case of HDO fragmentation both channels leading to OH and OD fragments contribute coherently to the spectrum, which results in the mentioned intensity decrease in the HDO spectrum. The energy shift of the atomic-like peak and the shoulder feature in H2O and D2O can be also explained by the slightly different vibrational structures in the OH and OD fragments.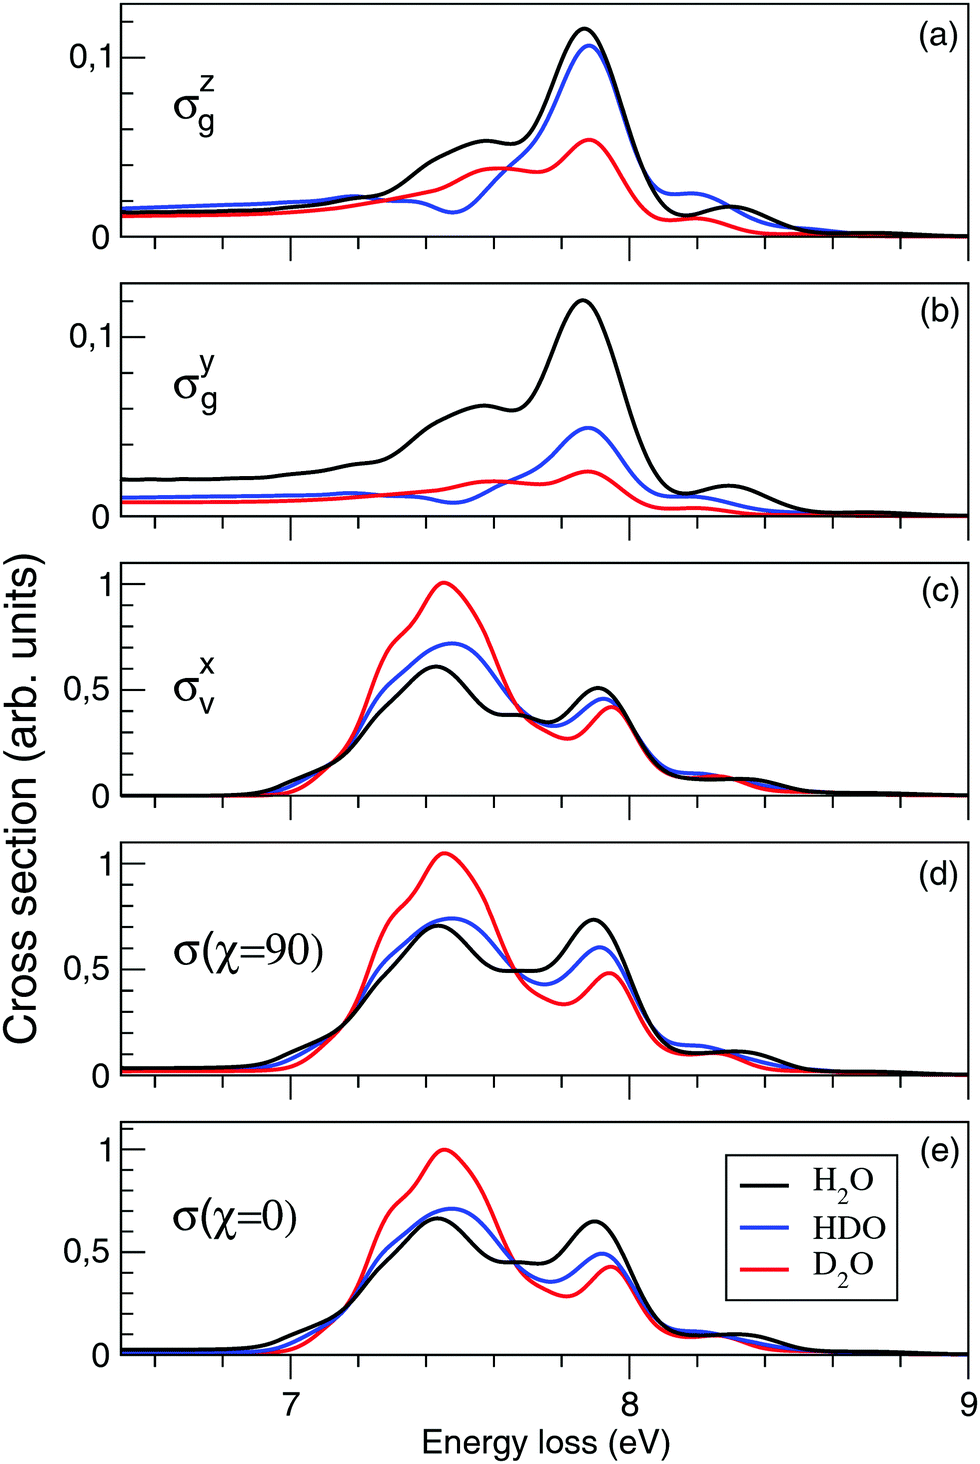 | ||
| Fig. 10 Isotopic substitution effect on the nuclear dynamics (theory). The partial contribution of the z-, y-, and x-components and the total RIXS spectra for χ = 90° and χ = 0° are shown. Notice the difference in intensity for the quasi-elastic and inelastic decay channels. | ||
We will continue the analysis by looking at σyg, displayed in Fig. 10(b). For larger distortions, σzg and σyg become equally important due to the rotation of the transition dipole moment. We notice that for D2O the intensity of the atomic-like peak in σyg is significantly weaker than in σzg. The spectra of H2O, on the other hand, show similar intensities of the atomic-like peak for both components. The intensity of the atomic-like peak of HDO is, similar to D2O, weaker in σyg than in σzg. This can be explained by a stronger z-component of the transition dipole moment as compared to the y-component at long bond distances R ∼ 6 a.u. (see Fig. 6), where heavier fragments (deuterium) have a low probability to reach the dissociation region before the decay event occurs. Due to this, in both HDO and D2O, the cross sections of σyg are smaller than the corresponding cross sections of σzg.
The intensity of σxv, displayed in Fig. 10(c), is larger than the components σyg and σzg of the ground state, as it contains both molecular and atomic-like contributions from the inelastic channel. The atomic-like contribution is strong in all three molecules, significantly stronger than in σyg and σzg, due to the parallel PES of the valence- and core-excited states (discussed for H2O in Section 3.3). As we notice in Fig. 4, we are not only detecting the long distance contribution to the atomic-like peak, but also contribution from short time dynamics. For D2O the molecular contribution dominates, while for H2O and HDO the molecular and atomic-like contributions are, in principal, comparable. As was already mentioned, the energy and profile of the molecular band are affected by the different vibrational structures of D2O, H2O and HDO.
The total cross sections for χ = 90° and for χ = 0° are displayed in Fig. 10(d and e). The cross section of the inelastic channel, σxv, has the largest contribution to the total spectra. The overall profile is not affected by the polarization, however, the cross section is smaller for χ = 90° following from eqn (15).
Our theoretical spectra show a similar trend upon deuteriation as the experimental spectra of Weinhardt et al.,25 where a strong isotope effect between H2O and D2O was observed. The isotope substitution has a different effect on the lineshape of the quasi-elastic and inelastic channels. Indeed, σzg and σyg contributions result in an isotope independent position of the atomic-like peak at 7.86 eV, while for the σxv component (inelastic channel) the position of the peak is shifted from 7.90 to 7.94 eV for H → D isotope substitution (Fig. 10). This effect, in principle, makes it possible to separate the contributions of the scattering channels. However, as the inelastic contribution dominates the total spectra (with the inelastic cross section about five times stronger than the quasi-elastic one), a high resolution and high statistics measurement would be necessary to be able to quantify the quasi-elastic contribution experimentally. The only robust way to separate the pseudo-atomic (inelastic) and atomic-like (quasi-elastic) contributions is to make use of the different formation times of these spectral features by varying the detuning from the X-ray absorption resonance (see eqn (24) and Fig. 7 and 8).
4 Conclusions
In this work we have presented an investigation of experimental and theoretical 1D and 2D resonant inelastic X-ray scattering (RIXS) spectra including two decay channels of the dissociative |1s−1O,4a−11〉 core-excited state; the quasi-elastic decay channel and the inelastic decay channel to the dissociative |1b−11,4a11〉 valence-excited state. From previous studies4,5 we have learned how core-excited state dynamics and RIXS spectra are dictated by the character of the potential energy surfaces (PESs) of the involved core-excited and final states. Due to the dissociative character of the core-excited state, X-ray photo-absorption at the |1s−1O4a11〉 resonance leads to ultrafast dissociation (UFD) producing OH and H fragments. In the spectral profile, the fingerprint of UFD is observed as the formation of an atomic-like peak, representing fluorescence decay in the OH fragment. The RIXS spectra are therefore formed by contributions from decay in the distorted H2O molecule, forming the so called molecular band, and in the OH fragment. We notice an asymmetry in the detuning dependence of the RIXS profiles. For the quasi-elastic decay channel, we observe that the atomic-like peak vanishes for large detuning. However, for the inelastic decay channel, we observe a strong atomic-like contribution at large negative detuning but not at large positive detuning. This is the result of a collapse of the vibrational structure brought on by the parallel PESs of the core-excited and valence-excited states. This “pseudo-atomic” peak, from decay in the slightly distorted H2O molecule, coincides in energy with the “real” atomic-like peak, associated with the OH fragment, at −1 eV detuning. This effect may cause a double-peak structure, observed in RIXS of liquid water for pre-edge excitation.In this study we have also investigated the important role of the transition dipole moment, which exhibits a strong R-dependence already at relatively moderate molecular distortion around the equilibrium. As a result of the C2v symmetry breaking, we observe a rotation of the transition dipole moment describing the quasi-elastic decay during the dissociation. By neglecting the R-dependence of this transition dipole moment, we notice a severe underestimation of the intensity of the atomic-like peak in the quasi-elastic RIXS spectrum. In contrast, the transition dipole moment of the inelastic decay has a very weak R-dependence, due to the non-bonding character of the 1b1 molecular orbital and may in general be neglected.
By comparing theoretical and experimental RIXS spectra, we show unequivocally that the UFD feature, in fact, results from an interplay of two decay processes; the quasi-elastic decay and the inelastic decay to the |1b−114a11〉 valence-excited state. The molecular and atomic-like contributions occur at slightly different energies, resulting in the splitting of the |1b−114a11〉 RIXS feature. We do observe an underestimation of the atomic-like peak in the theoretical RIXS spectra which we believe is a result of inaccuracies in the representation of the transition dipole moment in the dissociative region.
Isotopic substitution alters the shape and intensity of the RIXS features due to the difference in vibrational structure. The heavier mass of the D2O molecule means that it dissociates to a lesser degree than the H2O molecule. Therefore the slower D–O⋯D dynamics reduces the atomic-like contribution for the D2O molecules than for HDO and H2O. As the z-component of the transition dipole moment is stronger than the y-component at short distances, the atomic-like peak in the z-component of the quasi-elastic cross section of D2O is stronger than in the y-component. In the case of HDO, both the OD and OH dynamics contribute to the cross section, yielding intermediate behavior. In the inelastic channel, the molecular contribution dominates for D2O while for H2O and HDO, the molecular and atomic-like contributions are comparable.
Author contributions
E. E. and V. K. were responsible for preparing the text and figures of the manuscript. E. E. and M. O. performed all the electronic structure calculations. V. K., V. S., N. I., V. V. C., R. C. C., and F. G. developed the theory for the nuclear dynamics and performed all the nuclear dynamics calculations. S. E., M. F., M. D., B. K., T. S., A. P. and A. F. planned and carried out the experimental measurements and the data analysis of the collected data. All authors contributed to the writing of the paper and reviewed the manuscript.Conflicts of interest
There are no conflicts of interest to declare.Acknowledgements
The experiments were performed at the ADRESS beamline of the Swiss Light Source at the Paul Scherrer Institut. Numerical simulations performed on the resources provided by the Swedish National Infrastructure for Computing (SNIC). This work was supported by the Swedish Research Council (VR 2015-03781, 2015-03956, 2015-04510), the Knut and Alice Wallenberg foundation (Grant No. KAW-2013.0020), Carl Tryggers Stiftelse (CTS KF 17:9), and Russian Scientific Foundation (project 16-12-10109). V. V. C. and R. C. C. acknowledge the Conselho Nacional de Desenvolvimento Científico e Tecnológico (CNPq – Brazil, 234625/2014-7). S. E. and A. F. acknowledge funding from the ERC-ADG-2014 (Advanced Investigator Grant 669531/EDAX) under the Horizon 2020 EU Framework Programme for Research and Innovation.References
- F. Hennies, A. Pietzsch, M. Berglund, A. Föhlisch, T. Schmitt, V. N. Strocov, H. O. Karlsson, J. Andersson and J.-E. Rubensson, Phys. Rev. Lett., 2010, 104, 193002 CrossRef PubMed.
- J.-E. Rubensson, J. Söderström, C. Binggeli, J. Gråsjö, J. Andersson, C. Såthe, F. Hennies, V. Bisogni, Y. Huang, P. Olalde, T. Schmitt, V. N. Strocov, A. Föhlisch, B. Kennedy and A. Pietzsch, Phys. Rev. Lett., 2015, 114, 133001 CrossRef PubMed.
- A. Pietzsch, Y.-P. Sun, F. Hennies, Z. Rinkevicius, H. O. Karlsson, T. Schmitt, V. N. Strocov, J. Andersson, B. Kennedy, J. Schlappa, A. Föhlisch, J.-E. Rubensson and F. Gel'mukhanov, Phys. Rev. Lett., 2011, 106, 153004 CrossRef PubMed.
- V. V. Cruz, E. Ertan, R. C. Couto, S. Eckert, M. Fondell, M. Dantz, B. Kennedy, T. Schmitt, A. Pietzsch, F. F. Guimarães, H. Ågren, F. Gel'mukhanov, M. Odelius, A. Föhlisch and V. Kimberg, Phys. Chem. Chem. Phys., 2017, 19, 19573–19589 RSC.
- R. C. Couto, V. V. Cruz, E. Ertan, S. Eckert, M. Fondell, M. Dantz, B. Kennedy, T. Schmitt, A. Pietzsch, F. F. Guimarães, H. Ågren, F. Gel'mukhanov, M. Odelius, V. Kimberg and A. Föhlisch, Nat. Commun., 2017, 8, 14165 CrossRef PubMed.
- Y.-P. Sun, A. Pietzsch, F. Hennies, Z. Rinkevicius, H. O. Karlsson, T. Schmitt, V. N. Strocov, J. Andersson, B. Kennedy, J. Schlappa, A. Föhlisch, F. Gel'mukhanov and J.-E. Rubensson, J. Phys. B: At., Mol. Opt. Phys., 2011, 44, 161002 CrossRef.
- Y.-P. Sun, F. Hennies, A. Pietzsch, B. Kennedy, T. Schmitt, V. N. Strocov, J. Andersson, M. Berglund, J.-E. Rubensson, K. Aidas, F. Gel'mukhanov, M. Odelius and A. Föhlisch, Phys. Rev. B: Condens. Matter Mater. Phys., 2011, 84, 132202 CrossRef.
- A. Pietzsch, F. Hennies, P. S. Miedema, B. Kennedy, J. Schlappa, T. Schmitt, V. N. Strocov and A. Föhlisch, Phys. Rev. Lett., 2015, 114, 088302 CrossRef PubMed.
- S. Schreck, A. Pietzsch, B. Kennedy, C. Såthe, P. S. Miedema, S. Techert, V. N. Strocov, T. Schmitt, F. Hennies, J.-E. Rubensson and A. Föhlisch, Sci. Rep., 2016, 7, 20054 CrossRef PubMed.
- E. Ertan, V. Kimberg, F. Gel'mukhanov, F. Hennies, J.-E. Rubensson, T. Schmitt, V. N. Strocov, K. Zhou, M. Iannuzzi, A. Föhlisch, M. Odelius and A. Pietzsch, Phys. Rev. B, 2017, 95, 144301 CrossRef.
- S. Johnston, C. Monney, V. Bisogni, K.-J. Zhou, R. Kraus, G. Behr, V. N. Strocov, J. Málek, S.-L. Drechsler, J. Geck, T. Schmitt and J. van den Brink, Nat. Commun., 2016, 7, 10563 CrossRef PubMed.
- M. Odelius, H. Ogasawara, D. Nordlund, O. Fuchs, L. Weinhardt, F. Maier, E. Umbach, C. Heske, Y. Zubavichus, M. Grunze, J. D. Denlinger, L. G. M. Pettersson and A. Nilsson, Phys. Rev. Lett., 2005, 94, 227401 CrossRef PubMed.
- V. Kimberg, T. Gejo, M. Oura, T. Tokushima, Y. Horikawa, H. Arai, S. Shin and N. Kosugi, Phys. Rev. A: At., Mol., Opt. Phys., 2012, 85, 032503 CrossRef.
- O. Travnikova, J.-C. Liu, A. Lindblad, C. Nicolas, J. Söderström, V. Kimberg, F. Gel'mukhanov and C. Miron, Phys. Rev. Lett., 2010, 105, 233001 CrossRef PubMed.
- O. Travnikova, V. Kimberg, R. Flammini, X.-J. Liu, M. Patanen, C. Nicolas, S. Svensson and C. Miron, J. Phys. Chem. Lett., 2013, 4, 2361–2366 CrossRef.
- F. Gel'mukhanov, V. Kimberg and H. Ågren, Chem. Phys., 2004, 299, 253–258 CrossRef.
- P. Morin and C. Miron, J. Electron Spectrosc. Relat. Phenom., 2012, 185, 259–266 CrossRef.
- P. Sałek, V. Carravetta, F. Gel'mukhanov and H. Ågren, J. Chem. Phys., 2002, 116, 629 CrossRef.
- M. Neeb, J.-E. Rubensson, M. Biermann and W. Eberhardt, J. Electron Spectrosc. Relat. Phenom., 1994, 67, 261–274 CrossRef.
- A. N. de Brito, R. Feifel, A. Mocellin, A. B. Machado, S. Sundin, I. Hjelte, S. L. Sorensen and O. Björneholm, Chem. Phys. Lett., 1999, 309, 377–385 CrossRef.
- I. Hjelte, M. Piancastelli, R. Fink, O. Björneholm, M. Bässler, R. Feifel, A. Giertz, H. Wang, K. Wiesner, A. Ausmees, C. Miron, S. L. Sorensen and S. Svensson, Chem. Phys. Lett., 2001, 334, 151–158 CrossRef.
- M. N. Piancastelli, A. Hempelmann, F. Heiser, O. Gessner, A. Rüdel and U. Becker, Phys. Rev. A: At., Mol., Opt. Phys., 1999, 59, 300–306 CrossRef.
- R. Sankari, M. Ehara, H. Nakatsuji, Y. Senba, K. Hosokawa, H. Yoshida, A. D. Fanis, Y. Tamenori, S. Aksela and K. Ueda, Chem. Phys. Lett., 2003, 380, 647–653 CrossRef.
- M. Eroms, O. Vendrell, M. Jungen, H.-D. Meyer and L. S. Cederbaum, J. Chem. Phys., 2009, 130, 154307 CrossRef PubMed.
- L. Weinhardt, A. Benkert, F. Meyer, M. Blum, R. G. Wilks, W. Yang, M. Bär, F. Reinert and C. Heske, J. Chem. Phys., 2012, 136, 144311 CrossRef PubMed.
- V. N. Strocov, T. Schmitt, U. Flechsig, T. Schmidt, A. Imhof, Q. Chen, J. Raabe, R. Betemps, D. Zimoch, J. Krempasky, X. Wang, M. Grioni, A. Piazzalunga and L. Patthey, J. Synchrotron Radiat., 2010, 17, 631–643 CrossRef PubMed.
- G. Ghiringhelli, A. Piazzalunga, C. Dallera, G. Trezzi, L. Braicovich, T. Schmitt, V. N. Strocov, R. Betemps, L. Patthey, X. Wang and M. Grioni, Rev. Sci. Instrum., 2006, 77, 113108 CrossRef.
- P.-Å. Malmqvist, A. Rendell and B. O. Roos, J. Phys. Chem., 1990, 94, 5477–5482 CrossRef.
- F. Aquilante, L. De Vico, N. Ferré, G. Ghigo, P.-Å. Malmqvist, P. Neogrády, T. B. Pedersen, M. Pitonak, M. Reiher, B. O. Roos, L. Serrano-Andrés, M. Urban, V. Veryazov and R. Lindh, J. Comput. Chem., 2010, 31, 224–247 CrossRef PubMed.
- F. Aquilante, J. Autschbach, R. K. Carlson, L. F. Chibotaru, M. G. Delcey, L. De Vico, I. F. Galván, N. Ferré, L. M. Frutos, L. Gagliardi, M. Garavelli, A. Giussani, C. E. Hoyer, G. Li Manni, H. Lischka, D. Ma, P.-Å. Malmqvist, T. Müller, A. Nenov, M. Olivucci, T. B. Pedersen, D. Peng, F. Plasser, B. Pritchard, M. Reiher, I. Rivalta, I. Schapiro, J. Segarra-Martí, M. Stenrup, D. G. Truhlar, L. Ungur, A. Valentini, S. Vancoillie, V. Veryazov, V. P. Vysotskiy, O. Weingart, F. Zapata and R. Lindh, J. Comput. Chem., 2016, 37, 506–541 CrossRef PubMed.
- M. Guo, L. K. Sørensen, M. G. Delcey, R. V. Pinjari and M. Lundberg, Phys. Chem. Chem. Phys., 2016, 18, 3250–3259 RSC.
- B. O. Roos, R. Lindh, P.-Å. Malmqvist, V. Veryazov and P.-O. Widmark, J. Phys. Chem. A, 2004, 108, 2851–2858 CrossRef.
- N. Douglas and N. M. Kroll, Ann. Phys., 1974, 82, 89–155 Search PubMed.
- B. A. Hess, Phys. Rev. A, 1986, 33, 3742–3748 CrossRef.
- P. Å. Malmqvist, B. O. Roos and B. Schimmelpfennig, Chem. Phys. Lett., 2002, 357, 230 CrossRef.
- P.-Å. Malmqvist, K. Pierloot, A. R. M. Shahi, C. J. Cramer and L. Gagliardi, J. Phys. Chem., 2008, 128, 204109 CrossRef PubMed.
- P.-Å. Malmqvist and B. O. Roos, Chem. Phys. Lett., 1989, 155, 189–194 CrossRef.
- P.-Å. Malmqvist, B. O. Roos and B. Schimmelpfennig, Chem. Phys. Lett., 2002, 357, 230–240 CrossRef.
- N. Ignatova, V. V. da Cruz, R. C. Couto, E. Ertan, M. Odelius, H. Ågren, F. F. Guimarães, A. Zimin, S. P. Polyutov, F. Gel'mukhanov and V. Kimberg, Phys. Rev. A: At., Mol., Opt. Phys., 2017, 95, 042502 CrossRef.
- N. Ignatova, V. V. Cruz, R. C. Couto, E. Ertan, A. Zimin, F. F. Guimarães, S. Polyutov, H. Ågren, V. Kimberg, M. Odelius and F. Gel'mukhanov, Sci. Rep., 2017, 7, 43891 CrossRef PubMed.
- V. V. da Cruz, V. Savchenko, N. Ignatova, R. C. Couto, E. Ertan, M. Odelius, F. Gel'mukhanov and V. Kimberg, 2018, to be published.
- F. Gel'mukhanov and H. Ågren, Phys. Rep., 1999, 312, 87–330 CrossRef.
- J. Franck and E. G. Dymond, Trans. Faraday Soc., 1926, 21, 536 RSC.
- E. Condon, Phys. Rev., 1926, 28, 1182–1201 CrossRef.
| This journal is © the Owner Societies 2018 |