
 Open Access Article
 This Open Access Article is licensed under a
 Creative Commons Attribution 3.0 Unported Licence
Characterizing the hydrophobic-to-hydrophilic transition of electrolyte structuring in proton exchange membrane mimicking surfaces†
Laila
Moreno Ostertag‡
ab,
Xiao
Ling‡
 c,
Katrin F.
Domke
c,
Sapun H.
Parekh
c and
Markus
Valtiner
*ab
c,
Katrin F.
Domke
c,
Sapun H.
Parekh
c and
Markus
Valtiner
*ab
aInterface Chemistry and Surface Engineering, Max-Planck-Institut für Eisenforschung GmbH, Max-Planck-Str. 1, D-40237 Düsseldorf, Germany. E-mail: valtiner@mpie.de
bInstitute of Applied Physics, Technische Universität Wien, Wiedner Hauptstraße 8, A-1040 Vienna, Austria
cDepartment of Molecular Spectroscopy, Max-Planck-Institut für Polymerforschung, Ackermannweg 10, D-55128 Mainz, Germany
First published on 9th April 2018
Abstract
The surface density of charged sulfonic acid head groups in a perfluorosulfonic acid (PFSA) proton exchange membrane determines the hydrophilicity of the ionic channels and is thus critical for the structuring and transport of water and protons. The mechanism through which the head group density affects the structuring of water and ions is unknown, largely due to experimental challenges in systematically varying the density in an appropriate model system resembling the ionic channels. Here, we present a model system for PFSA membrane ionic channels using self-assembled monolayers with a tunable surface density of sulfonic acid and methyl groups to tune surface hydrophilicity. Atomic force microscopy force–distance measurements were used to quantify the hydration forces and deduce the interfacial electrolyte structure. The measured force profiles indicate a pronounced change of the electrolyte layering density at the surface with an unexpectedly sharp hydrophobic-to-hydrophilic transition when the surface shows a contact angle of ∼37°. Using an extended Derjaguin–Landau–Verwey–Overbeek model including the Hydra force, we quantify diffuse double layer charges and characteristic hydration lengths as a function of sulfonic acid group density on the surface. Translating our results to PFSA membranes, these findings have two implications: (1) the density of sulfonic acid head groups can have a dramatic effect on the local solvent structuring of water inside the ionic channels and (2) they support a view where two types of water (solution) exist in PFSA ionic channels – a structured (shell/surface) and a non-structured (bulk) water. This offers an interesting perspective on how different head group densities lead to changes in water and proton transport and macroscopic membrane conductivity properties based on hydration layer characteristics.
Introduction
Perfluorosulfonic acid (PFSA) proton exchange membranes (PEMs) are one of the key components for PEM fuel cells (PEMFCs) and largely determine the performance of PEMFCs.1 Nafion membranes are the most widely used PFSA membranes in PEMFCs because of their outstanding chemical stability for long-term use and reasonable proton conductivity. Improving the proton conductivity of Nafion to optimize PEMFC performance is an active area of research.1–3 In a Nafion membrane, hydrophilic sulfonic acid head groups (–SO3H) aggregate to form ionic channels of about 3–6 nm in diameter that are distributed in a hydrophobic Teflon matrix.4,5 In different versions of Nafion, the degree of hydrophilicity of the channels is tuned by a variation of the –SO3H density in the polymer. While water and proton transport are known to occur through these ionic channels,4,6–8 the fluid structure in the channels and the exact transport mechanism are not well understood at the molecular scale, which hinders bottom-up design of PEMs with improved transport properties.Previous work by our group9 and others10,11 has reported that the chemical constitution of the ionic domains – particularly the surface density of sulfonic acid groups – in Nafion membranes strongly affects water structuring, water transport, and proton transport under fully hydrated conditions. However, these works were based on Nafion systems with given –SO3H densities, and predictions of the effect of sulfonic acid group density on structural and transport membrane properties has emerged almost exclusively from theory. To experimentally elucidate the influence of sulfonic acid group surface density on the structural and transport properties of Nafion membranes, an appropriate model system for the ionic channel surfaces that allows systematic variation of the surface hydrophilicity/hydrophobicity5,12 combined with a method to measure liquid structures and surface interactions on the molecular scale is required.
To emulate the pore environment inside Nafion ionic channels, we functionalized gold surfaces with short aliphatic thiols terminated either by –SO3H (hydrophilic head group) or by –CH3 (hydrophobic head group) with a systematic variation in hydrophilicity (–SO3H/–CH3 ratio) to span degrees of sulfonation that can be found in conventional PEMs. We analyzed the effect of surface hydrophilicity on the hydration forces between two opposing, similarly functionalized surfaces in an aqueous acidic electrolyte with atomic force microscopy (AFM) force–distance measurements, which have proven to be effective in characterizing fluid structuring between two surfaces.13 In particular, surface interaction forces were measured, and hydrophilic and hydrophobic hydration were modeled according to the empirical Hydra model.14 With this AFM-Hydra model approach, we characterize the electrolyte structure between two opposing, functionalized Au surfaces of varying degree of sulfonation (hydrophilicity), which approximates the channel environment in PFSA membranes.
Materials and methods
All reactants were used as received unless otherwise stated. Solvents were MilliQ water (Millipore, resistivity of ≥18 MΩ cm, TOC below 2 ppb), ethanol (≥99.8%, Sigma-Aldrich, Germany), and hexane (≥95%, Sigma Aldrich, Germany). Functionalized surfaces were prepared by immersing gold substrates and tips in ethanol solutions of sodium 3-mercapto-1-propanesulfonate (HS(CH2)3–SO3Na, 90%, Sigma-Aldrich, Germany) and 1-butanethiol (HS(CH2)3–CH3, 98%, Alfa Aesar, Germany) and allowing the SAM to form overnight. 0.1 M HCl (32% w/w, Merck, Germany) electrolyte solutions were prepared and the pH was adjusted to 1 using diluted NaOH or HCl as required. The molar fraction (XSO3H) of HS(CH2)3–SO3H in HS(CH2)3–CH3 was varied between 0 and 1. The total molar concentration of thiols in each thiol–ethanol solution was 1 mM. Different Au-substrates were prepared by immersion into solutions with molar fractions given in Table 1. Additional details for preparing different Au-substrates and the measurements using these Au-substrates are shown in the ESI† (Table S1) in detail.| 1 | 2 | 3 | 4 | 5 | 6 | 7 | |
|---|---|---|---|---|---|---|---|
| X | 0 | 0.2 | 0.4 | 0.5 | 0.6 | 0.8 | 1 |
Atomic force microscopy (AFM)
AFM force curves were recorded on a JPK Nanowizard (JPK Instruments, Germany) at an approach speed of 0.5 μm s−1 in solution. The spring constant of the used cantilevers was determined using the thermal noise method to be between 250 and 500 pN nm−1. Two sets of 100 deflection–displacement curves were recorded at random positions on a given surface and converted into force–distance profiles consisting of one extend and one retract trace. This method was repeated using 3–4 sets of surfaces and tips for each molar fraction. The experimental setup is schematically shown in Fig. 1. Reff is the effective tip radius, TSAM is the thickness of the monolayer, Dr stands for the relative distance between the tip and the surface, and F is the force that is quantified by the AFM. Data fitting to the force–distance curves is explained in detail in the Results section and in the ESI.† | ||
Fig. 1 Symmetric functionalization by self-assembled monolayers on both the Au surface and the AFM tip (right) to mimic Nafion ionic channels (left). The aliphatic chains are attached to the gold via thiol bonds.  –CH3, –CH3,  –SO3H head groups. Reff: effective radius of the tip, F: force measured by the AFM, Dr: relative distance between tip and surface (and Nafion channel size), and TSAM: thickness of the SAM. –SO3H head groups. Reff: effective radius of the tip, F: force measured by the AFM, Dr: relative distance between tip and surface (and Nafion channel size), and TSAM: thickness of the SAM. | ||
Surface-enhanced Raman spectroscopy (SERS)
SERS-active Au-substrates were prepared by electrochemically roughening an Au-coated glass slide (see Experimental details in ESI†). The thickness of the pristine Au layer on the glass slide was 200 nm. Surfaces of varying degree of hydrophilicity were prepared by immersing the roughened Au-substrates in the respective thiol–ethanol solutions (Table 1) overnight. SERS maps were taken on a Bruker Senterra Raman microscope with an excitation wavelength of 785 nm. The laser power used in all experiments was 1 mW. A 50×, NA 0.75 objective (Olympus) was used to focus the laser onto the sample and to collect the SERS signal. The x × y (11 × 11) pixels spatial images were captured from three different spots of three independent samples for each X. The step size between two neighboring pixels was 0.2 μm in both x- and y-axes. All spectra were obtained with 10 s acquisition time. The spectral background was subtracted using an iterative-polynomial algorithm with a polynomial order of 2.15Results
Macro- and microscopic surface chemistry characterization
The variation of the surface density of sulfonic acid groups was macroscopically characterized by static contact angle measurements (Fig. 2a). The contact angle measured on modified Au samples decreases approximately linearly with the increasing XSO3H, indicating an increasing hydrophilicity of the surface. The monotonic trend suggests a strong correlation of solution XSO3H and the corresponding surface concentration. To confirm that our sample preparation protocol results in a homogeneous distribution of sulfonic acid groups (as opposed to micron-scale hydrophilic/hydrophobic phase separation and domain formation), Au-coated surfaces were characterized with SERS. Two example SERS spectra are shown in Fig. 2b for XSO3H = 0 and XSO3H = 1 that highlight spectral differences between the –CH3 and –SO3H terminated thiols. The peak at 1060 cm−1 is assigned to the symmetric stretching vibration of sulfonic acid groups ν(S–O)16 and the peak at 1095 cm−1 to the carbon chain skeletal vibration ν(CCCC).17 Thus, the relative amount of –CH3/–SO3H can be quantified as the band intensity ratio Q = I(CCCC)/I(S–O). The intensities of the two peaks (I(CCCC) and I(S–O)) were obtained by integrating the wavenumber ranges marked by grey shading in Fig. 2b. | ||
| Fig. 2 (a) Contact angle (red) decrease with increasing molar fraction (XSO3H); relative intensity Q (black) = I(CCCC)/I(SO3) as function of XSO3H. Values of Q are normalized to Q(XSO3H = 0). (b) SERS spectra of different surfaces: pure R′-CH3 (dark) and pure R′-SO3H (blue); inset, distribution of Q in pure R′-CH3 (XSO3H = 0), R′-SO3H (XSO3H = 0.5) and pure R′-SO3H (XSO3H = 1). The brighter the color, the higher the relative intensity Q with more contribution of R′-CH3. The three images (denoted as image 1, image 2, and image 3) were taken from three different spots in each sample. Error bars for Q in (a) show the standard deviation from averaging the relative intensities of three different images. Values of Q are normalized to Q(XSO3H = 0). Error bars for contact angles denote the standard deviation from the average of three experiments for each sample. R′ = (Au)–S(CH2)3–. | ||
Images of Q for the surface prepared from the thiol–ethanol solution with XSO3H = 0, 0.5, and 1 are shown in Fig. 2b (inset). Three different locations on these samples show that Q decreases with increasing XSO3H, as expected, and none of the surfaces shows any microscale heterogeneity or phase separation within our optical spatial resolution of ∼400 nm. Fig. 2a (black) shows that the average Q values for each surface coating – computed by averaging Q from all pixels in three images per surface (N = 121 spectra per image) – decreases almost linearly with increasing XSO3H, consistent with the contact angle results. Characterization of the surfaces using SERS quantitatively shows that the surface density of sulfonic acid groups can be controlled by tuning the molar fraction XSO3H in the thiol solutions and that the surface distribution of the hydrophilic groups is homogeneous within our optical resolution.
Nanoscale surface and solvent characteristics
For each XSO3H, we measured force–distance (F–D) characteristics between thiol-functionalized Au-coated AFM tips and Au surfaces with the same XSO3H on both the tip and the surface. As all recorded curves for a given molar fraction gave nearly the same response over the entire surface, we concluded that the prepared surfaces were homogeneously covered with hydrophilic and hydrophobic thiol molecules without nanoscale domain formation above the typical AFM contact area of <5–10 nm2. From each group of 100 measured force curves taken at different locations, 15 approach curves were randomly selected and averaged into a mean curve. Averaging more than 15 curves did not improve the accuracy or information content. 100 curves were usually recorded to ensure that more curves than necessary were available for post-experimental analysis. Fig. 3 shows experimental average F–D characteristics and the fit curves from the extended Derjaguin–Landau–Verwey–Overbeek (DLVO) Hydra model. The experimental fluctuation between the 15 curves, presumably due to thermal noise, is by the grey dots. | ||
| Fig. 3 The experimental average force–distance curve (black) and fitting curve (red) to the extended DLVO Hydra model for (a) XSO3H = 0, (b) XSO3H = 0.4, (c) XSO3H = 0.8, and (d) XSO3H = 1. For (a) XSO3H = 0, the extended DLVO Hydra model only reconstructs the long-range forces (only fitting the relative distance range from infinity to 2 nm). | ||
The curves shown in Fig. 3 indicate a pronounced change of the F–D characteristics from an attractive force profile at XSO3H = 0 (hydrophobic surface) to a fully repulsive profile at XSO3H = 1 (hydrophilic surface), with a transition from attractive to repulsive forces at XSO3H ≈ 0.4. This degree of surface hydrophilicity seems to mark the threshold between the two regions where water is attracted to or depleted from the interface, which is confirmed by deduction of the Hydra parameters from the extended DLVO Hydra model fits as explained below.
The F–D characteristics indicate a strong attractive force at XSO3H = 0 that cannot be explained solely by attractive van der Waals (vdW) forces; an additional well-known “hydrophobic attraction”14 acts due to a purported pronounced depletion of water at the hydrophobic interface.18,19 With increasing surface charge and hydrophilicity, water as well as ions are attracted toward the surface. As a result, the F–D characteristics switch from attractive to repulsive due to steric hydration repulsion originating from strongly surface-bound molecules, which can be described by an extended DLVO Hydra model (eqn (1)).20–23 This approach includes van der Waals (vdW) attraction, electrostatic double layer repulsion, and an additional hydration interaction parameter (Hy):
 | (1) |
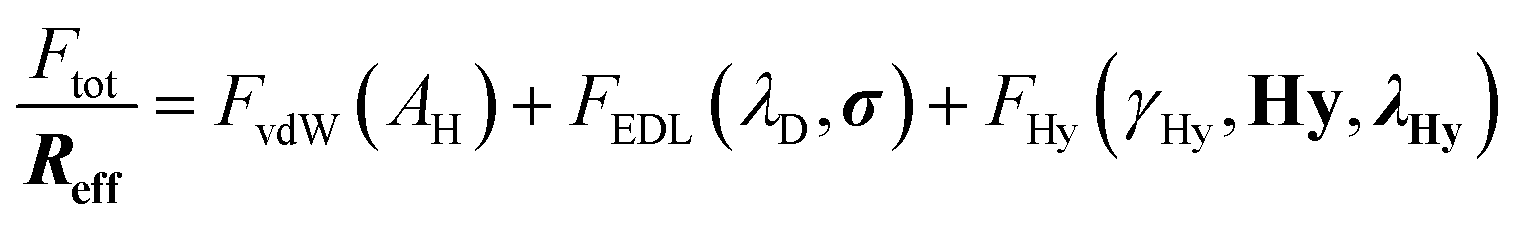
In eqn (1), the total measured force, which is commonly normalized by the effective radius Ftot/Reff,20,22 is the sum of three independent force terms: (1) the attractive vdW force FvdW, characterized by a distance-dependent Hamaker constant AH, (2) the electrostatic double layer repulsion FEDL, of the interacting surfaces with Debye length λD, and charge density σ, and (3) a term describing an additional contribution related to the hydrophobic properties of the surface: the Hydra force, FHy. FHy is described by a recently suggested hydration parameter Hydra, Hy, which corresponds essentially to the fraction of hydrophobic area at an interface and references the magnitude of the hydration interaction to a purely hydrophobic interaction (Hy = 1) with a hydrophobic interface tension γHy = 45 mN m−1.14 It becomes negative for repulsive hydration interactions. The Hydra decay length λHy characterizes the effective range of the hydration interaction and hence the hydration layering at the interacting surfaces. Below roughly D < 2λD (i.e. 2 nm for the used electrolyte concentration), the electrostatic double layer force deviates from the Poisson–Boltzmann equation and the fitted hydration interaction FHy overpowers the electrostatic contribution. Detailed expressions for each force contribution are given in the ESI.†
There are four fitting parameters (bolded in eqn (1)) in this equation: the tip radius Reff, which varies between individual AFM tips typically in the range of 8 to 40 nm, Hydra Hy, the Hydra decay length λHy, and the charge density σ. All other parameters (see ESI†) can be fixed to known or measured values: the layer thickness TSAM (see XPS results in ESI†), Debye length λD, γHy = 45 mJ m−2, and the parameters that define the Hamaker constant for the studied systems. We assume constant charge boundary conditions for the electrostatic double layer force.
Fig. 3 shows the fitting of the data to the Hydra model for selected XSO3H (red curves). All F–D curves can be fitted with the Hydra model except for the purely hydrophobic surface of XSO3H = 0 where the fitting deviates from the measured curves at D ∼ 1–2 nm (marked in Fig. 3a), and the experimental curves show a very short-ranged strong repulsion that overpowers the hydrophobic attractions at D ∼ 5 Å. In our previous work with longer hydrocarbon chains, we recorded weak repulsive contributions within the attractive regime, albeit not as pronounced an effect as reported here.21 Similar short-range hydrophobic repulsion has been recently observed in experiments probing the hydrophobic force of diamond-like carbon.24
Fig. 4 shows the extracted parameters charge density σ, hydration decay length λHy, and the Hydra parameter Hy, obtained from fitting the F–D curves to eqn (1) as a function of increasing hydrophilicity. The charge density magnitude (Fig. 4a) increases linearly with increasing XSO3H to values of about −63 mC m−2 for a fully hydrophilic surface, with an assumed σ = 0 for a completely hydrophobic (uncharged) surface (because –CH3 groups are not charged). It is important to note that this fitted charge density is a measure for the charge at the plane of origin of the diffuse double layer. The plane of origin is typically ∼1 nm from the actual surface plane, and the remaining (non-screened) charge is estimated to be 30% of that on the actual surface.25,26
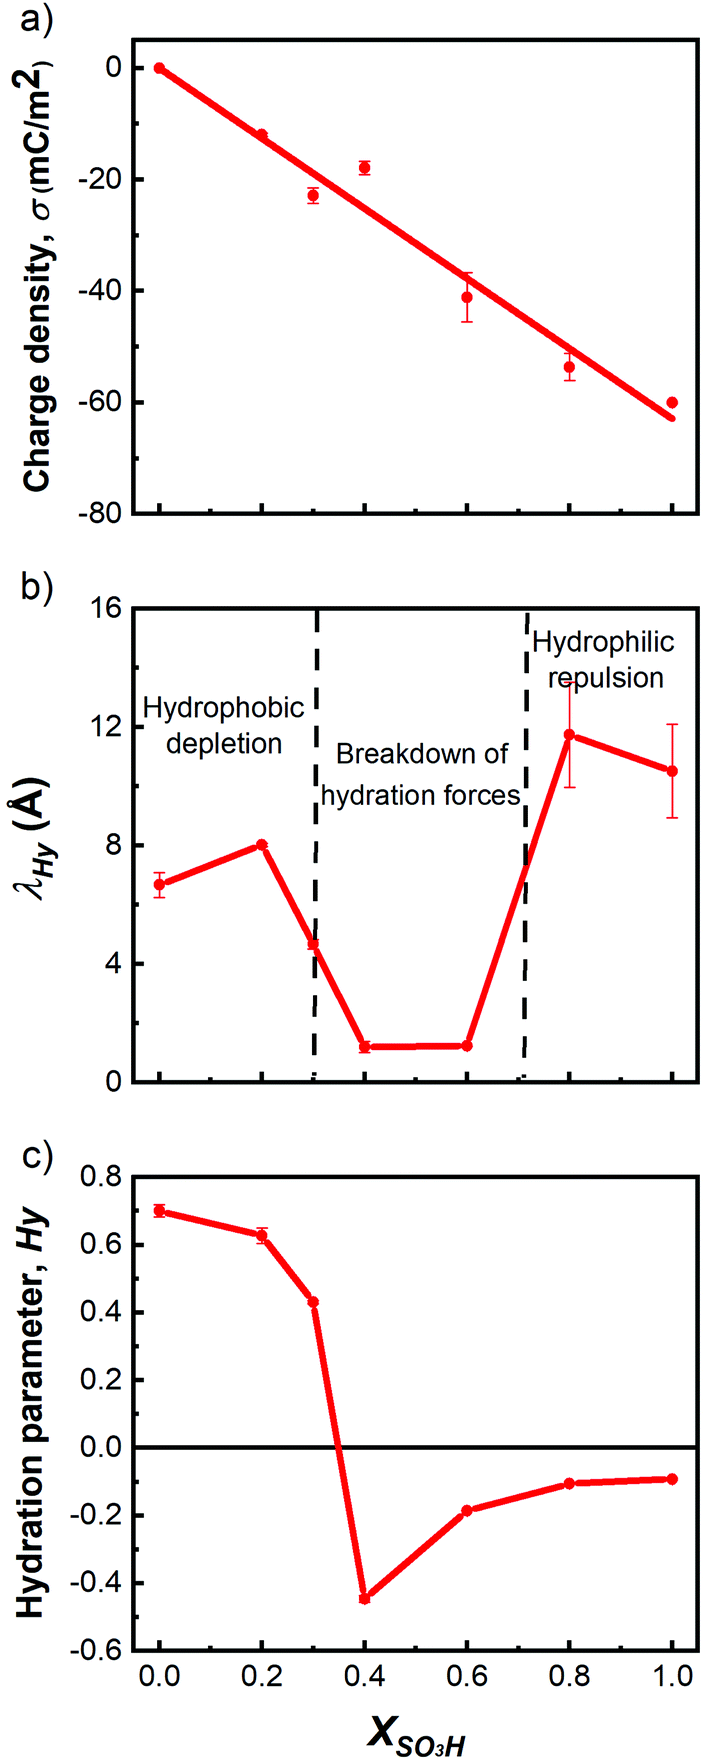 | ||
| Fig. 4 Evolution of fitting parameters for Hydra model as function of XSO3H. (a) Charge density σ, (b) hydration decay length λHy, (c) hydration parameter Hy. | ||
Fig. 4b shows the variation of the hydration decay length λHy as a function of the XSO3H. λHy for hydrophobic surfaces is expected to be between 3 to 10 Å;27 Stock et al. showed that it is close to 7.2 ± 1.2 Å.21 Our findings of λHy = 7 to 8 Å for the hydrophobic region of XSO3H < 0.4 compare well to the literature values. In the intermediate region, i.e. 0.4 < XSO3H < 0.6, the λHy reaches a minimum of <2 Å, indicating considerably fewer strongly-surface-bound electrolyte constituents. At higher hydrophilic coverage, λHy reaches values of about 10 to 12 Å, indicating a surface-bound electrolyte that is interacting over longer distances as compared to hydrophobic surfaces, in good agreement with general observations of repulsive hydration forces.14
The Hydra parameter Hy (Fig. 4c) switches from positive to negative between XSO3H = 0.3 and 0.4, with values of about 0.7 for hydrophobic surfaces of XSO3H ≤ 0.2 to about −0.5 at XSO3H = 0.4. The crossing from positive to negative reveals that the tip–surface forces during approach switch from attraction to repulsion between 0.3 < XSO3H < 0.4. This Hy minimum is unexpected based on the gradual transition of macroscopic parameters such as the contact angle (Fig. 1) and may be a result of the breakdown of the continuum theory at D < 1 nm.28
Discussion
From the experimental results and those of the Hydra model fitting, we find clear trends in both the force profiles and model parameters as the functionalization of the surface progresses toward more hydrophilic coverage. The R-SO3H molar fraction of XSO3H = 0.4 seems to be the critical value where the hydration properties change significantly as indicated by the Hy parameter. For very hydrophobic surfaces (XSO3H < 0.4), significant attraction forces in the F–D curves manifest themselves as vdW forces and hydrophobic forces,29 indicating a likely depletion of the solution (water) layer18 between the two functionalized Au surfaces. The water depletion is believed to occur because of the inability of the few hydrophilic R-SO3H head groups to promote complete solvation of the surface, thereby creating only isolated hydrated regions surrounded by regions with depleted water. For XSO3H > 0.4, the F–D profile was reversed showing purely repulsive forces upon tip approach, indicating that repulsive hydration forces and EDL contributions become dominant and overpower attractive vdW forces. The molar fraction of XSO3H = 0.4 marks the threshold between the two surface compositions where water is attracted to or depleted from the interface as shown by the sign change in the Hy parameter and the related switch from attractive to repulsive interactions.Our observation of a λHy of less than 2 Å for XSO3H = 0.4 to 0.6 indicates a complete breakdown of any long-range hydration forces at distances larger than 3–5 Å from the surface into the solution. We speculate that the extended long-range structure of the solution between the surface and the cantilever is limited. Instead, a compact short-ranged structural order on the surface may occur by effective lateral bridging of water molecules across neighboring sulfonic acid head groups. As a result, only very short-ranged hydration forces are measured. This picture is comparable to the one for solvation of small hydrophobes (such as e.g. methane) in bulk water by caging of water around them.29Fig. 5 summarizes the interpretation from our measurements in the different regimes of electrolyte structuring.
 | ||
| Fig. 5 Surface hydrophilicity influences solution structuring at sulfonic acid/methyl terminated SAMs. Bottom: Purely methyl terminated hydrophobic surfaces exhibit no solution structuring near the surface and thus show solution depletion over 7–8 Å. Middle: Medium levels of hydrophilicity show very short scale solution structuring of less than 2 Å. Top: Pure sulfonic acid surfaces show longer range solution structuring beyond 10 Å. The black dotted lines schematically show the positions of λHy for the different surfaces. In all cases, the solution is essentially unstructured, or bulk-like, beyond their hydration length. The hydration forces, and, more generally, the surface forces decay to zero beyond 1–2 nm, which is much shorter than the diameter of a Nafion channel (radius marked by the purple dotted line). | ||
Looking at the charge densities derived from the F–D fits, it is interesting to compare these values with values expected for a fully saturated –SO3H surface. A fully covered SO3H surface is expected to have a charge of ∼−740 mC m−2 on the surface under fully deprotonated conditions (see ESI† for calculation of charge densities of fully covered and deprotonated SO3H surfaces). This estimate is ∼10-fold larger than the maximal charge density of −63 mC m−2 obtained for the pure SO3H-terminated surface at the plane of origin of the diffuse double layer (not the surface) in the work at hand. This discrepancy brings up two plausible scenarios: either (i) most of the charge on the model surface decays within the compact inner layer or (ii) the sulfonic acid groups do not fully deprotonate in pH 1 solution in our experiments. While it is not possible to precisely pinpoint the magnitude of either effect, we can provide a reasonable estimate for the screening effect. Force spectroscopy results suggest that typically ∼80 ± 10% of a surface charge is screened within the compact inner layer.25 Assuming an extreme 90% charge screening between the surface and the inner diffuse layer, the fitted diffuse layer charge density at XSO3H = 1 would suggest surface charge densities (−63 mC m−2 × (1/0.1) = −630 mC m−2), which are close to the expected charge density value of a fully covered SO3− surface (∼740 mC m−2). This numerical agreement demonstrates that charge screening between the surface and inner diffuse layer alone can potentially explain the lower charge densities extracted from fitting to our measurements. Moreover, with the SO3H groups having a pKa ∼ −2 and our electrolyte solution having a pH = 1, it is reasonable to assume that most SO3H groups are deprotonated, even considering electrostatic repulsion effects (which have been shown to increase the pKa by 1–2 units30 – still below the pH in our experiments). Therefore, we surmise that reduced deprotonation likely plays a secondary effect.
For comparison of our model surfaces to Nafion, it is instructive to estimate the surface charge in prototypical Nafion ionic channels with an equivalent weight of 1100 g mol−1 SO3H, and an ionic channel diameter of ∼5 nm.31,32 Allowing for complete SO3H deprotonation in a fully hydrated Nafion membrane at pH 7 water (more than 9 pH units above the solution pKa of SO3H acid) and one charge for each SO3− group, we calculate an approximate surface charge density of ∼−370 mC m−2 in Nafion (see ESI† for Calculation). Again assuming a 90% charge screening between the surface and the inner diffuse layer (where we actually probe), we find that XSO3H ∼ 0.5 provides a charge density comparable to Nafion ionic channels. In the context of our results, it would thus appear that Nafion membranes should exhibit similar values for Hy of −0.45 and for λHy of less than 2 Å as those found at XSO3H ∼ 0.5 in our model system. Such a short hydration length implies local water structuring close to the channel surface, while the remaining solution toward the center of the ionic channel is essentially bulk-like and unstructured. Interestingly, we and others have proposed that two types of water exist in Nafion membranes in a core–shell structure9,33 and that the shell water thickness near the sulfonic acid/Teflon backbone is estimated to be ∼2 Å, which is quantitatively consistent with λHy at XSO3H ∼ 0.5. Thus, we surmise that the moderately charged SAM surface of XSO3H ∼ 0.5 appears to induce solution structuring very locally at the surface, comparable to the shell water in Nafion, that becomes bulk-like beyond this distance (i.e. core water in Nafion).
Conclusions
We have established a model system for PFSA membrane ionic channels using self-assembled monolayers with a tunable surface density of sulfonic acid and methyl groups to tune surface hydrophilicity. We quantified the hydration forces and deduced the interfacial electrolyte structure from AFM force–distance measurements. The measured force profiles indicate a pronounced change of the electrolyte layering density at the surface with an unexpectedly sharp hydrophobic-to-hydrophilic transition for XSO3H ∼ 0.4. This inflection point can be attributed to a change from hydrophobic water depletion to strong water and ion adsorption at the surface for hydrophobic and hydrophilic surfaces, respectively, due to buildup of sufficient surface charge. Using an extended Derjaguin–Landau–Verwey–Overbeek model including the Hydra force, we quantify diffuse double layer charges and characteristic hydration lengths as a function of sulfonic acid group density on the surface. Interestingly, from XSO3H ∼ 0.4–0.6 we find a significant breakdown of the long-ranged hydration effects beyond a few Å in force-versus-distance characteristics. The extracted surface charge density for surfaces with these molar fractions similar to charge densities estimated for fully hydrated Nafion, assuming a large decay of surface charge due to screening between the surface and inner diffuse layer. This suggests that the observed very short hydration layering and strong long-ranged repulsive hydration forces may also occur within Nafion ionic channels – in support of the core–shell hypothesis of water in Nafion. The effect of electrolyte structuring on transport is yet unknown and will be the subject of follow-up studies.Conflicts of interest
There are no conflicts to declare.Acknowledgements
L. M. O. acknowledges the International Max Planck Research School SURMAT for funding. X. L., K. F. D. and S. H. P. gracefully acknowledge Gabriele Herrmann for general technical and Ulmas Zhumaev for scientific support. K. F. D. acknowledges generous support through the Emmy Noether program of the German Research Foundation (DFG) #DO 1691/1-1. X. L. and K. F. D. acknowledge funding through EU FP7 (ITN-FINON #607842). S. H. P. acknowledges funding from the DFG #PA252611-1 and the Marie Curie Foundation #CIG322284. Open Access funding provided by the Max Planck Society.References
- K. A. Mauritz and R. B. Moore, State of understanding of Nafion, Chem. Rev., 2004, 104, 4535–4585 CrossRef CAS PubMed.
- Y.-H. Liu, B. Yi, Z.-G. Shao, L. Wang, D. Xing and H. Zhang, Pt/CNTs-Nafion reinforced and self-humidifying composite membrane for PEMFC applications, J. Power Sources, 2007, 163, 807–813 CrossRef CAS.
- A. Farrukh, F. Ashraf, A. Kaltbeitzel, X. Ling, M. Wagner, H. Duran, A. Ghaffar, H. ur Rehman, S. H. Parekh, K. F. Domke and B. Yameen, Polymer brush functionalized SiO2 nanoparticle based Nafion nanocomposites: a novel avenue to low-humidity proton conducting membranes, Polym. Chem., 2015, 6(31), 5782–5789 RSC.
- K. Schmidt-Rohr and Q. Chen, Parallel cylindrical water nanochannels in Nafion fuel-cell membranes, Nat. Mater., 2008, 7, 75–83 CrossRef CAS PubMed.
- K.-D. Kreuer and G. Portale, A Critical Revision of the Nano-Morphology of Proton Conducting Ionomers and Polyelectrolytes for Fuel Cell Applications, Adv. Funct. Mater., 2013, 23, 5390–5397 CrossRef CAS.
- J. Halim, F. N. Buchi, O. Haas, M. Stamm and G. G. Scherer, Characterization of Perfluorosulfonic Acid Membranes by Conductivity Measurements and Small-Angle X-Ray-Scattering, Electrochim. Acta, 1994, 39(8–9), 1303–1307 CrossRef CAS.
- H. G. Haubold, T. Vad, H. Jungbluth and P. Hiller, Nano structure of NAFION: a SAXS study, Electrochim. Acta, 2001, 46(10–11), 1559–1563 CrossRef CAS.
- K. A. Page, F. A. Landis, A. K. Phillips and R. B. Moore, SAXS analysis of the thermal relaxation of anisotropic morphologies in oriented Nafion membranes, Macromolecules, 2006, 39(11), 3939–3946 CrossRef CAS.
- X. Ling, M. Bonn, S. H. Parekh and K. F. Domke, Nanoscale Distribution of Sulfonic Acid Groups Determines Structure and Binding of Water in Nafion Membranes, Angew. Chem., Int. Ed., 2016, 55(12), 4011–4015 CrossRef CAS PubMed.
- N. H. Jalani and R. Datta, The effect of equivalent weight, temperature, cationic forms, sorbates, and nanoinorganic additives on the sorption behavior of Nafion®, J. Membr. Sci., 2005, 264(1–2), 167–175 CrossRef CAS.
- S. S. Jang, V. Molinero, C. Tahir and W. A. Goddard, Nanophase-segregation and transport in Nafion 117 from molecular dynamics simulations: Effect of monomeric sequence, J. Phys. Chem. B, 2004, 108(10), 3149–3157 CrossRef CAS.
- K. D. Kreuer, On the development of proton conducting polymer membranes for hydrogen and methanol fuel cells, J. Membr. Sci., 2001, 185(1), 29–39 CrossRef CAS.
- J. Israelachvili and H. Wennerstrom, Role of hydration and water structure in biological and colloidal interactions, Nature, 1996, 379(6562), 219 CrossRef CAS PubMed.
- S. H. Donaldson, A. Røyne, K. Kristiansen, M. V. Rapp, S. Das, M. A. Gebbie, D. W. Lee, P. Stock, M. Valtiner and J. Israelachvili, Developing a General Interaction Potential for Hydrophobic and Hydrophilic Interactions, Langmuir, 2015, 31(7), 2051–2064 CrossRef CAS PubMed.
- J. Zhao, H. Lui, D. I. McLean and H. Zeng, Automated Autofluorescence Background Subtraction Algorithm for Biomedical Raman Spectroscopy, Appl. Spectrosc., 2007, 61(11), 1225–1232 CrossRef CAS PubMed.
- A. Gruger, R. André, T. Schmatko and P. Colomban, Nanostructure of Nafion® membranes at different states of hydration An IR and Raman study, Vib. Spectrosc., 2001, 26, 215–225 CrossRef CAS.
- G. Socrates, Infrared and Raman Characteristic Group Frequencies: Tables and Charts, Wiley, 3rd edn, 2004, p. 366 Search PubMed.
- M. Mezger, F. Sedlmeier, D. Horinek, H. Reichert, D. Pontoni and H. Dosch, On the Origin of the Hydrophobic Water Gap: An X-ray Reflectivity and MD Simulation Study, J. Am. Chem. Soc., 2010, 132(19), 6735–6741 CrossRef CAS PubMed.
- A. G. De Beer and S. Roke, What interactions can distort the orientational distribution of interfacial water molecules as probed by second harmonic and sum frequency generation?, J. Chem. Phys., 2016, 145(4), 044705 CrossRef PubMed.
- T. Utzig, S. Raman and M. Valtiner, Scaling from Single Molecule to Macroscopic Adhesion at Polymer/Metal Interfaces, Langmuir, 2015, 31(9), 2722–2729 CrossRef CAS PubMed.
- P. Stock, T. Utzig and M. Valtiner, Direct and quantitative AFM measurements of the concentration and temperature dependence of the hydrophobic force law at nanoscopic contacts, J. Colloid Interface Sci., 2015, 446, 244–251 CrossRef CAS PubMed.
- J. N. Israelachvili, Intermolecular and surface forces, Academic Press, Burlington, MA, 2011 Search PubMed.
- M. Hermansson, The DLVO theory in microbial adhesion, Colloids Surf., B, 1999, 14(1–4), 105–119 CrossRef CAS.
- I. Schlesinger and U. Sivan, Hydrophobic repulsion and its origin, 2016, arXiv preprint, arXiv:1603.08215.
- J. Wang and A. J. Bard, Direct atomic force microscopic determination of surface charge at the gold/electrolyte interface – The inadequacy of classical GCS theory in describing the double-layer charge distribution, J. Phys. Chem. B, 2001, 105(22), 5217–5222 CrossRef CAS.
- Q. Hu, H.-W. Cheng, P. Stock, T. Utzig, B. R. Shrestha, T. Baimpos and M. Valtiner, Elucidating the structure of solid/electrolyte interfaces - Force probe experiments at hydrophilic, hydrophobic and electrified aqueous as well as ionic liquid|electrode interfaces, Bunsen-Magazin, 2015, 2, 49–55 Search PubMed.
- W. A. Ducker and D. Mastropietro, Forces between extended hydrophobic solids: Is there a long-range hydrophobic force?, Curr. Opin. Colloid Interface Sci., 2016, 22, 51–58 CrossRef CAS.
- H.-J. Butt, B. Cappella and M. Kappl, Force measurements with the atomic force microscope: Technique, interpretation and applications, Surf. Sci. Rep., 2005, 59(1–6), 1–152 CrossRef CAS.
- M. U. Hammer, T. H. Anderson, A. Chaimovich, M. S. Shell and J. Israelachvili, The search for the hydrophobic force law, Faraday Discuss., 2010, 146(0), 299–308 RSC.
- J. F. Smalley, K. Chalfant, S. W. Feldberg, T. M. Nahir and E. F. Bowden, An indirect laser-induced temperature jump determination of the surface pKa of 11-mercaptoundecanoic acid monolayers self-assembled on gold, J. Phys. Chem. B, 1999, 103(10), 1676–1685 CrossRef CAS.
- Dupont, Nafion®Membranes N115, N117, N1110 Datasheet. Nafion® Membranes N115, N117, N1110 Datasheet.
- Dupont, Nafion® Membranes NR211 and NR212 Datasheet. Nafion® Membranes NR211 and NR212 Datasheet.
- Q. Zhao, P. Majsztrik and J. Benziger, Diffusion and interfacial transport of water in Nafion, J. Phys. Chem. B, 2011, 115(12), 2717–2727 CrossRef CAS PubMed.
Footnotes |
| † Electronic supplementary information (ESI) available. See DOI: 10.1039/c8cp01625a |
| ‡ Denotes equal contribution. |
| This journal is © the Owner Societies 2018 |