
 Open Access Article
 This Open Access Article is licensed under a
 Creative Commons Attribution 3.0 Unported Licence
Structure and dynamics of water at water–graphene and water–hexagonal boron-nitride sheet interfaces revealed by ab initio sum-frequency generation spectroscopy†
Tatsuhiko
Ohto
*a,
Hirokazu
Tada
a and
Yuki
Nagata
 *b
*b
aGraduate School of Engineering Science, Osaka University, 1-3 Machikaneyama, Toyonaka, Osaka, 560-8531, Japan. E-mail: ohto@molectronics.jp
bMax-Planck Institute for Polymer Research, Ackermannweg 10, 55128, Mainz, Germany. E-mail: nagata@mpip-mainz.mpg.de
First published on 20th April 2018
Abstract
We simulate sum-frequency generation (SFG) spectra of isotopically diluted water at the water–graphene and water–hexagonal boron-nitride (hBN) sheet interfaces, using ab initio molecular dynamics simulations. A sharp ‘dangling’ O–D peak around ∼2640 cm−1 appearing in both simulated SFG spectra evidences that both graphene and hBN are hydrophobic. The dangling O–D peak is 10 cm−1 red-shifted at the water–hBN interface relative to the peak at the water–graphene interface. This frequency difference gives a stronger O–D⋯N intermolecular interaction between water and hBN than the O–D⋯C interaction between water and graphene. Accordingly, the anisotropy decay of such a dangling O–D group slows down near hBN compared with near graphene, illustrating that the dynamics of the dangling O–D group are also affected by the stronger O–D⋯N interaction than the O–D⋯C interaction. We discuss molecular-level insights into the structure and dynamics of interfacial water in the context of the friction of hBN and graphene.
I. Introduction
Graphene is a two-dimensional (2D) material with a single-atom thickness. Since graphene is chemically stable, highly conductive, and optically transparent, it has been used as a coating material to endow the coated surfaces with hydrophobic and conductive properties.1–3 The wetting properties of graphene are typically characterized by contact angle measurements. However, reported values for the contact angle of a water droplet on graphene vary dramatically from 20° to 127°,4,5 and have not been uniquely determined.6 The large range of reported contact angles has been attributed to chemical doping7,8 of the graphene and the effects of the substrate4 supporting the graphene samples.Effects due to such chemical doping and the substrate supporting graphene are expected to affect not only the macroscopic wetting properties but also the microscopic interaction between the water molecules and graphene. Interfacial water molecules neighboring the graphene interface have been probed by sum-frequency generation (SFG) spectroscopy.9 An SFG signal is generated from the interaction of infrared and visible pulses with the interface, providing a second-order nonlinear optical response. Since the second-order nonlinear susceptibility is zero for centrosymmetric media owing to the selection rule of the even-order response, SFG can selectively probe the molecular response of the interfacial molecules.10,11 The SFG response of the water molecules’ O–H (O–D) stretch mode at the water–air10,12 and water–oil13 interfaces commonly shows a sharp ∼3700 (2750) cm−1 peak. Since this peak arises from the dangling, non-hydrogen-bonded, O–H group sticking out of the water–air interface, it constitutes a microscopic measure for the hydrophobicity of the materials.14 In fact, a recent SFG study at the water–graphene interface9 reported the absence of dangling O–H groups, suggesting that the graphene surface is not so hydrophobic.
Interpreting SFG spectra of water near 2D materials is however very challenging, as water can exist both above and below the surface of 2D materials and SFG cannot distinguish between the responses of such different water molecules, which, in addition, may partially cancel out. Furthermore, the effects of the substrate supporting graphene and the response from the water interacting with the substrate may both substantially affect the SFG signal. Therefore, simulating the SFG spectra at 2D material/water interfaces and comparing the simulated SFG data with experimental data would provide a good starting point to examine the net contribution of 2D materials to the conformation of the interfacial water neighboring 2D materials.
In this study, we simulate the SFG spectra of water at the water–graphene and water–hexagonal boron-nitride (hBN) interfaces, with free-standing graphene and hBN films. We find that the SFG spectra at the water–graphene and water–hBN interfaces closely resemble SFG spectrum at the water–air interface, indicating that the graphene interface is hydrophobic. We attribute the different conclusions of our simulation and experimental SFG study9 to the presence of water in-between the graphene and the substrate supporting graphene in the experiments. Furthermore, we discuss the different peak position and anisotropy decay of the dangling O–H stretch mode at the water–graphene and water–hBN interfaces.
The organization of this paper is as follows. Section II describes the simulation protocols. In Section III, we describe the SFG spectra of the O–D stretch modes of water at the water–graphene and water–hBN sheet interfaces, and discuss the structure and dynamics of water near the graphene and the hBN. The conclusion is given in Section IV.
II. Simulation protocols
II.A. AIMD simulation
For AIMD simulations, we employed the QUICKSTEP method15 implemented in the CP2K program.16 The Becke–Lee–Yang–Parr (BLYP)17,18 exchange–correlation functional was used. We employed triple-zeta valence plus two polarization (TZV2P) basis sets for water and double-zeta valence plus polarization (DZVP) basis sets for graphene and hBN, respectively. The core electrons were described by the Goedecker–Teter–Hutter pseudopotential.19 The real-space density cutoff was set to 320 Ry. The van der Waals correction was included via Grimme's D3 method.20 The simulation cell lengths in the x-, y-, and z-directions were 25.56 Å, 24.595 Å, and 70 Å for the graphene–D2O interface and 26.082 Å, 25.097 Å, and 70 Å for the hBN–D2O interfaces, respectively, where the z-direction was perpendicular to the interface and the xy-plane was parallel to the interface. The origin of the z-axis was set to the averaged position of graphene or hBN. Both cells contain 400 D2O molecules below graphene (in the negative z-direction). To study the effect of a small number of water molecules above graphene (in the positive z-direction), we added 27 D2O molecules on the other side of the graphene–bulk water interface, while using the same cell size. Periodic boundary conditions were used.We carried out MD simulations in the NVT ensemble. We set a target temperature of 320 K using the technique of canonical sampling through velocity rescaling.49 The time step for integrating the equation of motion was set to 0.5 fs. We performed 40 ps AIMD runs to sample the AIMD trajectories after the 5 ps equilibration runs, and a total of 40 ps × 2 = 80 ps AIMD trajectories were used for analyzing the data and computing the SFG spectra. 80 ps is a sufficient length of trajectory to obtain the converged SFG spectra.21
II.B. Simulation protocols for SFG spectra
The SFG spectra of the O–D stretch mode for HOD in H2O were calculated via the surface-specific velocity–velocity autocorrelation function (ssVVAF) formalism.21 The autocorrelation function of the dipole moment and the polarizability of the O–H stretch chromophores in the ssVVAF approach neglect all the intra-/intermolecular couplings, enabling us to access the spectra of the isolated O–D stretch mode. Since this ssVVAF technique can suppress the fluctuations due to the variation of the local environment through the induced dipole moment and the polarizability, the time correlation function converges even with a limited length of trajectory.21–23In the ssVVAF algorithm, the resonant part of the SFG response function, χ(2),Rxxz(ω), can be written as:
 | (1) |
 | (2) |
| Q(ω) = βℏω/(1−exp(−βℏω)) | (3) |
III. Results
III.A. SFG response of water at the water–graphene interface is similar to that at the water–air interface
Fig. 1 displays the O–D stretch SFG response at the isotopically diluted water (HOD in H2O)–graphene interface together with the spectrum at the isotopically diluted water–air interface. The SFG response at the water–graphene interface is very similar to that at the water–air interface. Although a whole O–H stretch SFG spectrum of isotopically diluted water with non-contaminated reference signal27–29 has not been reported to our best knowledge and thus we cannot compare our simulated spectrum with experimental data, the AIMD simulated SFG spectrum is in good agreement with the accurate force field MD data of isotopically diluted water,50 and captures the most of the important signature of experimental SFG data of neat H2O.27–29,51 The dangling O–D stretch peak of the water–air SFG spectrum is red-shifted by 38 cm−1 for the water–graphene system. This 38 cm−1 red-shift of the dangling O–D stretch frequency (corresponding to a ∼50 cm−1 shift of the dangling O–H stretch frequency) at the water–graphene interface is larger than the shift of 7–22 cm−1 of the O–D stretch frequency (a 10–30 cm−1 shift of the O–H stretch frequency30,31) typically observed at water–alkane interfaces. Since this 7–22 cm−1 shift stems from van der Waals interactions at the water and hydrophobic medium interface, the red-shift of 38 cm−1 at the water–graphene interface indicates that the water–graphene interface is governed not only by van der Waals interactions but also by the interaction of the deuterium atom of water with the π-electrons of graphene.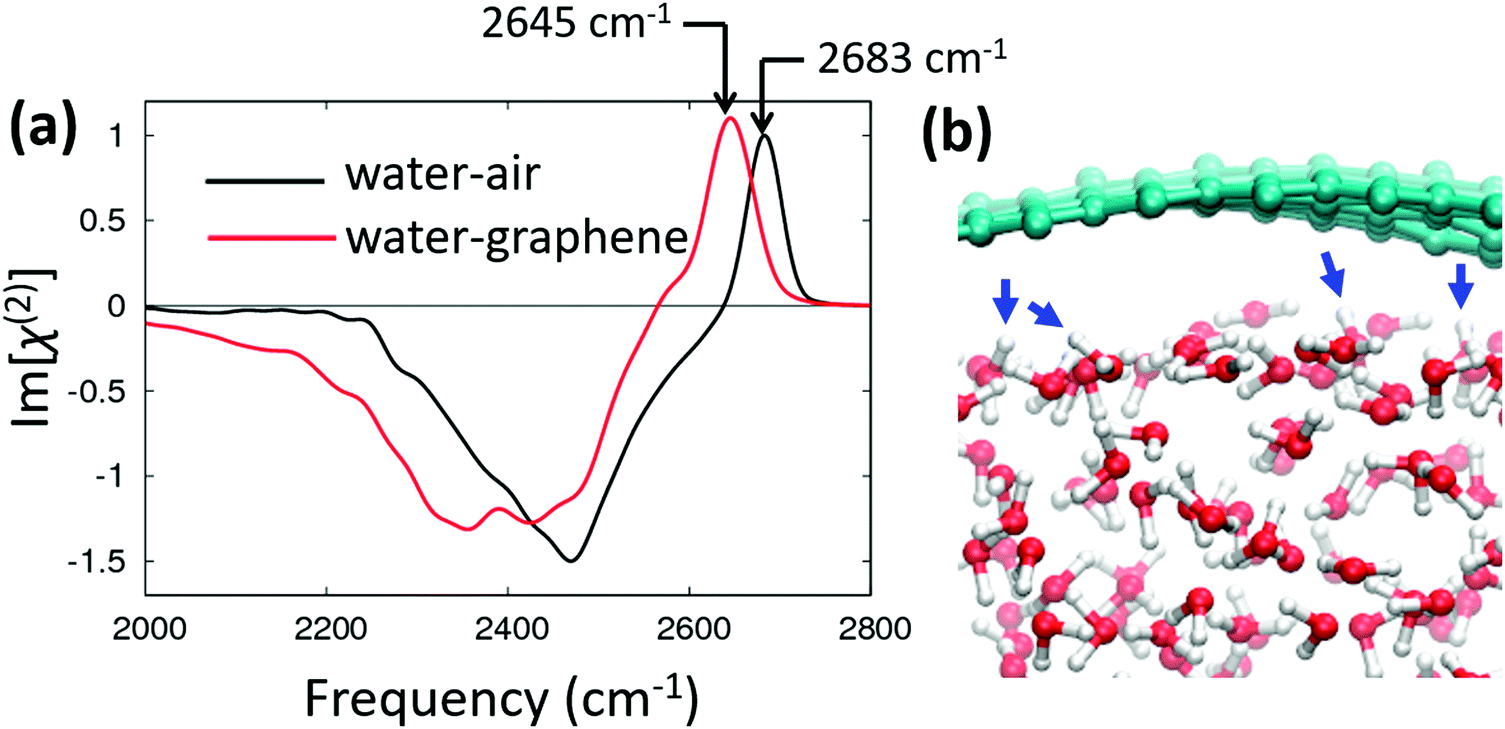 | ||
| Fig. 1 (a) SFG response at the isotopically diluted water–graphene and water–air interfaces. (b) Snapshot of the water–graphene interface. Blue arrows highlight dangling O–D groups. | ||
The presence of the dangling O–D peak in the simulated spectrum of the water–graphene interface is consistent with the hydrophobic graphene interfaces concluded by previous force field and AIMD simulations,32–36 whereas it differs significantly from the reported experimental data. Singla et al. have reported the absence of the dangling O–D stretch SFG feature, based on which they concluded that the orientation of water next to the graphene is parallel to the graphene surface.9 In contrast to this picture, the MD snapshot of the water next to the graphene (Fig. 1b) shows a non-planar orientation of the dangling O–D groups. The possible reason for the absence of the dangling O–D peak in the experimental spectrum is discussed in the next section.
We then turn our focus to the negative SFG feature in the 2100–2550 cm−1 region. This response corresponds to the hydrogen-bonded O–D stretch. The data show that the O–D stretch frequency at the D2O–graphene interface is red-shifted by ∼70 cm−1 compared with the data at the D2O–air interface. This red-shift indicates that the hydrogen-bond of the interfacial water is stronger at the water–graphene interface than at the water–air interface. This is consistent with the experimental results reported in ref. 9.
III.B. Presence of water on two sides of graphene reduces the dangling O–D feature
As mentioned in the Introduction, water can penetrate into the free space between the graphene and the substrate material supporting the graphene. This free space could be generated by the mismatch of the lattice constants of the substrate and the graphene sheet, making the graphene structure corrugated.37–41 Experimentally, it is highly challenging to avoid or remove such penetrated water molecules and thus obtain the net contribution of the bulk water interacting with one side of the graphene.42,43 Furthermore, such defects have been known to be mobile,44 helping water to make a thin layer over the space between the graphene and the substrate. Thus, it would be useful to explore the effects of penetrated water attached on the other side of the graphene on the SFG spectra of water theoretically.The blue and orange lines in Fig. 2(a) show the simulated contributions of the water molecules below and above the graphene to the SFG spectra, respectively. The contribution of water below the graphene (bulk water) perfectly reproduces the SFG spectrum of the water–graphene interface. Similarly, the water molecules above the graphene (penetrated water) contribute to the SFG spectra, but with opposite signs. One can see that this penetrated water provides a relatively large SFG amplitude in the dangling O–D stretch (2550–2700 cm−1) frequency region compared to the hydrogen bonded O–D stretch frequency (2100–2550 cm−1) region. As such, the overall SFG response originating from both the bulk and penetrated water shows a substantial reduction of the dangling O–D peak. Fig. 2(b) shows that the spectral area of the positive peak for the dangling O–D stretch reduces by 31%, while that for the negative peak for the hydrogen bonded O–D stretch reduces by 15%.
 | ||
| Fig. 2 (a) SFG spectra of the isotopically diluted water molecules below (blue) and above (yellow) the graphene, representing the bulk water and penetrated water, respectively. (b) SFG spectra of the isotopically diluted water–graphene interface with water penetrated between the graphene and the substrate as well as without penetrated water. | ||
From this observation, we can learn two lessons. Firstly, the SFG response contributed by the bulk water below graphene is insensitive to the presence – or absence – of water above the graphene; this implies that the presence of the penetrated water may not affect the microscopic structure of the interfacial water molecules. In other words, the structure of interfacial water near graphene is governed solely by the water–graphene interactions. The substrate supporting the graphene sheet would have a very limited effect on the SFG response of the O–D (O–H) stretch mode. Secondly, the presence of the water between the graphene and the substrate could be a major reason for the dangling O–H (O–D) SFG feature not appearing in the experimental spectra.9 Our simulation results indicate that special attention has to be paid to the penetration of water through 2D materials such as graphene, before attributing the presence or absence of dangling O–H (O–D) groups to the hydrophobicity/hydrophilicity of the materials.
III.C. hBN shifts and suppresses the dangling O–D SFG feature
We now consider the O–D stretch SFG response at the isotopically diluted water–hBN interface. Fig. 3 shows this response, together with that of the water–graphene interface. The hydrogen-bonded O–D stretch mode features (2100–2550 cm−1) are almost identical for the hBN and graphene interfaces. In contrast, the dangling O–D stretch peak is different between these interfaces; the dangling O–D peak at the hBN interface is broader than that at the graphene interface, and the dangling O–D peak is red-shifted at the hBN interface. Since the dangling O–D peak is governed by the interaction between the graphene/hBN and the deuterium atom of water, the broader O–D peak for the hBN interface indicates that the water–hBN interaction is more heterogeneous than the water–graphene interaction. | ||
| Fig. 3 (a) SFG spectrum at the isotopically diluted water–hBN interface as well as the contributions of the dangling O–D groups near B and N atoms. (b) Schematic of water orientation near the hBN. | ||
To elucidate the origin of the heterogeneity of the water–hBN interactions, we decompose the dangling O–D stretch SFG spectrum into the contributions of the dangling O–D groups near B and N atoms. We used the dangling O–D definition given in ref. 45 (see also ESI†). Surprisingly, the spectral area of the dangling O–D peak near the N atom is ∼3 times larger than that near the B atom. This can be rationalized by the negative partial charge of the N atom, which serves to attract the D atom of D2O, enriching the dangling O–D group density near the N atoms. In contrast, the positive partial charge on the B atom is repulsive towards the D atom of D2O, suppressing the dangling O–D groups near the B atom.
A more favorable O–D⋯N interaction compared to the O–D⋯B interaction is also apparent from the dangling O–D stretch frequency. The O–D stretch mode near a N atom has a peak frequency of 2630 cm−1, while that near a B atom has a peak frequency of 2642 cm−1. The O–D stretch frequency is red-shifted due to the attractive intermolecular interactions. As such, the red-shift of the O–D group near an N atom illustrates that the O–D⋯N interaction is stronger than the O–D⋯B interaction. This O–D⋯N stretch peak is further red-shifted compared with the O–D⋯C stretch peak. This makes the whole dangling O–D peak near the hBN red-shifted from that near the graphene. The typical conformation of water near the hBN is presented in Fig. 3(b).
III.D. Water orientation dynamics are slower near the hBN than near the graphene
Above, the static SFG spectra show that the dangling O–D stretch peak at the water–graphene interface is red-shifted at the water–hBN interface, because of the stronger O–D⋯N interactions compared to the O–D⋯C interactions. Here, we examine how the variation in interaction strength of the dangling O–D groups with graphene or hBN affects the dynamics of the interfacial water, by calculating the anisotropy decay of the O–D groups. The anisotropy decay due to the rotational motion is typically represented by the function: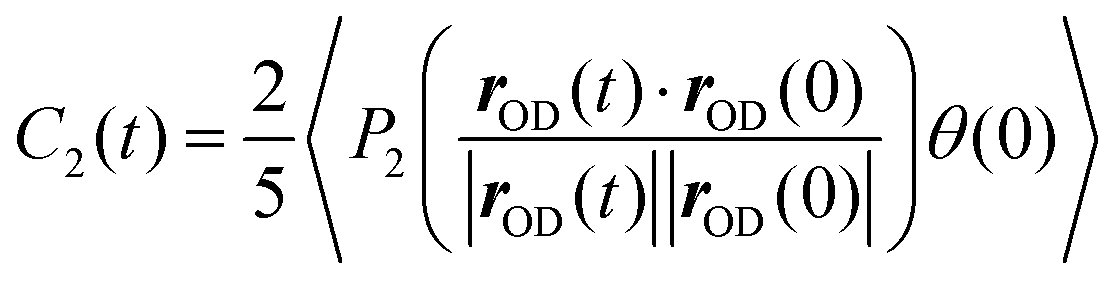 | (4) |
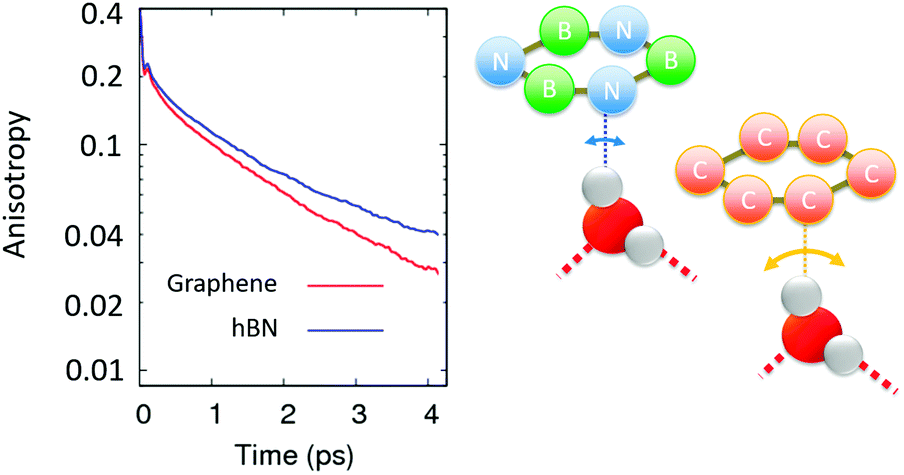
The resulting anisotropy decays of the dangling O–D group near the graphene and the hBN are displayed in Fig. 4. These reveal that the orientational motion of the dangling O–D groups at the hBN interface slows down by ∼30% compared with that at the graphene interface. This slowing-down of the anisotropy decay of the dangling O–D groups stems from the stronger O–D⋯N interaction compared to the O–D⋯C interaction, characterized by only an ∼11 cm−1 shift of the dangling O–D peak. This finding indicates the possibility of tuning the mobility of water in contact with the 2D materials by controlling the doping of graphene. Furthermore, such a change in the anisotropy decay of the dangling O–D stretch between graphene and hBN should experimentally be accessible. Such measurement are highly desirable to obtain microscopic insight into interfacial water near 2D materials.
 | ||
| Fig. 4 Simulated anisotropy decays of the dangling O–D bonds near graphene and hBN. Schematics of the water near hBN and graphene are also presented. | ||
This accelerated orientational motion of the dangling O–D groups at the graphene interface can reduce the friction of the water on the graphene. In fact, Michealides and co-workers have previously reported that the microscopic friction of water on graphene is smaller than that on hBN.32 Our observation of the difference between the water dynamics at the two different interfaces is consistent with their conclusion. Such a relation of the dangling O–D groups’ rotation and friction further supports the notion that the reduced friction of graphene compared to hBN can be related to the distinct dynamics of the dangling O–D groups at these interfaces.
IV. Concluding remarks
We have presented the SFG response of isotopically diluted water at the graphene and hBN interfaces with AIMD simulation. The presence of a sharp peak at ∼2640 cm−1 near graphene and hBN indicates that both graphene and hBN are hydrophobic. The ∼2640 cm−1 O–D stretch SFG sharp peak at the graphene and hBN interfaces is red-shifted compared with the dangling O–D peak at 2683 cm−1 at the water–air interface. Our analyses indicate that the frequencies of the dangling O–D stretch peak increase in the order of O–D⋯N, O–D⋯C, O–D⋯B, indicating that the O–D⋯N interaction is stronger than the O–D⋯B interaction. This suggests that the dangling O–D groups appear in a very heterogeneous manner near hBN, whereas they appear homogeneous at the graphene interface.Exploring the dynamics of dangling O–D groups near these interfaces, we find that the reorientational motion of the dangling O–D groups slows down near the hBN compared to graphene. This is consistent with the previous report on the microscopic friction of water on these interfaces. The slowing down of the dangling O–D groups at the hBN interface is attributed to the high activation barrier due to the stronger O–D⋯N interactions compared to the O–D⋯C interactions.
Conflicts of interest
There are no conflicts to declare.Acknowledgements
We are thankful to Mischa Bonn, Lisa Dreiser, and Ellen Backus for fruitful discussion. We also thank MEXT KAKENHI Grant Nos JP16H00835 and JP16K17855 for financial support. The computation in this work was done using the facilities of the Supercomputer Center, the Institute for Solid State Physics, the University of Tokyo, and HYDRA at the Max Planck Computing & Data Facility. Open Access funding provided by the Max Planck Society.References
- A. K. Geim and K. S. Novoselov, The Rise of Graphene, Nat. Mater., 2007, 6, 183–191 CrossRef CAS PubMed.
- C. Lee, X. Wei, J. W. Kysar and J. Hone, Measurement of the Elastic Properties and Intrinsic Strength of Monolayer Graphene, Science, 2008, 321, 385–388 CrossRef CAS PubMed.
- J. T. Han, S. Y. Kim, J. S. Woo and G.-W. Lee, Transparent, Conductive, and Superhydrophobic Films from Stabilized Carbon Nanotube/Silane Sol Mixture Solution, Adv. Mater., 2008, 20, 3724–3727 CrossRef CAS.
- J. Rafiee, X. Mi, H. Gullapalli, A. V. Thomas, F. Yavari, Y. Shi, P. M. Ajayan and N. A. Koratkar, Wetting Transparency of Graphene, Nat. Mater., 2012, 11, 217–222 CrossRef CAS PubMed.
- S. Wang, Y. Zhang, N. Abidi and L. Cabrales, Wettability and Surface Free Energy of Graphene Films, Langmuir, 2009, 25, 11078–11081 CrossRef CAS PubMed.
- F. Taherian, V. Marcon, N. F. van der Vegt and F. Leroy, What Is the Contact Angle of Water on Graphene?, Langmuir, 2013, 29, 1457–1465 CrossRef CAS PubMed.
- A. Ashraf, Y. Wu, M. C. Wang, K. Yong, T. Sun, Y. Jing, R. T. Haasch, N. R. Aluru and S. Nam, Doping-Induced Tunable Wettability and Adhesion of Graphene, Nano Lett., 2016, 16, 4708–4712 CrossRef CAS PubMed.
- G. Hong, Y. Han, T. M. Schutzius, Y. Wang, Y. Pan, M. Hu, J. Jie, C. S. Sharma, U. Muller and D. Poulikakos, On the Mechanism of Hydrophilicity of Graphene, Nano Lett., 2016, 16, 4447–4453 CrossRef CAS PubMed.
- S. Singla, E. Anim-Danso, A. E. Islam, Y. Ngo, S. S. Kim, R. R. Naik and A. Dhinojwala, Insight on Structure of Water and Ice Next to Graphene Using Surface-Sensitive Spectroscopy, ACS Nano, 2017, 11, 4899–4906 CrossRef CAS PubMed.
- Q. Du, R. Superfine, E. Freysz and Y. R. Shen, Vibrational Spectroscopy of Water at the Vapor/Water Interface, Phys. Rev. Lett., 1993, 70, 2313–2316 CrossRef CAS PubMed.
- M. Bonn, Y. Nagata and E. H. Backus, Molecular Structure and Dynamics of Water at the Water–Air Interface Studied with Surface-Specific Vibrational Spectroscopy, Angew. Chem., Int. Ed., 2015, 54, 5560–5576 CrossRef CAS PubMed.
- I. V. Stiopkin, C. Weeraman, P. A. Pieniazek, F. Y. Shalhout, J. L. Skinner and A. V. Benderskii, Hydrogen Bonding at the Water Surface Revealed by Isotopic Dilution Spectroscopy, Nature, 2011, 474, 192–195 CrossRef CAS PubMed.
- L. F. Scatena, M. G. Brown and G. L. Richmond, Water at Hydrophobic Surfaces: Weak Hydrogen Bonding and Strong Orientation Effects, Science, 2001, 292, 908–912 CrossRef CAS PubMed.
- N. Smolentsev, W. J. Smit, H. J. Bakker and S. Roke, The Interfacial Structure of Water Droplets in a Hydrophobic Liquid, Nat. Commun., 2017, 8, 15548 CrossRef CAS PubMed.
- J. VandeVondele, M. Krack, F. Mohamed, M. Parrinello, T. Chassaing and J. Hutter, Quickstep: Fast and Accurate Density Functional Calculations Using a Mixed Gaussian and Plane Waves Approach, Comput. Phys. Commun., 2005, 167, 103–128 CrossRef CAS.
- The CP2K Developers Group. http://www.cp2k.org.
- A. D. Becke, Density-Functional Exchange-Energy Approximation with Correct Asymptotic-Behavior, Phys. Rev. A, 1988, 38, 3098–3100 CrossRef CAS.
- C. T. Lee, W. T. Yang and R. G. Parr, Development of the Colle-Salvetti Correlation-Energy Formula into a Functional of the Electron-Density, Phys. Rev. B, 1988, 37, 785–789 CrossRef CAS.
- S. Goedecker, M. Teter and J. Hutter, Separable Dual-Space Gaussian Pseudopotentials, Phys. Rev. B, 1996, 54, 1703–1710 CrossRef CAS.
- S. Grimme, J. Antony, S. Ehrlich and H. Krieg, A. Consistent and Accurate Ab Initio Parametrization of Density Functional Dispersion Correction (DFT-D) for the 94 Elements H–Pu, J. Chem. Phys., 2010, 132, 154104 CrossRef PubMed.
- T. Ohto, K. Usui, T. Hasegawa, M. Bonn and Y. Nagata, Toward ab initio Molecular Dynamics Modeling for Sum-Frequency Generation Spectra; An Efficient Algorithm Based on Surface-Specific Velocity-Velocity Correlation Function, J. Chem. Phys., 2015, 143, 124702 CrossRef PubMed.
- T. Ohto, E. H. Backus, C. S. Hsieh, M. Sulpizi, M. Bonn and Y. Nagata, Lipid Carbonyl Groups Terminate the Hydrogen Bond Network of Membrane-Bound Water, J. Phys. Chem. Lett., 2015, 6, 4499–4503 CrossRef CAS PubMed.
- S. Hosseinpour, F. Tang, F. Wang, R. A. Livingstone, S. J. Schlegel, T. Ohto, M. Bonn, Y. Nagata and E. H. G. Backus, Chemisorbed and Physisorbed Water at the TiO2/Water Interface, J. Phys. Chem. Lett., 2017, 8, 2195–2199 CrossRef CAS PubMed.
- B. M. Auer and J. L. Skinner, IR and Raman Spectra of Liquid Water: Theory and Interpretation, J. Chem. Phys., 2008, 128, 224511 CrossRef CAS PubMed.
- S. A. Corcelli and J. L. Skinner, Infrared and Raman Line Shapes of Dilute HOD in Liquid H2O and D2O from 10 to 90 °C, J. Phys. Chem. A, 2005, 109, 6154–6165 CrossRef CAS PubMed.
- P. H. Berens, Molecular Dynamics and Spectra. I. Diatomic Rotation and Vibration, J. Chem. Phys., 1981, 74, 4872 CrossRef CAS.
- S. Nihonyanagi, R. Kusaka, K. Inoue, A. Adhikari, S. Yamaguchi and T. Tahara, Accurate Determination of Complex χ(2) Spectrum of the Air/Water Interface, J. Chem. Phys., 2015, 143, 124707 CrossRef PubMed.
- S. Yamaguchi, Development of Single-Channel Heterodyne-Detected Sum Frequency Generation Spectroscopy and Its Application to the Water/Vapor Interface, J. Chem. Phys., 2015, 143, 034202 CrossRef PubMed.
- S. Sun, R. Liang, X. Xu, H. Zhu, Y. R. Shen and C. Tian, Phase Reference in Phase-Sensitive Sum-Frequency Vibrational Spectroscopy, J. Chem. Phys., 2016, 144, 244711 CrossRef PubMed.
- F. G. Moore and G. L. Richmond, Integration or Segregation: How Do Molecules Behave at Oil/Water Interfaces?, Acc. Chem. Res., 2008, 41, 739–748 CrossRef CAS PubMed.
- S. Strazdaite, J. Versluis, E. H. Backus and H. J. Bakker, Enhanced Ordering of Water at Hydrophobic Surfaces, J. Chem. Phys., 2014, 140, 054711 CrossRef PubMed.
- G. Tocci, L. Joly and A. Michaelides, Friction of Water on Graphene and Hexagonal Boron Nitride from Ab Initio Methods: Very Different Slippage Despite Very Similar Interface Structures, Nano Lett., 2014, 14, 6872–6877 CrossRef CAS PubMed.
- G. Cicero, J. C. Grossman, E. Schwegler, F. Gygi and G. Galli, Water Confined in Nanotubes and between Graphene Sheets:
![[thin space (1/6-em)]](https://www.rsc.org/images/entities/char_2009.gif) A First Principle Study, J. Am. Chem. Soc., 2008, 130, 1871–1878 CrossRef CAS PubMed.
A First Principle Study, J. Am. Chem. Soc., 2008, 130, 1871–1878 CrossRef CAS PubMed. - L. D'Urso, C. Satriano, G. Forte, G. Compagnini and O. Puglisi, Water Structure and Charge Transfer Phenomena at the Liquid-Graphene Interface, Phys. Chem. Chem. Phys., 2012, 14, 14605–14610 RSC.
- M. C. Gordillo and J. Martí, Structure of Water Adsorbed on a Single Graphene Sheet, Phys. Rev. B, 2008, 78, 075432 CrossRef.
- M. K. Rana and A. Chandra, Ab Initio and Classical Molecular Dynamics Studies of the Structural and Dynamical Behavior of Water near a Hydrophobic Graphene Sheet, J. Chem. Phys., 2013, 138, 204702 CrossRef PubMed.
- M. Ishigami, J. H. Chen, W. G. Cullen, M. S. Fuhrer and E. D. Williams, Atomic Structure of Graphene on SiO2, Nano Lett., 2007, 7, 1643–1648 CrossRef CAS PubMed.
- E. Voloshina and Y. Dedkov, Atomic Force Spectroscopy and Density-Functional Study of Graphene Corrugation on Ru(0001), Phys. Rev. B, 2016, 93, 235418 CrossRef.
- E. Stolyarova, K. T. Rim, S. Ryu, J. Maultzsch, P. Kim, L. E. Brus, T. F. Heinz, M. S. Hybertsen and G. W. Flynn, High-Resolution Scanning Tunneling Microscopy Imaging of Mesoscopic Graphene Sheets on an Insulating Surface, Proc. Natl. Acad. Sci. U. S. A., 2007, 104, 9209–9212 CrossRef CAS PubMed.
- A. Fasolino, J. H. Los and M. I. Katsnelson, Intrinsic Ripples in Graphene, Nat. Mater., 2007, 6, 858–861 CrossRef CAS PubMed.
- V. Geringer, M. Liebmann, T. Echtermeyer, S. Runte, M. Schmidt, R. Ruckamp, M. C. Lemme and M. Morgenstern, Intrinsic and Extrinsic Corrugation of Monolayer Graphene Deposited on SiO2, Phys. Rev. Lett., 2009, 102, 076102 CrossRef CAS PubMed.
- N. Severin, P. Lange, I. M. Sokolov and J. P. Rabe, Reversible Dewetting of a Molecularly Thin Fluid Water Film in a Soft Graphene-Mica Slit Pore, Nano Lett., 2012, 12, 774–779 CrossRef CAS PubMed.
- S. P. Surwade, S. N. Smirnov, I. V. Vlassiouk, R. R. Unocic, G. M. Veith, S. Dai and S. M. Mahurin, Water Desalination Using Nanoporous Single-LayerGraphene, Nat. Nanotechnol., 2015, 10, 459–464 CrossRef CAS PubMed.
- J. Kotakoski, C. Mangler and J. C. Meyer, Imaging atomic-level random walk of a point defect in graphene, Nat. Commun., 2014, 5, 3991 CAS.
- F. Tang, T. Ohto, T. Hasegawa, W. J. Xie, L. Xu, M. Bonn and Y. Nagata, Definition of Free O–H Groups of Water at the Air–WaterInterface, J. Chem. Theory Comput., 2018, 14, 357–364 CrossRef CAS PubMed.
- C.-S. Hsieh, R. K. Campen, M. Okuno, E. H. G. Backus, Y. Nagata and M. Bonn, Mechanism of Vibrational Energy Dissipation of Free OH Groups at the Air–Water Interface, Proc. Natl. Acad. Sci. U. S. A., 2013, 110, 18780–18785 CrossRef CAS PubMed.
- J. A. McGuire and Y. R. Shen, Ultrafast Vibrational Dynamics at Water Interfaces, Science, 2006, 313, 1945 CrossRef CAS PubMed.
- S. Xiao, F. Figge, G. Stirnemann, D. Laage and J. A. McGuire, Orientational Dynamics of Water at an Extended Hydrophobic Interface, J. Am. Chem. Soc., 2016, 138, 5551–5560 CrossRef CAS PubMed.
- G. Bussia, D. Donadio and M. Parrinello, J. Chem. Phys., 2007, 126, 014101 CrossRef PubMed.
- J. Schaefer, E. H. G. Backus, Y. Nagata and M. Bonn, J. Phys. Chem. Lett., 2016, 7, 4591–4595 CrossRef CAS PubMed.
- M. Ahmed, V. N. P. Mathi, A. K. Singh and J. A. Mondal, J. Phys. Chem. C, 2016, 120, 10252–10260 CAS.
Footnote |
| † Electronic supplementary information (ESI) available. See DOI: 10.1039/c8cp01351a |
| This journal is © the Owner Societies 2018 |