 Open Access Article
Creative Commons Attribution 3.0 Unported Licence
Phenyl radical + propene: a prototypical reaction surface for aromatic-catalyzed 1,2-hydrogen-migration and subsequent resonance-stabilized radical formation†
Zachary J.
Buras
 ,
Te-Chun
Chu
 ,
Adeel
Jamal
 ,
Nathan W.
Yee
 ,
Joshua E.
Middaugh
 and
William H.
Green
 *
*
Department of Chemical Engineering, Massachusetts Institute of Technology, Cambridge, MA 02139, USA. E-mail: whgreen@mit.edu
First published on 13th April 2018
Abstract
The C9H11 potential energy surface (PES) was experimentally and theoretically explored because it is a relatively simple, prototypical alkylaromatic radical system. Although the C9H11 PES has already been extensively studied both experimentally (under single-collision and thermal conditions) and theoretically, new insights were made in this work by taking a new experimental approach: flash photolysis combined with time-resolved molecular beam mass spectrometry (MBMS) and visible laser absorbance. The C9H11 PES was experimentally accessed by photolytic generation of the phenyl radical and subsequent reaction with excess propene (C6H5 + C3H6). The overall kinetics of C6H5 + C3H6 was measured using laser absorbance with high time-resolution from 300 to 700 K and was found to be in agreement with earlier measurements over a lower temperature range. Five major product channels of C6H5 + C3H6 were observed with MBMS at 600 and 700 K, four of which were expected: hydrogen (H)-abstraction (measured by the stable benzene, C6H6, product), methyl radical (CH3)-loss (styrene detected), H-loss (phenylpropene isomers detected) and radical adduct stabilization. The fifth, unexpected product observed was the benzyl radical, which was rationalized by the inclusion of a previously unreported pathway on the C9H11 PES: aromatic-catalysed 1,2-H-migration and subsequent resonance stabilized radical (RSR, benzyl radical in this case) formation. The current theoretical understanding of the C9H11 PES was supported (including the aromatic-catalyzed pathway) by quantitative comparisons between modelled and experimental MBMS results. At 700 K, the branching to styrene + CH3 was 2–4 times greater than that of any other product channel, while benzyl radical + C2H4 from the aromatic-catalyzed pathway accounted for ∼10% of the branching. Single-collision conditions were also simulated on the updated PES to explain why previous crossed molecular beam experiments did not see evidence of the aromatic-catalyzed pathway. This experimentally validated knowledge of the C9H11 PES was added to the database of the open-source Reaction Mechanism Generator (RMG), which was then used to generalize the findings on the C9H11 PES to a slightly more complicated alkylaromatic system.
1. Introduction
The addition of the phenyl radical, C6H5, to the unsaturated C![[double bond, length as m-dash]](https://www.rsc.org/images/entities/char_e001.gif) C bond in propene, C3H6, produces two different propylbenzene radicals depending on the addition site, which are representative of a broader class of alkylaromatic radicals. As defined here, alkylaromatic radicals consist of an aromatic group, which can either be a single benzene ring or a polycyclic aromatic hydrocarbon (PAH) of arbitrary size, and at least one alkyl side chain of arbitrary length and branching on which the radical site resides. Alkylaromatic radicals can form either by “bottom-up” growth of smaller molecules, such as C6H5 + C3H6,1 or by “top-down” decomposition of larger molecules, such as in the combustion or pyrolysis of gasoline, diesel and jet fuels which contain significant amounts of closed-shell alkylaromatic compounds like propylbenzene.2 Once formed, the subsequent decomposition, growth or oxidation of alkylaromatic radicals can dictate the extent of PAH and soot formation, with potentially deleterious effects on climate3 and human health.4 Soot, or “coke”, formation is also usually undesirable in industrial processes such as ethane steam cracking,5 where fouling of the reactor can necessitate costly shutdowns for cleaning. Alkylaromatic linkages and radicals are also important in the chemistry of heavy oils, coal, kerogen, lignin and many polymers. Therefore, understanding all of the ways in which alkylaromatic radicals can react is critical to a number of diverse applications including combustion, industrial cracking, organic geochemistry, and utilization of waste materials and biomass.
C bond in propene, C3H6, produces two different propylbenzene radicals depending on the addition site, which are representative of a broader class of alkylaromatic radicals. As defined here, alkylaromatic radicals consist of an aromatic group, which can either be a single benzene ring or a polycyclic aromatic hydrocarbon (PAH) of arbitrary size, and at least one alkyl side chain of arbitrary length and branching on which the radical site resides. Alkylaromatic radicals can form either by “bottom-up” growth of smaller molecules, such as C6H5 + C3H6,1 or by “top-down” decomposition of larger molecules, such as in the combustion or pyrolysis of gasoline, diesel and jet fuels which contain significant amounts of closed-shell alkylaromatic compounds like propylbenzene.2 Once formed, the subsequent decomposition, growth or oxidation of alkylaromatic radicals can dictate the extent of PAH and soot formation, with potentially deleterious effects on climate3 and human health.4 Soot, or “coke”, formation is also usually undesirable in industrial processes such as ethane steam cracking,5 where fouling of the reactor can necessitate costly shutdowns for cleaning. Alkylaromatic linkages and radicals are also important in the chemistry of heavy oils, coal, kerogen, lignin and many polymers. Therefore, understanding all of the ways in which alkylaromatic radicals can react is critical to a number of diverse applications including combustion, industrial cracking, organic geochemistry, and utilization of waste materials and biomass.
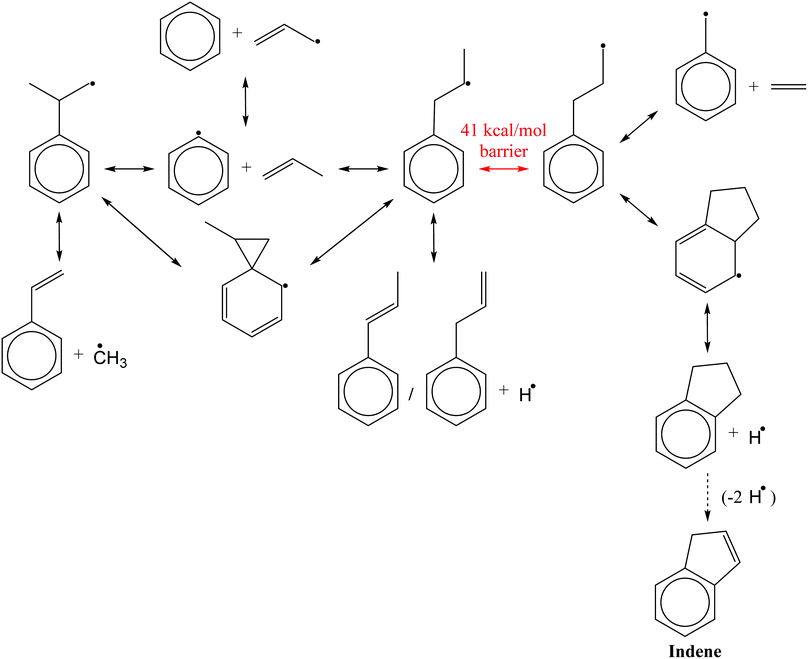
The two propylbenzene radicals directly formed by C6H5 + C3H6 have served as relatively simple surrogates for more complicated alkylaromatic radicals in many top-down experimental and theoretical studies of propylbenzene oxidation and pyrolysis, recently summarized by Yuan et al.,2 and in nine bottom-up studies utilizing C6H5 + C3H6 (including this work) summarized in Table 1. From this large body of work on the C9H11 potential energy surface (PES) a consensus has emerged (with some caveats discussed below) regarding the major expected reaction pathways of the C6H5 + C3H6 system, shown in Scheme 1. C6H5 mostly reacts with C3H6 by addition to the terminal and central C![[double bond, length as m-dash]](https://www.rsc.org/images/entities/char_e001.gif) C sites, and by hydrogen, H, abstraction from the allylic carbon in C3H6. The two propylbenzene radicals formed by addition can easily interconvert via a 1,2-phenyl-migration, and are usually assumed to be equilibrated at combustion-relevant temperatures. The central-addition product will mostly β-scission a methyl radical, CH3, to form styrene, whereas the terminal-addition product will β-scission an H on one of the two neighbouring carbons to form 3- or 1-phenylpropene. Alternatively, if the radical site on the terminal addition product can shift to the end of the alkyl chain via a 1,2-H-migration, the resulting alkylaromatic radical can either β-scission an ethene, C2H4, to form a benzyl radical or it can undergo a secondary ring-closure to form a five-membered ring. Subsequent β-scission of an H from the bicyclic radical forms indane, which can form indene following loss of two more H atoms. Indene is a precursor to PAH and soot, and it is mostly because of this potential route to indene that C6H5 + C3H6 has been of such interest.1 However, the 1,2-H-migration that enables indane formation has a barrier at least 6 kcal mol−1 higher than the various β-scissions mentioned above, rendering that pathway uncompetitive, even under combustion conditions.11 The lack of indane formation from C6H5 + C3H6 and the dominance of styrene and phenylpropene isomers as products is supported both by calculations of the product branching9,11 and by experiments conducted under single-collision8,9,12 and thermal environments.10
C sites, and by hydrogen, H, abstraction from the allylic carbon in C3H6. The two propylbenzene radicals formed by addition can easily interconvert via a 1,2-phenyl-migration, and are usually assumed to be equilibrated at combustion-relevant temperatures. The central-addition product will mostly β-scission a methyl radical, CH3, to form styrene, whereas the terminal-addition product will β-scission an H on one of the two neighbouring carbons to form 3- or 1-phenylpropene. Alternatively, if the radical site on the terminal addition product can shift to the end of the alkyl chain via a 1,2-H-migration, the resulting alkylaromatic radical can either β-scission an ethene, C2H4, to form a benzyl radical or it can undergo a secondary ring-closure to form a five-membered ring. Subsequent β-scission of an H from the bicyclic radical forms indane, which can form indene following loss of two more H atoms. Indene is a precursor to PAH and soot, and it is mostly because of this potential route to indene that C6H5 + C3H6 has been of such interest.1 However, the 1,2-H-migration that enables indane formation has a barrier at least 6 kcal mol−1 higher than the various β-scissions mentioned above, rendering that pathway uncompetitive, even under combustion conditions.11 The lack of indane formation from C6H5 + C3H6 and the dominance of styrene and phenylpropene isomers as products is supported both by calculations of the product branching9,11 and by experiments conducted under single-collision8,9,12 and thermal environments.10
| Publication | Experiment | Theory | |
|---|---|---|---|
| Reaction conditions | Detection technique | ||
| a Same level of theory as that used in this work, which is described in the Theoretical section. b RRKM = Rice–Ramsperger–Kassel–Marcus theory for k(E). c ME = Master equation model of T,P-dependent kinetics. d TST = transition state theory for high-P,T-dependent kinetics. | |||
| 1972 Hefter et al.6 | Photolytically generated C6H5 in liquid C3H6 (183–213 K) | Electron spin resonance of products | — |
| 2006 Park et al.7 | Photolytically generated C6H5 in excess C3H6/Ar gas (296–496 K, 40 Torr) | Cavity Ring Down Spectrometry (CRDS) of C6H5 | G2M(RCC6)//B3LYP |
| 2008 Zhang et al.8 | Crossed Molecular Beams (CMB) of C6H5 and C3H6 (≥31 kcal mol−1 collision energy) | Electron Impact (EI) Quadrupole Mass Spectrometry (QMS) | — |
| 2012 Kaiser et al.9 | CMB of C6H5 and C3H6 (∼10 kcal mol−1 collision energy) | EI QMS | G3(MP2,CC)//B3LYPa + RRKMb |
| 2012 Zhang et al.10 | Pyrolytically generated C6H5 in excess C3H6 gas (1200–1500 K, 300 Torr) | Tunable Vacuum Ultraviolet (VUV) Molecular Beam Mass Spectrometry (MBMS) | — |
| 2012 Kislov et al.11 | — | — | G3(MP2,CC)//B3LYPa +RRKMb/MEc/TSTd |
| 2013 Albert et al.12 | CMB of C6H5 + C3H6 (≥20 kcal mol−1 collision energy) | VUV QMS | — |
| 2014 Wang et al.13 | — | — | CBS-QB3 + TSTd |
| This work | Photolytically generated C6H5 in excess C3H6/He gas (295–707 K, 10–50 Torr) | Multiple-pass laser absorbance of C6H5, C3H5 and C7H7 + VUV Time-of-Flight (TOF) MBMS | G3(MP2,CC)//B3LYPa + RRKMb/MEc/TSTd |
The single-collision experiments, conducted in crossed molecular beam (CMB) apparatuses with Quadrupole Mass Spectrometry (QMS) detection, ruled out significant indane formation at collision energies, Ecol, of ∼10 kcal mol−1 (ref. 9) and ∼30 kcal mol−1 (ref. 8) based on both the measured exoergicity of the H-loss channel and from experiments with deuterated C3H6. The thermal experiment, conducted in a fast pyrolysis reactor maintained at 1200–1500 K in 300 Torr of C3H6, ruled out indane formation based on the measured photoionization efficiency (PIE) curves of the product(s) at a mass-to-charge ratio, m/z, of 118 amu, corresponding to the mass of the various H-loss products with the molecular formula C9H10.
Although there is qualitative agreement in the literature regarding what the major products of C6H5 + C3H6 should (styrene and phenylpropene isomers) and should not (indane) be, quantitatively there are three discrepancies. First, the extent of H-abstraction is predicted to be significant, increasing from ∼10% of the product branching at 300 K to ∼80% at 3000 K,11 but this has never been quantified experimentally. Of the six previous experimental studies listed in Table 1, only the photolysis experiments of Hefter et al. in liquid C3H6 reported measurable products of H-abstraction: benzene, C6H6, and allyl radical, the most thermodynamically stable of the C3H5 isomers.6 In that work, C6H5 was found to prefer radical addition to the terminal C![[double bond, length as m-dash]](https://www.rsc.org/images/entities/char_e001.gif) C carbon in propene over the other two major entrance reactions (Scheme 1), consistent with the low temperatures used (182–213 K). Of the two remaining experiments conducted in a thermal reactor, the fast pyrolysis experiment of Zhang et al. was done under aggressive conditions that would encourage many side, secondary, tertiary and higher reactions,10 making it impossible to extract quantitative information about the underlying chemistry without a detailed kinetic mechanism. The Cavity Ring Down Spectrometry (CRDS) experiments of Park et al. were conducted under more controlled conditions, and the probe laser wavelength used, 504.8 nm, was tuned to a known absorbance feature of C6H5,14 where few other radicals absorb, enabling selective detection of C6H5.7 While convenient for accurate quantification of overall consumption rates, selective detection of a photolytically generated radical reactant (C6H5 in this case) leaves the experimentalist blind to subsequent product formation, which was the case in Park et al.7 Finally, all three of the CMB experiments with QMS detection were unable to detect either C3H5 or C6H6, likely due to lower sensitivity for light species and overlap with the large 13C peak of scattered C6H5,12 respectively.
C carbon in propene over the other two major entrance reactions (Scheme 1), consistent with the low temperatures used (182–213 K). Of the two remaining experiments conducted in a thermal reactor, the fast pyrolysis experiment of Zhang et al. was done under aggressive conditions that would encourage many side, secondary, tertiary and higher reactions,10 making it impossible to extract quantitative information about the underlying chemistry without a detailed kinetic mechanism. The Cavity Ring Down Spectrometry (CRDS) experiments of Park et al. were conducted under more controlled conditions, and the probe laser wavelength used, 504.8 nm, was tuned to a known absorbance feature of C6H5,14 where few other radicals absorb, enabling selective detection of C6H5.7 While convenient for accurate quantification of overall consumption rates, selective detection of a photolytically generated radical reactant (C6H5 in this case) leaves the experimentalist blind to subsequent product formation, which was the case in Park et al.7 Finally, all three of the CMB experiments with QMS detection were unable to detect either C3H5 or C6H6, likely due to lower sensitivity for light species and overlap with the large 13C peak of scattered C6H5,12 respectively.
The second quantitative discrepancy is the extent of CH3-loss relative to H-loss. Kaiser et al. computed relative product yields under single-collision conditions by combining G3(MP2,CC)//B3LYP calculations of the C9H11 PES with microcanonical Rice–Ramsperger–Kassel–Marcus (RRKM) theory for energy-dependent rate coefficients, k(E), and then applying the steady-state approximation to the set of differential equations describing the reaction network.9 This calculation does not include the contribution of H-abstraction because as noted above it was not possible to observe the products of H-abstraction in the CMB experiments. The single-collision product calculations of Kaiser et al. were quantitatively consistent with CMB experiments reported in that same work at Ecol ≈ 10 kcal mol−1, where yields of CH3- and H-loss products were measured as ∼70% and ∼30%, respectively. At higher Ecol it was predicted that the yield of CH3-loss would drop steadily to ∼20% at ∼45 kcal mol−1 to be replaced by various H-loss products (mostly 3-phenylpropene). This prediction was also consistent with earlier CMB experiments at Ecol > 30 kcal mol−1, where only H-loss products were observed, and the CH3-loss yield was approximated as <10% due to the detection limit.8 However, Albert et al. measured a much higher relative product yield of CH3- to H-loss at intermediate Ecol's of ∼20 and 25 kcal mol−1 than expected based on the calculations of Kaiser et al.: ∼10![[thin space (1/6-em)]](https://www.rsc.org/images/entities/char_2009.gif) :
:![[thin space (1/6-em)]](https://www.rsc.org/images/entities/char_2009.gif) 1 and ∼3
1 and ∼3![[thin space (1/6-em)]](https://www.rsc.org/images/entities/char_2009.gif) :
:![[thin space (1/6-em)]](https://www.rsc.org/images/entities/char_2009.gif) 1, respectively.12 One proposed explanation for the experimental discrepancy between Albert et al. and Kaiser et al. is that the latter used 80 eV electron impact ionization, necessitating the deconvolution of fragments, whereas the former used 9.9 eV “soft” vacuum ultraviolet (VUV) photoionization (PI). Furthermore, the G3(MP2,CC)//B3LYP C9H11 PES first reported by Kaiser et al. was later combined with RRKM theory to solve the master equation (ME) describing temperature- and pressure-dependent kinetics under thermal conditions.11 These thermal calculations predict similar yields of CH3 and H-loss products from 1200 to 1500 K and at 300 Torr, whereas Zhang et al. measured ∼5× more styrene from CH3-loss than the sum of all H-loss products under the same conditions. As mentioned earlier, however, this discrepancy could be due to secondary chemistry occurring during the pyrolysis.
1, respectively.12 One proposed explanation for the experimental discrepancy between Albert et al. and Kaiser et al. is that the latter used 80 eV electron impact ionization, necessitating the deconvolution of fragments, whereas the former used 9.9 eV “soft” vacuum ultraviolet (VUV) photoionization (PI). Furthermore, the G3(MP2,CC)//B3LYP C9H11 PES first reported by Kaiser et al. was later combined with RRKM theory to solve the master equation (ME) describing temperature- and pressure-dependent kinetics under thermal conditions.11 These thermal calculations predict similar yields of CH3 and H-loss products from 1200 to 1500 K and at 300 Torr, whereas Zhang et al. measured ∼5× more styrene from CH3-loss than the sum of all H-loss products under the same conditions. As mentioned earlier, however, this discrepancy could be due to secondary chemistry occurring during the pyrolysis.
Finally, there is disagreement regarding the identity of the dominant H-loss isomer. While there is wide agreement that styrene is the dominant CH3-loss product, there are conflicting reports in the literature as to whether 3-phenylpropene or 1-phenylpropene dominates H-loss. Both the single-collision and thermal calculations of Kaiser et al.9 and Kislov et al.,11 respectively, predict that 3-phenylpropene will have the highest yield of any H-loss product by far over all conditions considered. This is in nominal agreement with the PIE curves measured at m/z = 118 amu by Zhang et al., which could be fit by assuming almost 100% 3-phenylpropene, but given the number of potential 118 amu isomers (indane, both cis- and trans-1-phenylpropene, 2-phenylpropene and 3-phenylpropene) this fit is best considered as just one possible solution.10 In contrast, the earlier CMB experiments of Zhang et al. identified 1-phenylpropene as the dominant H-loss isomer at Ecol ≈ 45 kcal mol−1 based on experiments with deuterated isotopologues of C3H6.8 Albert et al. also tentatively assigned the H-loss product observed in ∼20–25 kcal mol−1 CMB experiments to 1-phenylpropene, based on analogy to the products observed from C6H5 + 2-butene, 2-C4H8, in the same work.12
This work aims to alleviate the first two of the three discrepancies summarized above (extent of H-abstraction and the extent of CH3- to H-loss) by applying a different detection technique to the problem: time-resolved molecular beam MS (MBMS) with VUV PI. The reaction conditions used here are most similar to those in the work of Park et al.7 (photolytically generated C6H5 in a thermal environment), but the use of time-resolved MBMS for detection allows for quantification of all products as they are formed, including C6H6 from H-abstraction. Additionally, unlike the fast pyrolysis experiments of Zhang, which also used MBMS under thermal conditions, the primary products of C6H5 + C3H6 can be easily distinguished from later generation products based on their faster appearance, enabling more conclusive quantification of CH3- to H-loss as a function of temperature and pressure. The experimental apparatus used in this work is also equipped to perform multiple-pass laser absorbance measurements, allowing for precise quantification of the overall C6H5 consumption rate, which is compared to the CRDS measurements of Park et al.7 Finally, benzyl radical was observed as an unexpected primary product of C6H5 + C3H6. This finding was rationalized by the inclusion of a new “aromatic-catalyzed” 1,2-hydrogen-migration pathway on the C9H11 PES. All experimental measurements were quantitatively compared to the predictions of the Reaction Mechanism Generator (RMG), which was then used to predict the products of a slightly more complicated alkylaromatic system, 1-naphthyl + 2-butene, in order to demonstrate the general applicability of the insights made into the C6H5 + C3H6 system.
2. Experimental
A previous version of the experimental apparatus has been described before,15,16 and the latest version will be described in detail in a forthcoming publication.17 A brief description is provided here, with an emphasis on two major changes made to the apparatus since the last publication.The apparatus consists of a custom quartz flow-reactor housed in a high vacuum chamber equipped with a time-of-flight MS (TOF-MS). Switching from a stainless steel reactor with ∼6 cm inner diameter to a more compact quartz reactor described below was the first major change to the apparatus. The new reactor is 1 m long with a 16 mm inner diameter (2.5 mm wall thickness) in the central 0.4 m and a 36 mm inner diameter (2 mm wall thickness) everywhere else. Gases are mixed upstream and pumped through the reactor by a Roots blower. Pressure is controlled in the reactor by throttling a butterfly valve at the exit. The contents of the flow reactor are coaxially flashed by a collimated 266 nm laser beam (fourth harmonic frequency of an Nd:YAG laser) at a set repetition rate (usually 1 Hz). The total gas flow through the reactor is set such that one flash per refresh (FPR) conditions are maintained. The photolysis beam is expanded by a set of telescoping lenses and clipped by an adjustable iris to the same diameter as the narrow section of the reactor (16 mm). This approach to setting the photolysis beam diameter (expand and then clip) is intended to reduce radial inhomogeneities at the edges of the beam. A “funnel-shaped” pinhole, similar to that used by Wyatt et al.,18 is drilled in the center of the reactor with a 275 μm diameter at the narrowest point. A small portion of the reactor contents are sampled through the pinhole, and the center of the resulting gas expansion is skimmed by a Beam Dynamics skimmer (Model 16.3, 1.0 mm orifice diameter), forming a molecular beam. After traversing ∼50 mm, the molecular beam intersects with a focused 118 nm (10.5 eV) PI laser beam (ninth harmonic frequency of an Nd:YAG laser). Cations formed in the ionization region are accelerated, focused, and guided to the detector of the Kore TOF-MS (ETP electron multiplier, model AF824) by a set of ion optics.
The second major change to the apparatus was to separate the residual 355 nm radiation from the desired 118 nm PI radiation by an off-axis MgF2 lens. Once the two beams have been dispersed, only the 118 nm beam is allowed to enter the ionization region by passing through a pinhole, while the 355 nm beam is blocked. Preventing the excess 355 nm radiation from reaching the ionization region was necessary to avoid excessive fragmentation and multiphoton ionization. The approach to separating the two wavelengths described here (essentially using the MgF2 lens as a prism) was adapted from Tonokura et al.19
As mentioned earlier, the apparatus is also equipped to do multiple-pass UV-visible laser absorbance, and single-pass IR absorbance of the iodine, I, atom. Details of this portion of the apparatus have been given numerous times before,20,21 and will not be repeated here. Although the quartz reactor is much narrower than the previous reactor, it was designed to accommodate the multiple-pass Herriott cell, hence the custom “bow-tie” geometry of the reactor.17
Previously, with the larger diameter, stainless steel reactor, the radicals formed by photolysis were concentrated in a relatively small central section of the reactor (∼1.3 cm diameter), and would diffuse outwards radially on a timescale commensurate with the kinetics of interest (∼10 ms at ∼10 Torr). With the new reactor, by adjusting the photolysis beam diameter to match the inner diameter of the central 0.4 m, radial diffusion out of the MBMS sampling region can be eliminated as a loss process. The longest kinetic time-scales that can be measured with MBMS is now set by the time it takes for the gas to flow through the narrow, central section (∼50 ms for a 1 Hz experiment).
Switching the reactor material from stainless steel to quartz was also intended to reduce wall reactions that were most clearly manifested by fast hydrogenation of C6H5 to C6H6. However, even after treating the quartz reactor with boric acid following the procedure of Krasnoperov et al.,22 this manifestation of wall reactions was never entirely eliminated (Fig. S9, S18, S29 and S33, ESI†). Nonetheless, control experiments described in the Results and discussion section demonstrate that wall reactions do not noticeably affect the main observations and conclusions made in this work.
The reactor is heated by nichrome ribbon wire in two temperature-controlled zones. There is a short, 5 cm “pre-heat zone” just upstream of where the Herriott cell and the photolysis laser overlap. The gas entering this zone is still at room temperature and is quickly heated to the desired temperature. The following “reaction zone” encompasses almost the entire remaining length of the reactor and maintains near isothermal conditions at the desired temperature. The thermocouples used to control the power supplied to each heater are located inside the reactor at the exit of each zone (out of the path of the photolysis laser). Axial temperature profiles were measured under different experimental conditions and are reported in the Results and discussion section. For the absorbance experiments, the temperature reported is the average T(z) over the central 0.5 m, where the Herriott cell and photolysis laser overlap. For the MBMS experiments, the temperature reported is the average in the 0.2 m narrow section on the inlet side of the sampling pinhole. Uncertainties reported are two standard deviations over the same axial range.
Both iodobenzene (C6H5I; Sigma-Aldrich, 98%) and nitrosobenzene (C6H5NO; Sigma-Aldrich, ≥97%) were used as photolytic precursors of C6H5 because both are known to almost entirely photodissociate to C6H5 + I/NO at 266 nm.23,24 Iodobenzene was purged of oxygen by successive freeze–pump–thaw cycles, while nitrosobenzene, a powder at room temperature, was simply degassed. Both precursors were placed in air-tight bubblers and introduced into the reactor by flowing a controlled amount of helium through/over them. Because of the strong reactivity of C6H5 towards O2,14 even ∼100 ppm of residual air in the reactor could have a measurable impact on the experiments. The clearest indicators of O2 present somewhere in the reactor or associated gas lines are a strong visible absorbance signal from the phenylperoxy radical, C6H5OO,25 and a product at m/z = 94 amu (likely phenol, C6H5OH, also seen by Zhang et al.10) in the MS following photolytic C6H5 generation. When C6H5I was used as the precursor, it was possible to eliminate all signs of O2 from the experiment. With C6H5NO, however, there was always some residual O2 in the precursor, manifested by both C6H5OO absorbance and C6H5OH MS signal. C6H5I can also be used up to 900 K before thermal decomposition on the residence time scale of this experiment (1 s) becomes important,26 whereas for C6H5NO the limit is only 700 K.24 The I atom from C6H5I photolysis can also be quantified by IR absorbance, providing an estimate of the initial C6H5 concentration. For all of these reasons, C6H5I was the precursor of choice for almost all of the experiments reported here.
Helium, He, was used as the bath gas in all experiments reported here and was purchased from Airgas (UHP grade, 99.999%). C3H6 was also purchased from Airgas (CP grade, 99%) and used without further purification.
3. Theoretical
Much of the C9H11 PES has already been explored both by Park et al. using G2M(RCC6)//B3LYP7 and by Kislov et al. using G3(MP2,CC)//B3LYP.11 Wang et al. reported CBS-QB3 calculations on a portion of the PES, focused on the 1,2-phenyl-migration connecting the terminal and central addition products.13 This work took the C9H11 PES calculated by Kislov et al., and added on one new C9H11 isomer, three new transition states (TSs) and one new bimolecular product channel (benzyl radical, C7H7, + ethene, C2H4) that together comprise the newly discovered aromatic-catalyzed 1,2-H-migration and subsequent resonance stabilized radical (RSR) formation pathway. For consistency, the same level of theory was used. Briefly, geometries and frequencies of the new minima and saddle points were optimized using B3LYP/6-311G(d,p). Starting from the optimized geometries, relaxed potential energy scans were performed (also using B3LYP/6-311G(d,p)) as a function of the dihedral angle in 10° increments around all C–C and nascent C–C bonds that are likely to undergo internal rotation for all stationary points on the C9H11 PES. In some cases the scan revealed that the starting geometry was not the conformational minimum and the geometry was re-optimized accordingly. The 0 K electronic energies of the optimized geometries were refined by using a simplified version of the composite G3(MP2,CC) method:| E0[G3(MP2,CC)] = E[RCCSD(T)/6-311G(d,p)] + (E[MP2/G3large] − E[MP2/6-311G(d,p)]) + E(ZPE) | (1) |
Both high-pressure (P) and P-dependent thermal rate coefficients, k(T) and k(T,P), were calculated on the G3(MP2,CC)//B3LYP C9H11 PES using Cantherm, an open-source software included with RMG.31k(T)'s for every elementary chemical reaction were calculated by canonical transition state theory (TST) using the rigid-rotor harmonic oscillator (RRHO) approximation with low-energy (<10 kcal mol−1 barrier) internal rotations modelled as one-dimensional hindered rotors (1D-HR). Tunnelling was modelled using the 1D-asymmetric Eckart correction.32 Phenomenological k(T,P)'s were fit by applying RRKM/ME under the modified strong collision (MSC) approximation (RRHO and 1D-HR approximations also used in calculating densities of states).33 For the two barrierless exit channels found by Kislov et al., the high-P variational TST k(T)'s calculated in that work were input to Cantherm and converted into k(E)'s for solution of the ME by inverse Laplace transform.33 Lennard-Jones and collisional energy-transfer (CET) parameters were taken from Mebel et al. for an argon bath gas,1 and scaled down for a helium bath gas using the calculations of Jasper et al.34
The same custom scripts used in Kaiser et al.9 for simulating single-collision experiments on the C9H11 PES were also used here on the expanded PES. k(E)'s were calculated using RRKM at a fixed E corresponding to Ecol. Using the calculated k(E) values, a system of ordinary differential equations (ODEs) was constructed that describes the connectivity of the PES. The initial composition was set to either 100% of the terminal or 100% of the central addition adduct. The ODEs were solved under the steady-state approximation in order to determine predicted product branching as a function of Ecol for comparison to CMB experiments. The product branching for the two different initial adducts were very similar, and the total product branching was estimated by summing the two sets of calculations weighted by the expected thermal branching between terminal and central addition. The temperature used to evaluate the thermal branching was calculated as 2/3 × Ecol/R, or the temperature at which the average kinetic energy in a Boltzmann distribution is Ecol.
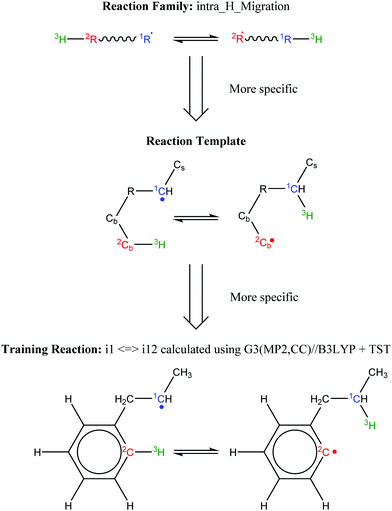
Finally, all elementary reactions on the C9H11 PES were added as training reactions to the RMG database.31Scheme 2 gives an example of one of the training reactions added in this work and its position in the larger RMG database hierarchy. High-P kinetic data are provided with each training reaction and in this case the TST calculated k(T)'s were used. The kinetic portion of the RMG database is currently divided into ∼50 reaction families common to gas-phase combustion chemistry, such as intramolecular H-migration (abbreviated as intra_H_migration). Each family uses reaction templates to describe the critical details for a given reaction. In the example given, the reaction template specifies a 1–4-H-migration from a carbon in a benzene ring (identified by the atom label “Cb”) to a secondary carbon radical. The template can also provide information about atoms not directly involved in the reaction. For example, one of the atoms between the two reacting ends is another Cb, and one of the atoms bonded to the radical carbon is a Cs (a carbon with only single bonds, i.e., an sp3 carbon). Such details can have large impacts on the real kinetics, so it is critical for RMG to be aware of these details to make good estimates for reactions with unknown kinetics. Training reactions are the most specific representations of a reaction in the RMG database. When RMG proposes a reaction with unknown kinetics during automatic mechanism generation, it will match the new reaction to similar training reactions based on their similar reaction templates, utilizing the kinetic parameters of the training reactions to estimate parameters for the new reaction. For example, this work is primarily concerned with C6H5 + C3H6, but any arbitrary alkylaromatic radical system, such as 1-naphthyl + 2-butene, 1-C10H7 + 2-C4H8, will undergo many of the same reactions with similar kinetics and heats of reaction. By training the RMG database on reliable kinetics for the C9H11 system, the knowledge gleaned from that specific system will automatically be applied to every analogous alkylaromatic system, including 1-C10H7 + 2-C4H8. This analogy is explored in more detail in Section 4.6.
4. Results and discussion
4.1 Calculated energetics and kinetics of C9H11 PES
Fig. 3 shows a reduced version of Kislov et al.'s G3(MP2,CC)//B3LYP C9H11 PES11 appended with the aromatic-catalyzed 1,2-H-migration and subsequent RSR formation pathway calculated in this work. For clarity, only the kinetically important features of the PES are shown, and the same intermediate and product names are used as in the previous work (e.g., i1 for intermediate 1 and p1 for product 1, which is styrene). The major expected pathways of C6H5 + C3H6 forming styrene (p1), benzene (C6H6) and phenylpropene isomers (p2–p4) have already been discussed in the Introduction and will not be repeated here.The relatively high-energy (∼40 kcal mol−1) direct 1,2-H-shift from i1 to i4 is highlighted in red, and the lower-energy (∼30 kcal mol−1) aromatic-catalyzed 1,2-H-shift is highlighted in green. Once i4 is formed, it can produce indane (p5) in two steps, as discussed in the Introduction, or it can simply β-scission a C–C bond to form the benzyl radical, C7H7 (p10), and ethene, C2H4. It is because of the latter product channel, benzyl radical + C2H4, that the aromatic-catalyzed 1,2-H-migration was inferred from experiments described in the following sections.
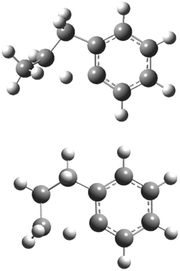
The aromatic-catalyzed 1,2-H-migration proceeds in two steps. First i1 undergoes a 1,4-H-migration, transferring one of the H's on an ortho-carbon to the secondary carbon radical on the alkyl side-chain via a 5-membered-ring TS (Fig. 1). The barrier for this first, rate-limiting step in the aromatic-catalyzed 1,2-H-migration is energetically similar to the barrier for β-scission of CH3 from i2 (∼30 kcal mol−1), which is known to be a major loss channel for equilibrated i1/i2. The new intermediate formed (i12) has a radical site on an ortho-carbon and a fully saturated propyl side-chain. i12 can then undergo a 1,5-H-migration, transferring one of the H's on the primary carbon at the end of the alkyl side-chain back to the ortho-carbon via a low barrier (∼8 kcal mol−1) 6-membered-ring TS (Fig. 1) forming i4. To summarize, an overall reaction (i1 → i4) that has a high barrier as a one-step process (1,2-H-shift) is more energetically feasible as a two-step process (1,4-H-shift + 1,5-H-shift) enabled by the presence of a catalyst that is unaltered at the end of the process (the phenyl side group). Hence, the two-step i1→ i12 → i4 process was given the name “aromatic-catalyzed” 1,2-H-shift in acknowledgement of the central role of the aromatic side group (phenyl in this case) as both a source and a sink of the H-atom, much like a conventional Bronsted acid catalyst that acts as both source and sink of protons. This pathway is accessible to many radicals containing aromatic-groups as long as there is an H on at least one ortho-carbon site. The second step is fast if there is at least one H on a carbon in the chain in a β, γ or δ position relative to the aromatic group.
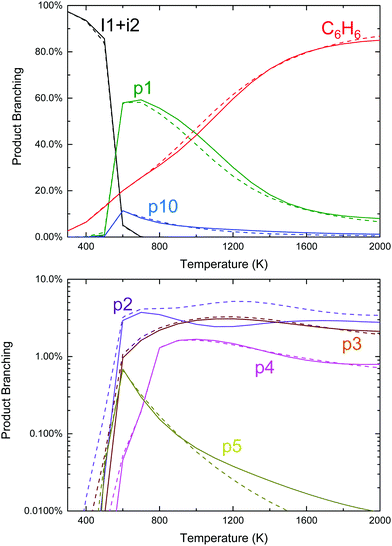
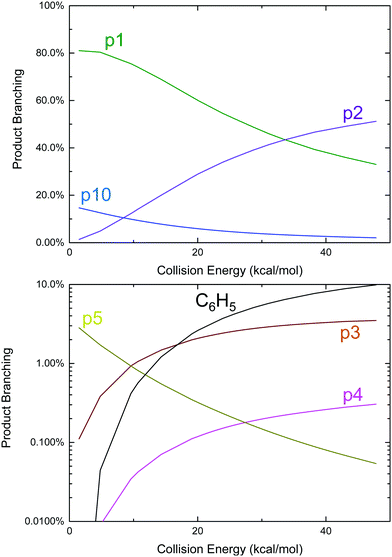
Given the favourable energetics of the previously unreported aromatic-catalyzed 1,2-H-shift, it was deemed worthwhile to revisit calculations of the C6H5 + C3H6 product branching under both thermal (T, P, see Fig. 2) and single-collision (E, see Fig. 4) conditions, and to re-assess previous experimental results in this new context.
The thermal product branching was calculated by simulating the network of Cantherm-generated phenomenological k(T,P)'s on the C9H11 PES in an isothermal, isobaric, homogeneous batch reactor in CHEMKIN35 for 50 milliseconds. The initial C6H5 and C3H6 concentrations were kept fixed at 3 × 10¹² and 5 × 1016 cm−3, respectively, for all T, P conditions, with the helium bath gas providing the balance of the gas density. These specific reaction conditions were chosen to closely simulate the conditions of the experiment reported in this work in order to facilitate comparison. The k(T,P)'s taken from Cantherm include both thermally activated, well-to-well rates (i1 → i3, for example) and chemically activated, well-skipping rates (i1 → p10 + C2H4, for example). When simulated together, the combined thermally and chemically activated k(T,P)'s provide a complete picture of the initial chemical evolution of the thermal system, neglecting side and secondary reactions not on the same PES (considered later).
Qualitatively, the thermal product branching shown in Fig. 2 is very similar to that calculated by Kislov et al.,11 albeit their definition of product branching is slightly different. At low-T stabilized i1 dominates the product distribution, but from 600 to 1000 K styrene, p1, becomes the prominent product. With a further increase in T, branching to p1 gradually decreases to be replaced mostly with C6H6 from the three H-abstraction channels. Unlike the predictions of Kislov et al., a peak branching of ∼10% benzyl radical, p10, is predicted at ∼600 K and like styrene diminishes with T. Given the chemical complexity of previous thermal experiments probing C6H5 + C3H6,6,10 the lack of observable benzyl radical in those works could easily be attributed to side reactions. However, in the product mass spectrum reported by Zhang et al. there is a peak at m/z = 91 amu (mass of the benzyl radical) though it is not discussed.10
Also unlike Kislov et al., the predicted pressure dependence from 10 to 1000 Torr over the whole T-range is negligible. This prediction was not sensitive to the choice of CET parameters or the method used to solve the ME.33 The discrepancy with Kislov et al. is likely due to the difference in the definition of product branching, specifically the inclusion of both thermally and chemically activated pathways in the simulation. The predicted lack of P-dependence is shown to be consistent with experiments in Section 4.3.
Finally, although the branching to indane, p5, is about an order of magnitude higher than in Kislov et al. due to the aromatic-catalyzed 1,2-H-shift promoting isomerization to i4, the overall amount of p5 formed is still small (∼1% peak), consistent with the experiments of Zhang et al.10 Overall, the predicted thermal product branching reported here does not significantly alter the current understanding of C6H5 + C3H6 (styrene, phenylpropene isomers and benzene are all still major products) other than the inclusion of a non-negligible, pressure-independent ∼10% yield of benzyl radical and C2H4.
An approach identical to Kaiser et al.9 for quantifying product branching under single-collision conditions was taken here and has already been described in the Theoretical section. Just as in the thermal case, the single-collision product branching shown in Fig. 4 is very similar to what has previously been reported, this time by Kaiser et al., with some important exceptions. In terms of similarities, p1 dominates at low Ecol and is gradually replaced by p2 with increasing Ecol. This was the same qualitative observation made by all three CMB experiments regarding the effect of Ecol on the CH3-loss to H-loss ratio.8,9,12 One main difference is that there is up to ∼15% branching to the benzyl radical, p10, at the lowest Ecol, followed by a steady decline. Considering that all of the CMB experiments were conducted at Ecol ≥ 10 kcal mol−1, any p10 formed in those experiments was likely below the detection limit. The other important difference is an increased yield of p5 (up to 3%), but that would have also been too small to detect in the CMB experiments, making it consistent with the observations made therein.8,9
To conclude this section, although the newly discovered aromatic-catalyzed 1,2-H-migration is predicted to be both energetically and kinetically competitive with the other reactions on the C9H11 PES available to C6H5 + C3H6, none of the six previously published experiments on this system have seen clear evidence for it. In the case of the thermal experiments this is either because of complex chemistry with side and secondary reactions,6,10 or because the detection technique was not intended for product measurements, as in the CRDS experiments of Park et al.7 In the case of the CMB experiments, detection sensitivity is the issue. Most of the remainder of this work will present experimental measurements coupled with detailed modelling that together quantitatively support the predictions above.
4.2 Overall k(T) measured by 505.3 nm absorbance
In addition to MBMS and laser absorbance experiments to quantify product branching, discussed in the following sections, 505.3 nm absorbance of C6H5 was also used to measure the total consumption rate coefficient, ktotal(T), of C6H5. These measurements of ktotal(T) are presented first because later results depend on them.C6H5 is known to have a low-lying electronic transition at 504.8 nm at room temperature,14 but in this work 505.3 nm was used to probe C6H5 under all T, P conditions due to slightly higher absorbance observed at that wavelength. The other radicals formed in the C6H5 + C3H6 system (CH3,36 C3H537 and C7H738) are not expected to absorb significantly at such a relatively long wavelength. Therefore, C6H5 can be probed selectively at 505.3 nm. However, as mentioned earlier, if O2 is present in the reactor at a similar concentration as C6H5, C6H5OO will also absorb strongly and broadly at ∼500 nm,25 providing a convenient leak indicator.
k
total(T) consists of contributions from five different C6H5 + C3H6 entrance channels (two radical additions and three H-abstractions):
| C6H5 + C3H6 → i1 → i2 → C6H6 + CH2CHCH2 (allyl radical, C3H5) → C6H6 + CH3CCH2 → C6H6 + CH2CHCH |
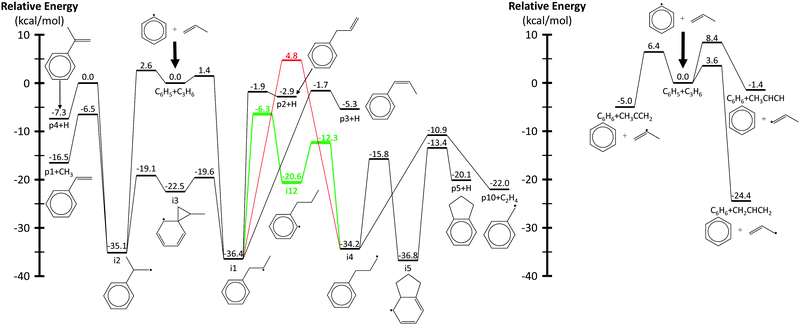 | ||
| Fig. 3 Simplified phenyl radical + propene PES calculated using G3(MP2,CC)//B3LYP/6-311G(d,p). Radical addition pathways are shown on the left and hydrogen abstraction on the right. The direct and aromatic-catalyzed 1,2-hydrogen-migrations are highlighted in red and green, respectively. Energies and geometries for all stationary points were calculated by Kislov et al.,11 except for those in green and the β-scission of i4 to p10 + C2H4, which were calculated in this work. | ||
Background absorbance traces are recorded with He only (or He and C3H6 only) following photolysis to account for spurious absorbance, which is likely due to heating of the Herriott cell optics from scattered photolysis light and subsequent steering of the probe laser beam slightly off of the signal photodiode. The background absorbance was subtracted from absorbance traces recorded with C6H5 present.
Each background-subtracted and normalized 505.3 nm absorbance trace was fit to an exponential decay assuming pseudo-first-order kinetics:
| A(t)/A0 = (1 − a)e−k′t + a | (2) |
| k′ = ktotal[C3H6] + kwall | (3) |
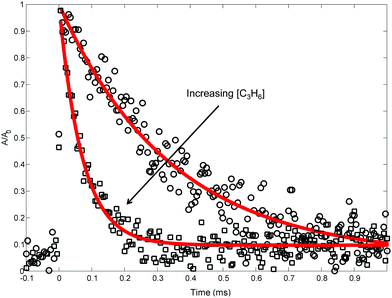 | ||
| Fig. 5 Representative 505.3 nm absorbance decays measured (markers) at 691 K, 10 Torr. Lines are exponential fits. Only every 10th point is shown for clarity. | ||
Table 2 summarizes the conditions of the fourteen 505.3 nm absorbance experiments. Each experiment was conducted at a fixed T and P, and consisted of at least five absorbance traces at different concentrations of propene, [C3H6]. The nominal T was varied from 300 to 700 K, and P was mostly kept at 10 Torr, except for one control experiment at 25 Torr to demonstrate the independence of ktotal(T) from P. C6H5I was used as the photolytic C6H5 precursor in all but two of the experiments for the three reasons mentioned in the Experimental section. Initial radical concentrations were quantified by single-pass IR absorbance of the I atom, following the same procedure described previously.41,42 For a given experiment, [C3H6] was varied over a wide range to verify a linear relationship with k′. Some of the fit kwall values are rather large (>1000 s−1), likely due to a small air leak during those experiments that was later fixed (importantly, all of the MBMS results presented in the next section were obtained without the leak). However, in all experiments [C3H6] was increased such that the decay of C6H5 due to C6H5 + C3H6 was 5–10× the contribution of kwall. The vertical shift factor, a, was usually between −0.1 and 0.1, and in the worst case it was −0.25. Besides varying the precursor identity and P, control experiments were also conducted using different photolysis laser fluences, precursor concentrations, radical concentrations, and flashes per refresh (FPR), in order to verify the independence of a given ktotal(T) from all of these parameters. The reported uncertainty in ktotal(T) is at least 10% due to possible systematic uncertainty in [C3H6], as well as fitting uncertainty.21 For all experiments, the overlap pathlength between the Herriott cell and the photolysis laser was ∼20 m. The absolute 505.3 nm absorbance signal observed for a given [I]0(![[double bond, length as m-dash]](https://www.rsc.org/images/entities/char_e001.gif) [C6H5]0) was consistent with a C6H5 cross-section of ∼2 × 10⁻¹⁹ cm2 under all conditions, similar to the measurement of Tonokura et al.14 (3.6 ± 1.6 × 10⁻¹⁹ cm2 at 504.8 nm and 298 K).
[C6H5]0) was consistent with a C6H5 cross-section of ∼2 × 10⁻¹⁹ cm2 under all conditions, similar to the measurement of Tonokura et al.14 (3.6 ± 1.6 × 10⁻¹⁹ cm2 at 504.8 nm and 298 K).
| Exp. # | Nominal T (K) | Real T (K) | P (Torr) | Xa | [C6H5X]b,c (1013 cm−3) | F (mJ cm−2) | [C3H6]b range (1015 cm−3) | IR [I]0 (1012 cm−3) | # of traces | k total (×10−14) | k wall | Range of af |
|---|---|---|---|---|---|---|---|---|---|---|---|---|
| a Identity of X in the precursor, C6H5X. b 10% uncertainty in all values due to systematic uncertainty in mass flow controller calibrations. c Precursor concentrations calculated assuming that He exiting the bubbler is saturated with C6H5X at its room temperature vapor pressure: 0.92 Torr for C6H5I39 and 0.6 Torr for C6H5NO.40 d Photolysis laser fluence. e Units are molecule, s, cm. f Vertical shift factor in fits to normalized absorbance traces. g Repetition rate of the photolysis laser doubled to 2 Hz to check the effect of flashes per refresh (FPR). | ||||||||||||
| 1 | 300 | 295.3 ± 0.4 | 10 | I | 6.5 | 15 | 26.8–215 | 3.5 ± 1 | 7 | 1.1 ± 0.1 | 550 | −0.02 to 0.05 |
| 2 | 300 | 295.3 ± 0.4 | 10 | I | 13.0 | 15 | 13.4–215 | 6 ± 2 | 7 | 1.1 ± 0.1 | 690 | 0.002 to 0.06 |
| 3 | 300 | 295.3 ± 0.4 | 10 | I | 6.5 | 30 | 26.8–215 | 6 ± 2 | 6 | 1.3 ± 0.1 | 520 | −0.09 to 0.10 |
| 4g | 300 | 295.3 ± 0.4 | 10 | I | 6.5 | 15 | 26.8–215 | 3 ± 1 | 7 | 1.2 ± 0.1 | 390 | −0.09 to 0.04 |
| 5 | 400 | 394 ± 4 | 10 | I | 6.1 | 15 | 25.4–152 | 3 ± 1 | 6 | 3.0 ± 0.3 | 720 | −0.06 to 0.10 |
| 6 | 500 | 494 ± 8 | 10 | I | 6.1 | 15 | 20.1–120 | 3 ± 1 | 6 | 6.3 ± 0.8 | 600 | −0.11 to 0.10 |
| 7 | 600 | 589 ± 14 | 10 | I | 5.6 | 15 | 11.5–69.0 | 2.5 ± 1 | 6 | 13.3 ± 1.6 | 400 | −0.09 to 0.14 |
| 8 | 700 | 691 ± 16 | 10 | I | 5.9 | 15 | 9.8–58.6 | 3 ± 1 | 6 | 19.4 ± 2.5 | 1700 | −0.08 to 0.09 |
| 9 | 700 | 691 ± 16 | 25 | I | 6.2 | 15 | 10.3–61.8 | 3 ± 1 | 6 | 18.7 ± 2.2 | 600 | 0.0 to 0.08 |
| 10 | 700 | 691 ± 16 | 10 | I | 11.8 | 15 | 4.9–24.4 | 6 ± 2 | 5 | 20.5 ± 2.5 | 1700 | −0.08 to 0.12 |
| 11 | 700 | 691 ± 16 | 10 | I | 5.9 | 30 | 9.8–58.6 | 6 ± 2 | 6 | 20.8 ± 2.5 | 2000 | −0.25 to 0.02 |
| 12g | 700 | 691 ± 16 | 10 | I | 5.9 | 15 | 9.8–58.6 | 4 ± 2 | 6 | 18.0 ± 2.1 | 1100 | −0.12 to 0.12 |
| 13 | 300 | 295.3 ± 0.4 | 10 | NO | 0.6 | 4 | 25.8–301 | — | 6 | 1.3 ± 0.1 | 80 | −0.03 to 0.13 |
| 14 | 500 | 494 ± 8 | 10 | NO | 0.6 | 4 | 25.1–150 | — | 5 | 6.1 ± 0.9 | 1600 | 0.03 to 0.11 |
Fig. 6 compares the fourteen measurements of ktotal(T) in this work against the previous measurements of Park et al. using CRDS.7 The two sets of measurements agree well with each other, including the various control experiments. By using a different chemical precursor that does not significantly thermally decompose at <900 K (C6H5I),26 this work is able to extend the upper T at which ktotal(T) is measured by ∼200 K compared to the previous work (C6H5NO, <700 K24).
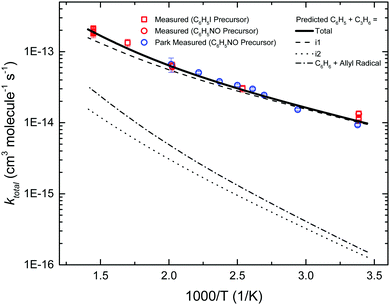 | ||
| Fig. 6 Measured (markers) and predicted (lines) kinetics of phenyl radical + propene entrance reactions. | ||
Also shown is the predicted ktotal(T), obtained by summing the TST calculated rate coefficients for the five different entrance channels. The barrier for terminal addition had to be lowered by 0.75 kcal mol−1 in order to obtain the agreement between experiment and theory shown in Fig. 6. As expected, terminal addition to i1 is predicted to be the dominant entrance channel, especially at lower T, with central addition and allylic H-abstraction ∼1–2 orders of magnitude slower over the experimental range. The calculated entrance rates in Fig. 6 (including the adjusted rate for terminal addition) were used in all subsequent C6H5 + C3H6 models discussed in the following sections.
4.3 Products measured by MBMS
Table 3 summarizes the conditions of the 15 MBMS experiments. Only nominal temperatures of 600 and 700 K were explored because for T < 600 K secondary reactions involving the I atom will dominate the reaction flux (discussed later). Also, at lower T a higher [C3H6] is needed to ensure fast and near-unity reaction of C6H5 with C3H6, but higher [C3H6] tends to lower the MBMS sensitivity both due to attenuation of VUV photons and due to a decrease in the density of the molecular beam for a heavier carrier gas.43P was 10 Torr for all of the experiments except for two conducted at 25 Torr and another two conducted at 50 Torr to test the effect of pressure on the product distribution.| Experiment # | Nominal T (K) | Real T (K) | P (Torr) | [C3H6]a (1015 cm−3) | [C6H5I]a (1013 cm−3) | IR CI,0 (1012 cm−3) | MS CI,0 (1012 cm−3) | Photolysis laser fluence (mJ cm−2) | k sampling (s−1) | c |
|---|---|---|---|---|---|---|---|---|---|---|
| a 10% uncertainty in all values due to systematic uncertainty in mass flow controller calibrations. b Fit first-order rate of MB sampling (see Section S1.5, ESI). c Exponent in power law fit to the mass discrimination factor, R = b(m/z)c (see Section S1.4, ESI). | ||||||||||
| 1 | 600 | 605 ± 4 | 10 | 0 | 6.1 | 2 ± 0.8 | 1 ± 0.5 | 14 | 1500 | 0 |
| 2 | 600 | 605 ± 4 | 10 | 7.5 | 6.1 | 2 ± 0.8 | 1 ± 0.5 | 14 | 1000 | 0.32 |
| 3 | 600 | 605 ± 4 | 10 | 15.0 | 6.1 | 2 ± 0.8 | 1 ± 0.5 | 14 | 1000 | 0.58 |
| 4 | 600 | 605 ± 4 | 10 | 30.0 | 6.1 | 2 ± 0.8 | 1 ± 0.5 | 14 | 1000 | 0.69 |
| 5 | 600 | 605 ± 4 | 10 | 15.0 | 12.1 | 3.5 ± 1.2 | 1.5 ± 0.75 | 14 | 1000 | 0.46 |
| 6 | 700 | 707 ± 6 | 10 | 0 | 5.9 | 3 ± 1.2 | 1 ± 0.5 | 14 | 1500 | 0 |
| 7 | 700 | 707 ± 6 | 10 | 7.4 | 5.9 | 3 ± 1.2 | 1 ± 0.5 | 14 | 750 | 0.57 |
| 8 | 700 | 707 ± 6 | 10 | 15.0 | 5.9 | 3 ± 1.2 | 1.5 ± 0.75 | 14 | 750 | 0.74 |
| 9 | 700 | 707 ± 6 | 10 | 29.0 | 4.1 | 3 ± 1.2 | 1.5 ± 0.75 | 20 | 750 | 0.86 |
| 10 | 700 | 707 ± 6 | 10 | 15.0 | 11.9 | 3 ± 1.2 | 1 ± 0.5 | 7 | 750 | 0.53 |
| 11 | 700 | 707 ± 6 | 10 | 15.0 | 11.9 | 5 ± 1.7 | 2 ± 1.0 | 14 | 750 | 0.51 |
| 12 | 700 | 700 ± 6 | 25 | 0 | 5.9 | 2.5 ± 1.0 | 1 ± 0.5 | 14 | 750 | 0 |
| 13 | 700 | 700 ± 6 | 25 | 7.2 | 5.9 | 2.5 ± 1.0 | 1 ± 0.5 | 14 | 600 | 0.3 |
| 14 | 700 | 687 ± 5 | 50 | 0 | 6.1 | 2 ± 1.0 | 1 ± 0.5 | 14 | 800 | 0 |
| 15 | 700 | 687 ± 5 | 50 | 7.7 | 6.1 | 2 ± 1.0 | 1 ± 0.5 | 14 | 600 | 0.68 |
For a given T,P-condition, the time-dependent product branching was typically measured over four different [C3H6], including an experiment without C3H6. Control experiments were also conducted at different photolysis laser fluence, precursor concentration and radical concentration to check the effect of these variables. Both 505.3 nm absorbance of C6H5 and IR absorbance of the I atom were measured simultaneously with all of the MBMS experiments.
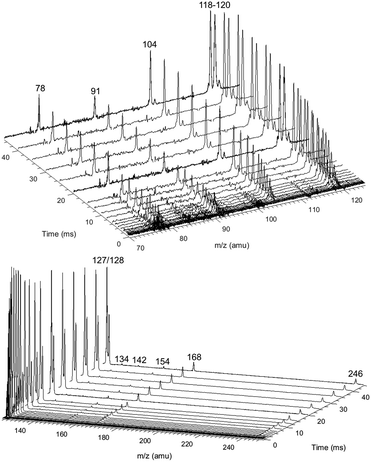
Fig. 8 shows representative, time-resolved mass spectra that have had the pre-photolysis background subtracted out so that only transient signals are observed. The spectra are divided into two m/z regions for clarity: a lower range from 70 to 125 amu where all of the primary C6H5 + C3H6 product signals appear, and a higher range from 125 to 250 amu where the side and secondary product signals appear, many of them corresponding to iodide-containing species. No transient signals were observed below 77 amu (C6H5) for any experiment. Qualitatively, all of the primary C6H5 + C3H6 products (see Fig. 2 for prediction of product branching) are observed at their expected parent m/z: 78 amu for C6H6, 91 amu for p10 (benzyl radical), 104 amu for p1 (styrene), 118 amu for p2–p4 (phenylpropene isomers) and 119 amu for i1 and i2. It should be reiterated that initially the 91 amu product was unexpected based on the previous C6H5 + C3H6 literature, but can now be rationalized by the aromatic-catalyzed 1,2-H-migration that facilitates p10 formation discussed in Section 4.1. The side and secondary products can also be assigned intuitively: 127 and 128 amu correspond to the I atom and HI, 134 amu is the recombination product of i1 + CH3 (named i1-CH3), 142 amu is methyl iodide (CH3I), 154 amu is biphenyl (C6H5–C6H5), 168 amu is allyl iodide (C3H5I) and 246 amu is the recombination product of i1 + I (named i1-I). There is also a small transient signal at m/z = 160 amu that is difficult to discern in Fig. 8 corresponding to i1 + allyl radical (named i1-C3H5).
All of the transient MBMS signals were integrated and plotted against reaction time, as shown for three representative experiments in Fig. 7 (experiments #2, 7 and 15). The thick solid lines in those plots correspond to model predictions, which will be described in the following section. Qualitatively, there are several features of Fig. 7 that are consistent with the product branching predictions of Fig. 2. First, the product branching has a strong dependence on T, which can be seen by comparing experiments #2 and 7, conducted at nominal T's of 600 and 700 K, respectively, and 10 Torr. Second, p1 (104 amu) is the dominant product at 700 K, assuming similar photoionization cross sections (PICS) for all products. The 104 amu signal is 3–4× any of the other product signals, which is in nearly quantitative agreement with Fig. 2. Third, C6H6 is clearly observed as a primary product. The importance of C6H6 with increasing T was predicted both here and in Kislov et al.,11 but has never before been directly confirmed experimentally and was one of the main motivations for this work. Finally, the product branching has negligible P-dependence as seen by comparing experiments #7 and #15, both of which were nominally conducted at 700 K but at different P's (10 and 50 Torr, respectively). Although the time-dependence of the product growth is slower at higher-P, that is likely due to slower radial diffusion impeding the transport of transient species to the MBMS sampling volume rather than a chemistry effect (Section S1.5, ESI†). Disregarding the time-dependence, both experiments #7 and #15 reach nearly identical steady-state product distributions, in agreement with the lack of P-dependence exhibited in the predictions of Fig. 2. The 25 Torr experiment (#13) exhibits a behaviour intermediate to the 10 and 50 Torr experiments (Fig. S30–S32, ESI†). Fig. S32 and S36 in the ESI† show that the instantaneous primary product ratios (relative to styrene/104 amu) at 25 and 50 Torr are essentially time-independent and in agreement with the model, further supporting the claim that the distinct time-dependence of the absolute signal at higher-P is due to transport rather than chemistry effects.
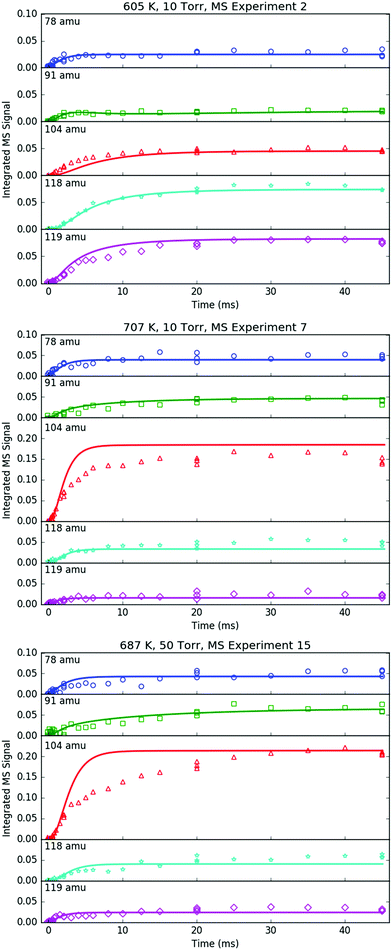 | ||
| Fig. 7 Time profiles of primary phenyl radical + propene products measured with MBMS under indicated conditions. Markers are experimental measurements and lines are model results. | ||
Although there is great qualitative agreement between the measurements of Fig. 7 and the predictions of Fig. 2, there are some clear discrepancies. Most notably, at 600 K (experiment #2) the largest product signals are at m/z = 118 and 119 amu, nominally corresponding to p2–p4 and i1. The dominance of 119 amu at later times is especially unexpected given its assumed identity as a radical. Clearly there is more going on than suggested by Fig. 2, and a more detailed model is needed, specifically, a model that includes not just the major reactions on the C9H11 PES, but also side and secondary reactions on other PESs, including those with the I atom. Ideally, transport effects should also be accounted for in the model, as well as the weighting of each species’ signal by its PICS, the contribution of 13C isotopologues and dissociative ionization (fragmentation). Such a model was developed (model predictions shown as thick solid lines in Fig. 7) and is described in the following section. Another purpose behind constructing a model for this flash photolysis system with MBMS detection is to test if the current theoretical understanding of C6H5 + C3H6 is sufficient to quantitatively explain the experimental measurements. Of specific interest is whether the proposed aromatic-catalyzed 1,2-H-migration can really explain the 91 amu signal. After briefly describing the development of the model, its predictions will be compared in detail to each transient MBMS signal in order to test this understanding (next section).
Regarding the unexpected dominance of 118 and 119 amu at 600 K, careful modelling (and a critical experiment) revealed that both m/z's are actually mostly attributable to fragments of i1-I. At higher T's, i1 undergoes unimolecular isomerization and decomposition reactions much faster compared to its reaction with the I atom, so the role of the I atom is largely diminished at 700 K. At lower T's, the converse is true; hence MBMS experiments were not conducted below 600 K.
Time-profiles for all 15 MBMS experiments (with model comparisons and commentary) are plotted in Fig. S9–S36 (ESI†). It should be mentioned that for the experiments without C3H6, evidence of catalysis by the walls was observed. Specifically, fast hydrogenation of C6H5 to C6H6 was observed that was inexplicable by gas-phase chemistry (i.e., C6H5 self-reaction or reaction with the precursor). Slower, but still inexplicable, hydrogenation of the I atom to HI was also observed. For this reason, MBMS experiments were conducted at various [C3H6] to confirm that sufficient C3H6 had been added such that C6H5 mostly reacted with C3H6 in the gas-phase, rather than abstracting an H-atom from the wall.
4.4 Modelling of flash photolysis with MBMS
The overall approach to modelling the MBMS experiments is summarized in Fig. 9 and many of the individual steps are discussed in detail in the indicated ESI† sections. Briefly, after being “trained” on the relevant alkylaromatic chemistry, RMG was used to automatically construct a chemical mechanism for the important hydrocarbon (HC) chemistry occurring in the flash photolysis experiment. A separate sub-mechanism for I atom chemistry was manually created, largely taking inspiration from recent work by Comandini et al.44 and Tranter et al.,45 and combined with the HC mechanism. The main contribution of the I atom to the observed chemistry is as a recombination co-reactant: R + I = R–I, where R = H, CH3, C3H5, p10, i1 or another I. The initial radical concentration was fit to MBMS time-profiles of the photolytically produced I atom, and the combined HC + I atom mechanism was simulated in an isothermal, isobaric batch reactor in order to obtain concentration profiles for each species i, Ci. Each Ci is then weighted by the PICS for i, σPI,i, at 10.5 eV. PICS are mostly obtained from the literature, except for species where the literature values are unavailable, in which case either estimates or measurements of the PICS were made. The PICS weighted Ci profiles were converted to instantaneous MBMS signals by applying the mass discrimination factor, R(m/z). R(m/z) was fit to the MBMS signals of internal standards, Sint-std, also present in the flash photolysis reactor during experiments at known, low concentrations. Transport effects were accounted for by a simple model adapted from Baeza-Romero et al.46 that lumps all of the time-smearing associated with MB sampling into a single first-order rate coefficient, ksampling, which is fit to the measured rise time of the I atom MBMS profile. Once Si,sampled profiles had been calculated, 13C isotopologues of major species were created assuming a natural abundance of 1.1% × # of carbon atoms. Only isotopologues with zero or one 13C are considered (or observed). Simulated species signals were then fragmented, again using either known, measured or estimated fragmentation patterns. Many of the iodide containing species, R–I, fragment extensively to R+ due to the relatively weak C–I bond,47 which was important to take into account in the model. In particular, i1-I fragments to both m/z = 118 and 119 amu (C9H10+ and C9H11+), and p10-I fragments to 91 amu (C7H7+). Finally, species/fragments with the same m/z were summed and the total, simulated MBMS signal at a given m/z, Sm/z,sampled, was directly compared against experiments.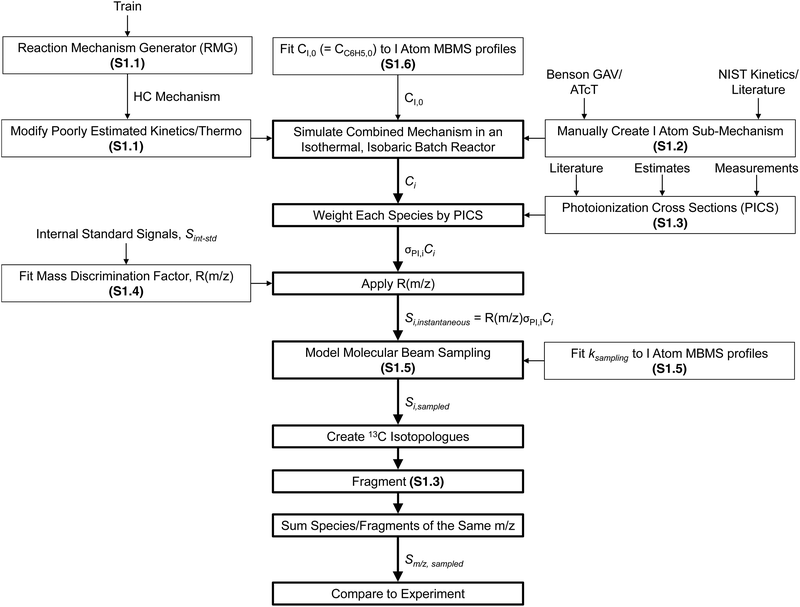 | ||
| Fig. 9 Overall approach to modelling MBMS experiments. Specific ESI† sub-sections where certain aspects of the model are discussed in more detail are given in parentheses. | ||
Before delving into comparisons between the flash photolysis/MBMS model and experiments, it is helpful to summarize exactly what was fit to the 600 K MBMS data due to a lack of literature measurements:
(1) The rate of reactions between i1 and I atom (both recombination and disproportionations).
(2) The total PICS (10 Mb) and fragmentation pattern (1![[thin space (1/6-em)]](https://www.rsc.org/images/entities/char_2009.gif) :
:![[thin space (1/6-em)]](https://www.rsc.org/images/entities/char_2009.gif) 1 at m/z = 91
1 at m/z = 91![[thin space (1/6-em)]](https://www.rsc.org/images/entities/char_2009.gif) :
:![[thin space (1/6-em)]](https://www.rsc.org/images/entities/char_2009.gif) 119 amu) of i1.
119 amu) of i1.
(3) The total PICS (80 Mb) and fragmentation pattern (3![[thin space (1/6-em)]](https://www.rsc.org/images/entities/char_2009.gif) :
:![[thin space (1/6-em)]](https://www.rsc.org/images/entities/char_2009.gif) 6
6![[thin space (1/6-em)]](https://www.rsc.org/images/entities/char_2009.gif) :
:![[thin space (1/6-em)]](https://www.rsc.org/images/entities/char_2009.gif) 1 at m/z = 118
1 at m/z = 118![[thin space (1/6-em)]](https://www.rsc.org/images/entities/char_2009.gif) :
:![[thin space (1/6-em)]](https://www.rsc.org/images/entities/char_2009.gif) 119
119![[thin space (1/6-em)]](https://www.rsc.org/images/entities/char_2009.gif) :
:![[thin space (1/6-em)]](https://www.rsc.org/images/entities/char_2009.gif) 248 amu) of i1-I.
248 amu) of i1-I.
Therefore, good agreement between the 600 K model and experiments is expected, especially for m/z = 118, 119 and 248 amu, which are all almost entirely attributable to i1-I. However, nothing was fit to the 700 K MBMS experiments, except for ksampling and CI,0, which had to be obtained from the I atom MBMS profiles. Therefore, the model should mostly be judged by its ability to simulate the 700 K experiments.
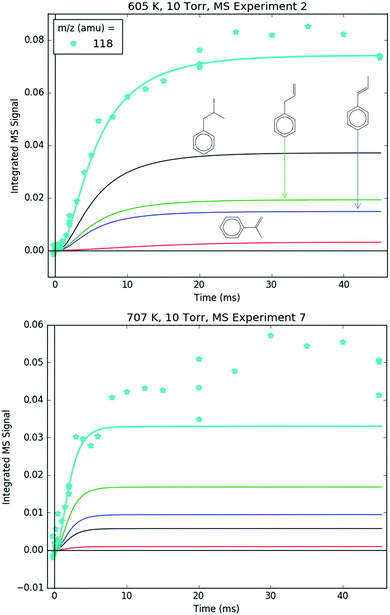
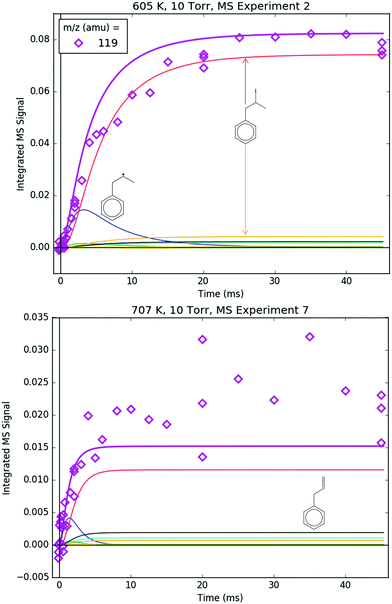
As already shown in Fig. 7, the model described in detail in Section S1 (ESI†) matches the primary product profiles at 10 Torr and both 600 and 700 K. At 50 Torr and 700 K, although the simulated t-dependence is too fast because of inhibited diffusion as discussed in Section S1.5 (ESI†), the final product distribution (and instantaneous product ratios in the ESI†) still matches the model well. This section will focus on comparing every individual m/z with measured time-dependence against the model for both 600 and 700 K (10 Torr only), starting with the five primary products (m/z = 78, 91, 104, 118 and 119 amu). Identical comparison plots are made for all of the MBMS experiments in Fig. S9–S36 (ESI†).
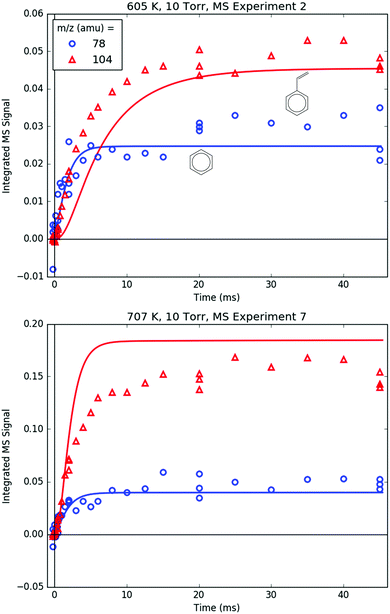
78 and 104 amu are compared together in Fig. 10 because they both are unique in being the only major product signals entirely attributable to just one species: C6H6 and p1 (styrene), respectively. As such, the 78![[thin space (1/6-em)]](https://www.rsc.org/images/entities/char_2009.gif) :
:![[thin space (1/6-em)]](https://www.rsc.org/images/entities/char_2009.gif) 104 ratio is indicative of the competition between H-abstraction and radical addition in the reaction of C6H5 with C3H6, and the model could be fit to the measurements by adjusting the relative barrier heights of those two entrance channels. However, the measurements and the simulations already overlap considering the uncertainty in the model (at least ±15% due to the PICS). Therefore it was deemed unnecessary (and essentially meaningless) to fit the barrier heights. Also, at 600 K, both the model and the experiment show a slower growth time scale for 104 amu (∼10 ms), which is formed in two steps (C6H5 + C3H6 → i1 → p1 + CH3), compared to 78 amu (∼1 ms), which is formed in only one step (C6H5 + C3H6 → C6H6 + C3H5). This demonstrates that although the time resolution of the current MBMS experiments is only ∼1 ms, important differences in chemical time-scales can still be resolved.
104 ratio is indicative of the competition between H-abstraction and radical addition in the reaction of C6H5 with C3H6, and the model could be fit to the measurements by adjusting the relative barrier heights of those two entrance channels. However, the measurements and the simulations already overlap considering the uncertainty in the model (at least ±15% due to the PICS). Therefore it was deemed unnecessary (and essentially meaningless) to fit the barrier heights. Also, at 600 K, both the model and the experiment show a slower growth time scale for 104 amu (∼10 ms), which is formed in two steps (C6H5 + C3H6 → i1 → p1 + CH3), compared to 78 amu (∼1 ms), which is formed in only one step (C6H5 + C3H6 → C6H6 + C3H5). This demonstrates that although the time resolution of the current MBMS experiments is only ∼1 ms, important differences in chemical time-scales can still be resolved.
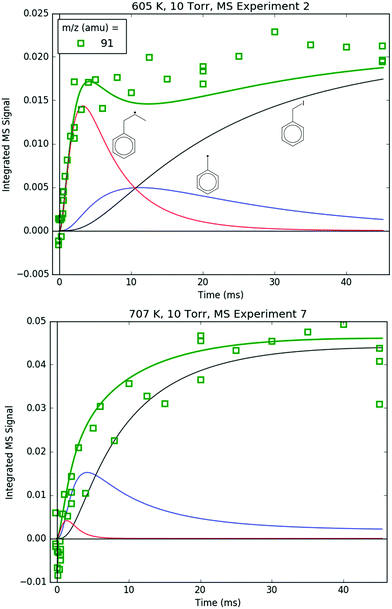
91 amu, shown in Fig. 11, is modelled as a complicated mixture of three different species signals all with distinct t- and T-dependence: p10 (benzyl radical) and fragments of both i1 and p10-I. For 600 K, the agreement at early times is due to fitting the extent of i1 fragmentation to 91 amu. The measurements at later time were not fit, however, and are in excellent agreement with the model, which mostly consists of the p10-I contribution. Even more remarkable is that the model still performs well at 700 K, where nothing was fit, and the contribution of i1 is greatly diminished because of its fast unimolecular isomerization/decomposition at that T. Once again, at later times the model is dominated by p10-I, in accordance with the experiment. The measurements in Fig. 11 and the ability of the model to quantitatively explain them provide strong support for the never-before-seen aromatic-catalyzed 1,2-H-migration proposed in Section 4.1. Without the addition of this pathway to Kislov et al.'s original PES,11 virtually no p10 or p10-I would be predicted, and the long-time 91 amu signal observed experimentally would be unaccounted for.
Both 118 and 119 amu, shown in Fig. 12 and 13, respectively, have large contributions from fragmentation of i1-I. 119 amu in particular is dominated by i1-I in the simulations at both 600 and 700 K, with a negligible contribution from the parent cation of i1. 118 amu exhibits a more diverse mix of simulated species: at 600 K i1-I is the largest contributor to the 118 amu signal, but the phenylpropene isomers p2 and p3 also make a noticeable contribution. At 700 K, the roles are switched: p2 and p3 are dominant over i1-I. This is because i1 is undergoing unimolecular reactions too quickly at higher T to participate in bimolecular recombination with the I atom, and hence the importance of i1-I is diminished at 700 K. It is important to reiterate that the good agreement at 600 K between the model and the experiments at 118 and 119 amu (and 246 amu shown later) is due to fitting of the unknown PICS and fragmentation pattern of i1-I. However, the fact that the same PICS and fragmentation pattern are used in the model at 700 K with satisfactory results gives credibility to the model.
Overall, all five of the primary C6H5 + C3H6 product m/z's are well-described by the model, imparting greater confidence to the predictions of Section 4.1 upon which the model is based, and encouraging the extension of those predictions to analogous systems (Section 4.6). The remainder of this section will compare the model simulations to the MBMS experiments for all of the other transient m/z's.
Fig. 14 compares the I atom and HI at 127 and 128 amu, respectively. The rise time of the 127 amu signal was fit for ksampling, and its absolute value was roughly fit for [I]0. Therefore, the agreement between the modelled and measured I atom at early times is unremarkable. At longer times, however, the simulated decay of the I atom was not fit and generally follows the trend of the measured 127 amu signal, especially considering that the I atom PICS is ∼35% uncertain (Table S3, ESI†). Given the importance of i1 recombination with the I atom at 600 K in explaining many of the observations made at that T, it is reassuring that the absolute I atom signal itself is also described well by the model over the entire measured time range.
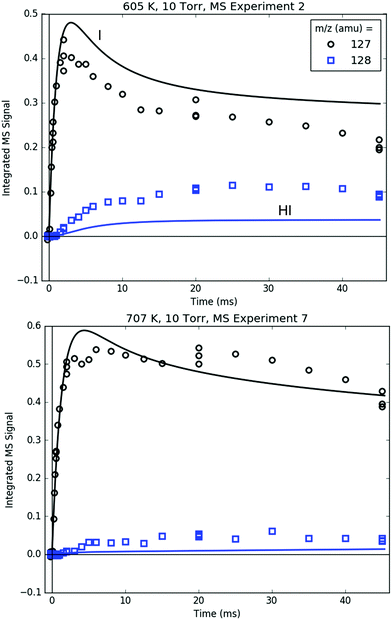 | ||
| Fig. 14 Measured (markers) and modelled (thick lines) 127 (black) and 128 (blue) amu MBMS signals under indicated conditions, which are exclusively attributable to I and HI. | ||
As discussed in Section S1.2 (ESI†), HI is mostly formed through wall catalysis, which was not included in the model. Therefore, HI is underpredicted, especially at 600 K. At 700 K, the wall catalysis effect is reduced, probably because of less adsorption on the wall at higher T,48 but HI is still underpredicted. Nonetheless, matching HI is not critical to the main goals and conclusions of this work, and is not discussed further.
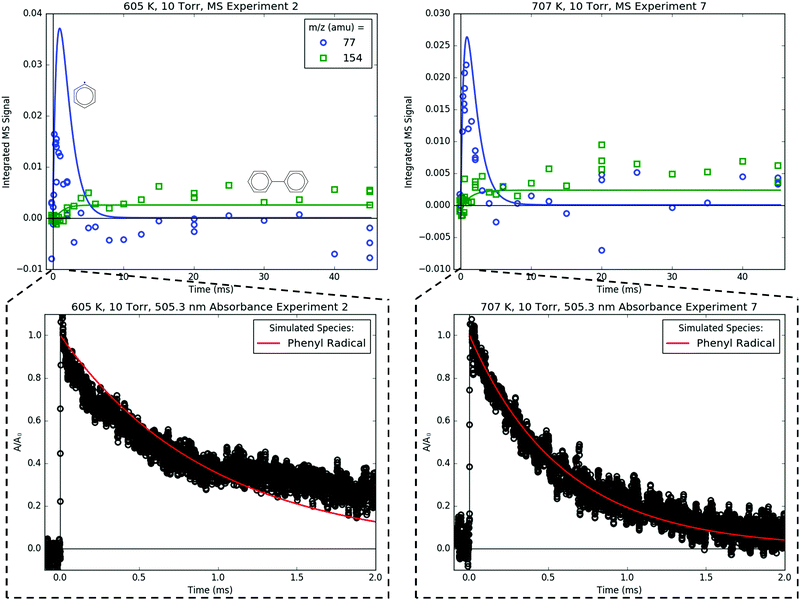
Fig. 15 compares the C6H5 signal measured both by MBMS at 77 amu and by simultaneously recorded 505.3 nm absorbance. As a short-lived species, C6H5 is difficult to resolve with MBMS, an issue that is compounded by the overlap of 77 amu with a fragment of C6H5I, which is present in relatively high concentration. However, the decay of C6H5 was clearly resolved by 505.3 nm absorbance, which is a much faster and non-intrusive detection technique for measuring overall kinetics. The simulated C6H5 decay (without sampling effects, of course) is in good agreement with the 505.3 nm absorbance, which is expected given that the terminal addition rate of C6H5 + C3H6 was previously fit to absorbance measurements in Section 4.2. Fig. 15 and Fig. 9–13 illustrate the complementary nature of laser absorbance coupled with MBMS for kinetic studies: laser absorbance can resolve the time dependence of only one species (or at most a few species if there is spectral overlap that can be deconvoluted) with high t-resolution, whereas MBMS can resolve the time dependence of many species with lower t-resolution. Of course, the t-resolution of the MBMS measurements reported here can and should be improved in the future, but MBMS is unlikely to supplant laser absorbance as the preferred method for overall kinetics quantification for multiple reasons to be discussed in an upcoming publication.17
Biphenyl, C6H5–C6H5, is also measured with MBMS at 154 amu (Fig. 15), and the model is in near-quantitative agreement, especially considering that the PICS of C6H5–C6H5 was estimated by the method of Bobeldijk et al.49 The C6H5 self-recombination rate (C6H5 + C6H5 → C6H5–C6H5) used in the model is also an unadjusted estimate used directly from RMG.
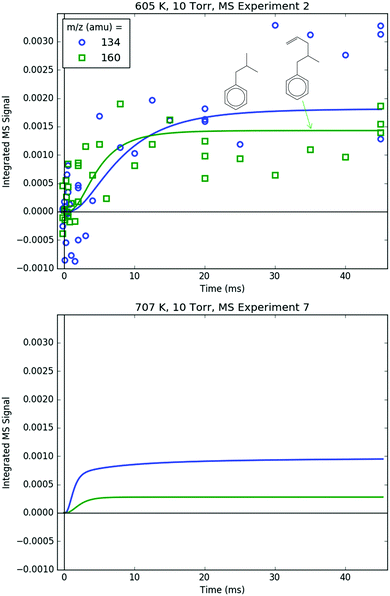
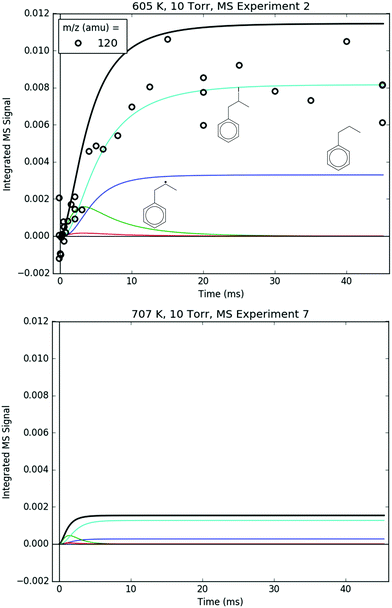
Measured and modelled m/z signals corresponding to the products of i1 bimolecular recombination with the H atom (120 amu), CH3 (134 amu) and C3H5 (160 amu) are shown in Fig. 16 and 17. At 600 K, the signal at m/z = 120 amu is actually mostly attributable to the 13C isotopologues of various 119 amu species/fragments (specifically, the fragment of i1-I), with propylbenzene (from i1 adding an H either by recombination, H-abstraction or disproportionation) contributing ∼1/3 of the total modelled signal. At 700 K, the simulated signal is about an order of magnitude lower, below the detection limit of the MBMS, consistent with the lack of any measurable 120 amu signal. 134 and 160 amu are entirely attributable to the expected species: i1-CH3 and i1-C3H5. At 600 K, the signal is discernible but near the detection limit, and by 700 K the simulated and measured signals have dropped below the detection limit. As mentioned before in a different context, this is because i1 is too short-lived at higher T's to undergo bimolecular reactions (such as recombination with I, CH3 or C3H5). Although not shown, in the model another secondary product of i1 bimolecular reaction, i1-dimer, has a similar predicted signal and T-dependence as the species in Fig. 16. However, no transient signal at the corresponding parent m/z (238 amu) was observed even at 600 K (Fig. 8). Given that the PICS of i1-dimer was estimated as 2× the PICS of propylbenzene (2 × 30 = 60 MB),49 its signal is probably slightly overpredicted, which being so close to the detection limit can make the difference between seeing it and not seeing it experimentally.
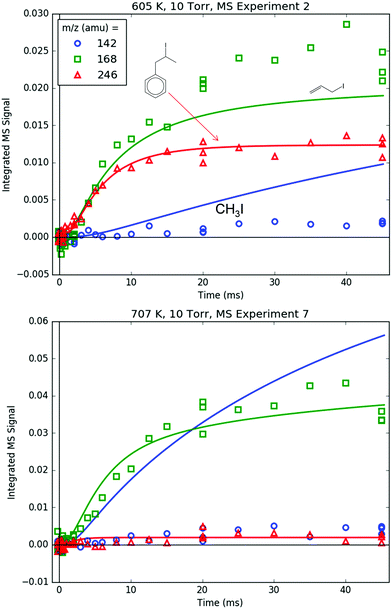
Finally, Fig. 18 shows the parent m/z's of all of the important iodide-containing species: 142 amu for CH3I, 168 amu for C3H5I and 246 amu for i1-I. The parent m/z signal for p10-I at 218 amu is below the detection limit due to its severe (∼10![[thin space (1/6-em)]](https://www.rsc.org/images/entities/char_2009.gif) :
:![[thin space (1/6-em)]](https://www.rsc.org/images/entities/char_2009.gif) 1)50 fragmentation to C7H7+. The modelled C3H5I and i1-I both quantitatively match their respective m/z signal measurements at both T's (keeping in mind that the PICS and fragmentation pattern of i1-I were fit to the 600 K experiments). CH3I, however, is overpredicted, especially at 700 K. As discussed in Section S1.2 (ESI†), this is probably due to fall-off effects, not included in the I atom sub-mechanism, lowering the effective rate of CH3 + I → CH3I at higher T's and lower P's than where the original rate measurement was conducted (400 K, 82 Torr CH3I).51 Although the CH3 + I → CH3I rate could be fit to match the 142 amu MBMS signal, given the uncertainties in the many other CH3 reactions and given that CH3 was not observed with MBMS (discussed in the following paragraph), it was decided that there were too many variables for too little data, and the adjustment of one variable would have no physical significance.
1)50 fragmentation to C7H7+. The modelled C3H5I and i1-I both quantitatively match their respective m/z signal measurements at both T's (keeping in mind that the PICS and fragmentation pattern of i1-I were fit to the 600 K experiments). CH3I, however, is overpredicted, especially at 700 K. As discussed in Section S1.2 (ESI†), this is probably due to fall-off effects, not included in the I atom sub-mechanism, lowering the effective rate of CH3 + I → CH3I at higher T's and lower P's than where the original rate measurement was conducted (400 K, 82 Torr CH3I).51 Although the CH3 + I → CH3I rate could be fit to match the 142 amu MBMS signal, given the uncertainties in the many other CH3 reactions and given that CH3 was not observed with MBMS (discussed in the following paragraph), it was decided that there were too many variables for too little data, and the adjustment of one variable would have no physical significance.
Of equal importance as what was observed is what should have been observed but wasn’t. Specifically, the model predicted significant concentrations of CH3, methane (CH4, from H-abstraction by CH3), C2H4 (co-product of p10), ethane (C2H6, from self-recombination of CH3) and C3H5 (co-product of C6H6 and general product of H-abstraction from C3H6), none of which were observed experimentally by MBMS. There are three explanations for the lack of MBMS signal for these species:
(1) The species ionization energy is >10.5 eV, as in the case of CH4 (12.6 eV52), C2H4 (10.51 eV53) and C2H6 (11.5 eV54).
(2) Although the simulated species concentration is high, once PICS and R(m/z) are taken into account the simulated signal is below the MBMS detection limit, as in the case of CH3 at 600 K (CH3 has a relatively small PICS and as a light species it is disfavoured by R(m/z)).
(3) The time-dependent species signal overlaps with some large time-independent signal, as in the case of CH3 and C3H5, both of which overlap with a large C3H6-fragment.
As the co-product of p1, which is clearly observed as a dominant product at 700 K, CH3 is the most glaringly absent signal in the MBMS. Besides the second and third experimental explanations above, the disparity between modelled and non-existent measured CH3 could certainly be due to the model. Specifically, the model is overpredicting the concentration of CH3 (Fig. S8, ESI†) because, as discussed in Section S1.1 (ESI†), there is no kwall for CH3.
To conclude this lengthy section on quantitatively modelling the MBMS experiments, the intention of building a detailed model following the approach of Fig. 9 was not to “perfectly” match experiments. Given the 100s of parameters in this model including rate coefficients, thermochemical parameters, PICS, ksampling and CI,0, the relatively small experimental data set reported here (15 different conditions) could easily be fit perfectly and automatically. Rather, the goal was to build a model independent of the experiments that could quantitatively explain all of the major observations, using reasonable estimates. The model presented above has achieved this goal, and in the process has provided quantitative support for the predictions of Section 4.1, which can now be confidently extended to other alkylaromatic systems using RMG (Section 4.6).
4.5 Products measured by absorbance
Attempts were also made to quantify product branching by laser absorbance given that at room temperature three of the important radicals in the C6H5 + C3H6 system, C6H5, C3H5 and p10, are known to exhibit distinct visible absorbance features at 504.8,14 408.437 and 447.7 nm,38 respectively (Fig. 19). However, the strength of these features is expected to drop with increasing T due to line-broadening.16 In particular, the peak absorbance cross section for p10 at 447.7 nm is known to sharply decrease by ∼1 order of magnitude when increasing T from 300 to 600 K,55 such that at T ≥ 600 K all three radicals in Fig. 19 will have similar absorbance cross sections of ∼2 × 10⁻¹⁹ cm2.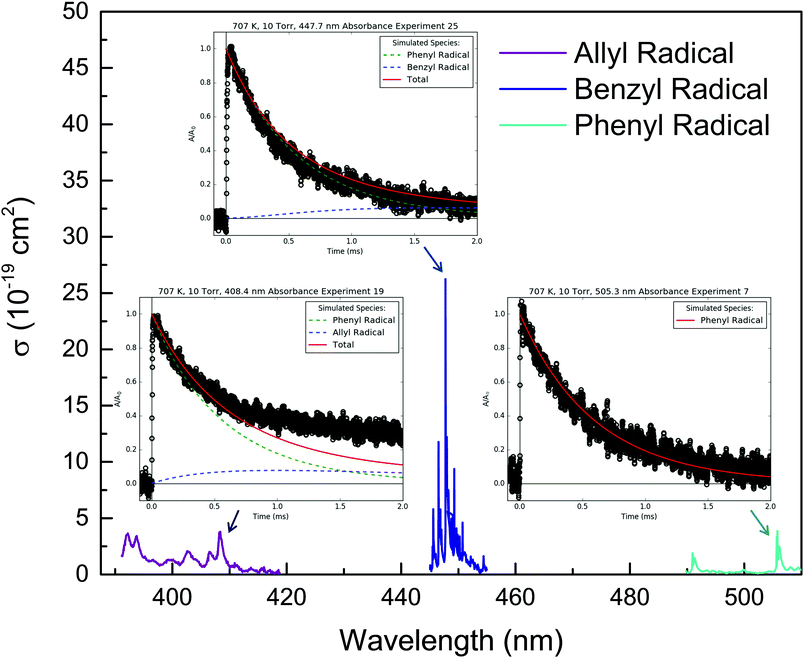 | ||
| Fig. 19 Room temperature visible absorbance spectra measured by Tonokura et al. for allyl,37 benzyl38 and phenyl14 radicals. The insets show representative absorbance traces (markers are measured and lines are modelled) measured in this work at the different wavelengths indicated and otherwise identical conditions (707 K, 10 Torr, [C3H6] = 7.5 × 1015 cm−3). | ||
Table S4 (ESI†) summarizes the conditions of the experiments to probe for products (C3H5 and p10) with laser absorbance. The experiment #'s are a continuation of those for the MBMS experiments. Experiments #2–4, 16–18 and 22–24 were conducted under nearly identical conditions (nominally 600 K, 10 Torr and a range of [C3H6], the radical concentration was slightly higher for the product probing experiments) but the probe laser wavelength was varied from 505.3, 404.8 and 447.7 nm, respectively. A similar procedure was followed for experiments #7–9, 19–21 and 25–27, which were conducted at 700 K and 10 Torr.
The insets of Fig. 19 compare the 700 K background-subtracted and normalized absorbance measurements at the three probe wavelengths. All of the other absorbance traces are shown in Table S5 (ESI†). As already discussed (Section 4.2) 505.3 nm absorbance of C6H5 typically returns to the baseline within ±10% due to noise and imperfect background subtraction (Table 2). C6H5 continues to contribute substantially to the absorbance at the lower wavelengths as well, similar to previous measurements of its UV-visible spectrum.56 At 447.7 nm, the absorbance also essentially returns to the baseline, but at 408.4 nm there is a clear, reproducible baseline-shift of ∼30%, which exceeds the typical baseline shift fluctuations of ±10%. Similar results were obtained at 600 K (no reliable baseline shift at 505.3 and 447.7 nm, and a possible baseline shift of ∼10% at 408.4 nm). Once again, the model of Section 4.4 was used to gain quantitative insight into what is happening.
The normalized absorbance traces at 408.4 and 447.7 nm were modelled as weighted sums of the simulated C6H5 and product concentration profiles in the reactor (unsampled):
| A/A0 = CC6H5/CC6H5,0 + αCproduct/CC6H5,0 | (4) |
The model results are shown as thick red lines in the insets of Fig. 19, where the individual contributions of CC6H5 and Cproduct are also shown as dashed lines. Although the model is in good quantitative agreement with the 447.7 and 505.3 nm measurements, at 408.4 nm the baseline shift in the model is only ∼10% compared to ∼30% measured experimentally. However, it was found that the predicted C3H5 yield (and the modelled baseline shift at 408.4 nm) was sensitive to the C3H5 + I → C3H5I rate coefficient. If this reaction was entirely removed, the C3H5 yield approximately doubled at short times, and the modelled 408.4 nm baseline shift increased to around 20% (Fig. S37, ESI†), which is in reasonable agreement with the 30% measured experimentally considering the 10% baseline fluctuations regularly observed. Of course, C3H5 + I recombination is occurring, because C3H5I was observed as an MBMS product. Perhaps C3H5 and I are recombining on the walls close to where MBMS sampling occurs, whereas in the gas-phase where C3H5 is probed by absorbance, little recombination occurs due to the pressure dependence of the reaction (which is not included in the model).
A different explanation for the poorly modelled 408.4 nm baseline shift is absorbance by something else entirely, especially given the relatively short wavelength. In any case, MBMS detection of stable products (C6H6 in the case of C6H5 + C3H6 H-abstraction) is a much preferred method for quantifying product branching over trying to probe for one radical product with laser absorbance in a “soup” of different radicals that might also absorb. It was demonstrated in the previous section that the model developed in this work could quantitatively explain all of the major product MBMS signals, including C6H6. The inability of the same model to quantitatively match all of the absorbance experiments should not detract from it significantly, especially considering the complications involved in quantitative absorbance measurements mentioned above.
4.6 Generalizing aromatic-catalyzed 1,2-hydrogen-migration to other alkylaromatic systems using RMG
The aromatic-catalyzed 1,2-H-migration proposed in Section 4.1 and experimentally supported in Section 4.4 is not limited to the C6H5 + C3H6 system but will apply to any arbitrary alkylaromatic radical system with at least three carbons in a linear chain and at least one H in an ortho-position. RMG, and other automatic mechanism generators like it, provides a convenient tool for generalizing new chemistry findings, such as the aromatic-catalyzed 1,2-H-migration, and exploring their implications for more complicated systems. In this case, the slightly more complicated alkylaromatic system considered is 1-naphthyl radical + 2-butene, 1-C10H7 + 2-C4H8, the radical addition product for which is shown and labelled in Scheme 4. This particular system was chosen because both the number of aromatic rings and the length of the side chain have increased by one compared to C6H5 + C3H6. As will be shown, even these modest modifications to the original C6H5 + C3H6 framework will have consequential effects on the possible chemistry.As already discussed in Section 3 and Section S1.1 (ESI†), RMG was “taught” the aromatic-catalyzed 1,2-H-migration (and alkylaromatic chemistry more generally) using training reactions. Scheme 3 shows the “aromatic-catalyzed pathways” found by RMG and included in the final, converged mechanism for 1-C10H7 + 2-C4H8 at 600 K and 1 atm. Following aromatic-catalyzed 1,2-H-migration, the radical formed was actually predicted to react in two main ways: β-scission of C2H4 to form an RSR directly (analogous to p10 + C2H4 formation in C6H5 + C3H6, right branch of Scheme 3) or a 1,3-phenyl shift and then β-scission of C3H6 to form another RSR (left branch). Both RSRs are then predicted to recombine with CH3 at various sites, although the extent of these reactions is overestimated by RMG as they were for CH3 + p10 recombination (Scheme S1, ESI†).
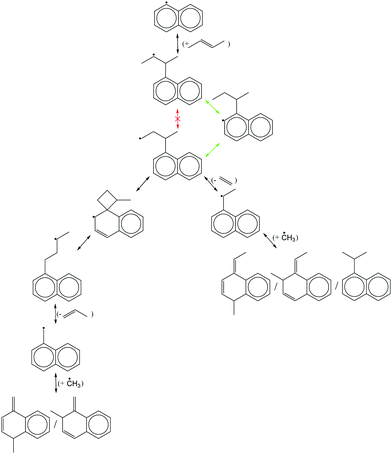 | ||
| Scheme 3 Aromatic-catalyzed 1,2-hydrogen-migration (green arrows) for 1-naphthyl radical + 2-butene and subsequent RMG-predicted pathways. | ||
From Scheme 3 alone it can already be seen that simply adding one more carbon to the alkyl chain of i1 opens up new chemistry (left branch). However, there are two more novel applications of the “aromatic-catalyzed” concept to the 1-C10H7 + 2-C4H8 system that were not found by RMG. In the first, rather than the ortho-carbon (labelled 2 in Scheme 4) serving as the “active site” in the aromatic catalyst (source and sink of H), carbon 9 could instead function as the active site. In fact, carbon 9 is probably a better active site than carbon 2 because in the rate-limiting step of the aromatic-catalyzed 1,2-H-migration carbon 2 loses its H in a 5-membered-ring TS (Fig. 1 and 3) whereas carbon 9 would form a more favourable 6-membered-ring TS. In the second application, carbon 2 could still be the active site, but instead of abstracting an H back from carbon 11 in the second step, as in Scheme 3, it could abstract an H from carbon 14. In this case, the net effect would be a 1,3-H-migration. The fact that RMG was unable to extrapolate the aromatic-catalyzed 1,2-H-migration, on which it was trained, to a different active site or to a 1,3-H-migration (or to a combination of both: a 1–3-H-migration using carbon 9 as the active site) points to areas of future work.
Fig. 20 shows RMG's quantitative predictions of the product branching for 1-C10H7 + 2-C4H8 at 600 K and 1 atm. Just as in the case of C6H5 + C3H6, the major products are from H-abstraction (red line) and radical addition followed by CH3 loss (black) or H loss (magenta and green). All of the “aromatic-catalyzed products” each have a yield of less than 1%, and in total they only account for ∼4% of the product branching. However, if RMG had found the other three aromatic-catalyzed reactions described in the previous paragraph the branching would be higher. Nonetheless, the general applicability of aromatic-catalyzed reactions has been demonstrated and applied to the example 1-C10H7 + 2-C4H8 system using RMG. Given the staggering number of different alkylaromatic structures that would be encountered in a real application (e.g., gasoline, kerogen), a tool like RMG is needed to extrapolate findings made for model systems (e.g., aromatic-catalyzed 1,2-H-migration in C6H5 + C3H6) to all possible analogous systems, even if the extrapolation is currently unsophisticated.
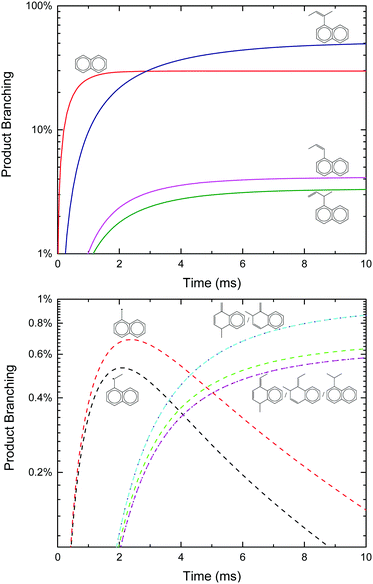 | ||
| Fig. 20 Major (top) and aromatic-catalyzed (bottom) products of 1-naphthyl radical + 2-butene predicted by RMG. | ||
5. Conclusions
By applying a different experimental approach (flash photolysis with time-resolved MBMS) to a chemical system that has already been studied extensively both experimentally and computationally (C6H5 + C3H6), several new insights were made.First, and most importantly, a previously unreported aromatic-catalyzed 1,2-H-migration was proposed to explain unexpected benzyl radical formation observed experimentally from C6H5 + C3H6. Quantum calculations of the energetics and RRKM/ME calculations of the kinetics for the new pathway were both favourable, predicting up to ∼10% and ∼15% product branching to the benzyl radical under thermal and single collision conditions, respectively. In order to gain further confidence in these predictions, a detailed model for the flash photolysis/MBMS experiment was developed that includes both hydrocarbon and iodine chemistry, as well a simple empirical model for transport. The model could quantitatively explain the complicated time- and temperature-dependence of the unexpected product (as well as the other four primary product m/z's) observed experimentally, providing strong support for the aromatic-catalyzed pathway as the main route to the benzyl radical (and resonance stabilized radicals more generally).
Second, the extent of H-abstraction from C6H5 + C3H6 was quantified experimentally for the first time, using MBMS detection of the stable product (C6H6), and was found to be in good agreement with the model described above (and the theoretical calculations upon which the chemistry portion of the model relies). Attempts to quantify H-abstraction by probing for the radical product (C3H5) with laser absorbance were less quantitatively successful, however, either due to poorly understood secondary chemistry involving the I atom or due to spectral overlap of other radicals at the relatively short wavelength used (408.4 nm).
Finally, the competition between CH3-loss and H-loss following radical addition of C6H5 + C3H6 was quantified experimentally and matched by the model. Under the conditions of these experiments (600 and 700 K) CH3-loss was dominant.
The only outstanding discrepancy in the C6H5 + C3H6 literature that this work did not address experimentally was the isomeric identity of the H-loss product. However, trapping of the effluent of the flash photolysis reactor followed by GC/MS detection of the stable C6H5 + C3H6 products might be a practical approach to addressing this issue in the future.
Given that the current theoretical understanding of C6H5 + C3H6 was sufficient to quantitatively explain the many experimental results of this work, this knowledge was “taught” to RMG using the language of training reactions. The ability of RMG to apply this knowledge to a slightly more complicated alkylaromatic system, 1-C10H7 + 2-C4H8, was demonstrated, although areas for improvement were clearly identified. Specifically, RMG only applied the aromatic-catalyzed concept narrowly to the kind of 1,2-H-migration seen in the C6H5 + C3H6 system, instead of applying it more broadly to 1,3-H-migrations with different “active-sites” of the aromatic catalyst. Despite these shortcomings, RMG and similar automated tools are currently the best options for extrapolating detailed chemistry insights, such as the ones made in this work, to real applications. Hopefully the overall framework presented here for translating fundamental experimental and theoretical insights into broader applications using RMG will serve as a guide for future fruitful work. For example, experiments with naphthyl radicals or butene isomers would be a logical extension of this work.
Conflicts of interest
There are no conflicts to declare.Acknowledgements
This research was supported by SABIC and used resources of the National Energy Research Scientific Computing Center, a DOE Office of Science User Facility supported by the Office of Science of the U.S. Department of Energy under Contract No. DE-AC02-05CH11231. T.-C. C. received funding from Think Global Education Trust. Professor Guozhu Liu provided the inspiration for this work and Mengjie (Max) Liu both laid the necessary groundwork for aromatic chemistry in RMG and provided critical support.Notes and references
- A. M. Mebel, Y. Georgievskii, A. W. Jasper and S. J. Klippenstein, Faraday Discuss., 2016, 195, 637–670 RSC.
- W. Yuan, Y. Li, P. Dagaut, Y. Wang, Z. Wang and F. Qi, Combust. Flame, 2017, 186, 178–192 CrossRef CAS.
- J. Hansen and L. Nazarenko, Proc. Natl. Acad. Sci. U. S. A., 2004, 101, 423–428 CrossRef CAS PubMed.
- D. W. Dockery, C. A. Pope, X. Xu, J. D. Spengler, J. H. Ware, M. E. Fay, B. G. Ferris and F. E. Speizer, N. Engl. J. Med., 1993, 329, 1753–1759 CrossRef CAS PubMed.
- C. Xu, A. S. Al Shoaibi, C. Wang, H.-H. Carstensen and A. M. Dean, J. Phys. Chem. A, 2011, 115, 10470–10490 CrossRef CAS PubMed.
- H. J. Hefter, T. A. Hecht and G. S. Hammond, J. Am. Chem. Soc., 1972, 94, 2793–2797 CrossRef CAS.
- J. Park, G. J. Nam, I. V. Tokmakov and M. C. Lin, J. Phys. Chem. A, 2006, 110, 8729–8735 CrossRef CAS PubMed.
- F. Zhang, X. Gu, Y. Guo and R. I. Kaiser, J. Phys. Chem. A, 2008, 112, 3284–3290 CrossRef CAS PubMed.
- R. I. Kaiser, D. S. N. Parker, M. Goswami, F. Zhang, V. V. Kislov, A. M. Mebel, J. Aguilera-Iparraguirre and W. H. Green, Phys. Chem. Chem. Phys., 2012, 14, 720–729 RSC.
- F. Zhang, R. I. Kaiser, A. Golan, M. Ahmed and N. Hansen, J. Phys. Chem. A, 2012, 116, 3541–3546 CrossRef CAS PubMed.
- V. V. Kislov, A. M. Mebel, J. Aguilera-Iparraguirre and W. H. Green, J. Phys. Chem. A, 2012, 116, 4176–4191 CrossRef CAS PubMed.
- D. R. Albert, M. A. Todt and H. F. Davis, J. Phys. Chem. A, 2013, 117, 13967–13975 CrossRef CAS PubMed.
- Z. Wang, L. Zhang and F. Zhang, J. Phys. Chem. A, 2014, 118, 6741–6748 CrossRef CAS PubMed.
- K. Tonokura, Y. Norikane, M. Koshi, Y. Nakano, S. Nakamichi, M. Goto, S. Hashimoto, M. Kawasaki, M. P. Sulbaek Andersen, M. D. Hurley and T. J. Wallington, J. Phys. Chem. A, 2002, 106, 5908–5917 CrossRef CAS.
- J. E. Middaugh, PhD thesis, Massachusetts Institute of Technology, 2014.
- Z. J. Buras, E. E. Dames, S. S. Merchant, G. Liu, R. M. I. Elsamra and W. H. Green, J. Phys. Chem. A, 2015, 119, 7325–7338 CrossRef CAS PubMed.
- J. E. Middaugh, Z. J. Buras, M. Matrat, T.-C. Chu, Y.-S. Kim, I. M. Alecu, A. K. Vasiliou, C. F. Goldsmith and W. H. Green Jr, Rev. Sci. Instrum. Search PubMed , under review.
- J. R. Wyatt, J. J. Decorpo, M. V. McDowell and F. E. Saalfeld, Int. J. Mass Spectrom. Ion Phys., 1975, 16, 33–38 CrossRef CAS.
- K. Tonokura, N. Kanno, Y. Yamamoto and H. Yamada, Int. J. Mass Spectrom., 2010, 290, 9–13 CrossRef CAS.
- H. Ismail, C. F. Goldsmith, P. R. Abel, P.-T. Howe, A. Fahr, J. B. Halpern, L. E. Jusinski, Y. Georgievskii, C. A. Taatjes and W. H. Green, J. Phys. Chem. A, 2007, 111, 6843–6851 CrossRef CAS PubMed.
- Z. J. Buras, R. M. I. Elsamra, A. Jalan, J. E. Middaugh and W. H. Green, J. Phys. Chem. A, 2014, 118, 1997–2006 CrossRef CAS PubMed.
- L. N. Krasnoperov, J. T. Niiranen, D. Gutman, C. F. Melius and M. D. Allendorf, J. Phys. Chem., 1995, 99, 14347–14358 CrossRef CAS.
- A. G. Sage, T. A. A. Oliver, D. Murdock, M. B. Crow, G. A. D. Ritchie, J. N. Harvey and M. N. R. Ashfold, Phys. Chem. Chem. Phys., 2011, 13, 8075–8093 RSC.
- C.-M. Tseng, Y. M. Choi, C.-L. Huang, C.-K. Ni, Y. T. Lee and M. C. Lin, J. Phys. Chem. A, 2004, 108, 7928–7935 CrossRef CAS.
- T. Yu and M. C. Lin, J. Am. Chem. Soc., 1994, 116, 9571–9576 CrossRef CAS.
- S. S. Kumaran, M. C. Su and J. V. Michael, Chem. Phys. Lett., 1997, 269, 99–106 CrossRef CAS.
- NIST, Precomputed vibrational scaling factors, http://cccbdb.nist.gov/vibscalejust.asp.
- A. M. Mebel, A. Landera and R. I. Kaiser, J. Phys. Chem. A, 2017, 121, 901–926 CrossRef CAS PubMed.
- M. J. Frisch, G. W. Trucks, H. B. Schlegel, G. E. Scuseria, M. A. Robb, J. R. Cheeseman, J. A. Montgomery, T. Vreven, K. N. Kudin, J. C. Burant, J. M. Millam, S. S. Iyengar, J. Tomasi, V. Barone, B. Mennucci, M. Cossi, G. Scalmani, N. Rega, G. A. Petersson, H. Nakatsuji, M. Hada, M. Ehara, K. Toyota, R. Fukuda, J. Hasegawa, M. Ishida, T. Nakajima, Y. Honda, O. Kitao, H. Nakai, M. Klene, X. Li, J. E. Knox, H. P. Hratchian, J. B. Cross, V. Bakken, C. Adamo, J. Jaramillo, R. Gomperts, R. E. Stratmann, O. Yazyev, A. J. Austin, R. Cammi, C. Pomelli, J. W. Ochterski, P. Y. Ayala, K. Morokuma, G. A. Voth, P. Salvador, J. J. Dannenberg, V. G. Zakrzewski, S. Dapprich, A. D. Daniels, M. C. Strain, O. Farkas, D. K. Malick, A. D. Rabuck, K. Raghavachari, J. B. Foresman, J. V. Ortiz, Q. Cui, A. G. Baboul, S. Clifford, J. Cioslowski, B. B. Stefanov, G. Liu, A. Liashenko, P. Piskorz, I. Komaromi, R. L. Martin, D. J. Fox, T. Keith, A. Laham, C. Y. Peng, A. Nanayakkara, M. Challacombe, P. M. W. Gill, B. Johnson, W. Chen, M. W. Wong, C. Gonzalez and J. A. Pople, Gaussian 03, Revision D.01, 2003 Search PubMed.
- H.-J. Werner, P. J. Knowles, G. Knizia, F. R. Manby and M. Schütz, Wiley Interdiscip. Rev.: Comput. Mol. Sci., 2012, 2, 242–253 CrossRef CAS.
- C. W. Gao, J. W. Allen, W. H. Green and R. H. West, Comput. Phys. Commun., 2016, 203, 212–225 CrossRef CAS.
- C. Eckart, Phys. Rev., 1930, 35, 1303–1309 CrossRef CAS.
- J. W. Allen, C. F. Goldsmith and W. H. Green, Phys. Chem. Chem. Phys., 2012, 14, 1131–1155 RSC.
- A. W. Jasper, C. M. Oana and J. A. Miller, Proc. Combust. Inst., 2015, 35, 197–204 CrossRef CAS.
- CHEMKIN software is distributed by ANSYS, 2013.
- C. Yan, S. Kocevska and L. N. Krasnoperov, J. Phys. Chem. A, 2016, 120, 6111–6121 CrossRef CAS PubMed.
- K. Tonokura and M. Koshi, J. Phys. Chem. A, 2000, 104, 8456–8461 CrossRef CAS.
- K. Tonokura and M. Koshi, J. Phys. Chem. A, 2003, 107, 4457–4461 CrossRef CAS.
- C. L. Yaws, Yaws' Critical Property Data for Chemical Engineers and Chemists, http://app.knovel.com/hotlink/toc/id:kpYCPDCECD/yaws-critical-property/yaws-critical-property.
- G. M. Bradley and H. L. Strauss, J. Phys. Chem., 1975, 79, 1953–1957 CrossRef CAS.
- H. Ismail, P. R. Abel, W. H. Green, A. Fahr, L. E. Jusinski, A. M. Knepp, J. Zádor, G. Meloni, T. M. Selby, D. L. Osborn and C. A. Taatjes, J. Phys. Chem. A, 2009, 113, 1278–1286 CrossRef CAS PubMed.
- Z. J. Buras, R. M. I. Elsamra and W. H. Green, J. Phys. Chem. Lett., 2014, 5, 2224–2228 CrossRef CAS PubMed.
- M. D. Morse, in Experimental Methods in the Physical Sciences, ed. F. B. Dunning and R. G. Hulet, Academic Press, 1996, vol. 29, pp. 21–47 Search PubMed.
- A. Comandini, T. Malewicki and K. Brezinsky, J. Phys. Chem. A, 2012, 116, 2409–2434 CrossRef CAS PubMed.
- R. S. Tranter, S. J. Klippenstein, L. B. Harding, B. R. Giri, X. Yang and J. H. Kiefer, J. Phys. Chem. A, 2010, 114, 8240–8261 CrossRef CAS PubMed.
- M. T. Baeza-Romero, M. A. Blitz, A. Goddard and P. W. Seakins, Int. J. Chem. Kinet., 2012, 44, 532–545 CrossRef CAS.
- S. J. Blanksby and G. B. Ellison, Acc. Chem. Res., 2003, 36, 255–263 CrossRef CAS PubMed.
- G. P. Kota, J. W. Coburn and D. B. Graves, J. Vac. Sci. Technol., A, 1999, 17, 282–290 CAS.
- M. Bobeldijk, W. J. van der Zande and P. G. Kistemaker, Chem. Phys., 1994, 179, 125–130 CrossRef CAS.
- J. C. Traeger and B. M. Kompe, Int. J. Mass Spectrom. Ion Processes, 1990, 101, 111–120 CrossRef CAS.
- S. Mulenko, Rev. Roum. Phys., 1987, 32, 173 CAS.
- J. Berkowitz, J. P. Greene, H. Cho and B. Ruscić, J. Chem. Phys., 1987, 86, 674–676 CrossRef CAS.
- B. A. Williams and T. A. Cool, J. Chem. Phys., 1991, 94, 6358–6366 CrossRef CAS.
- Y.-R. Luo and P. D. Pacey, Int. J. Mass Spectrom. Ion Processes, 1992, 112, 63–77 CrossRef CAS.
- A. Matsugi and A. Miyoshi, Chem. Phys. Lett., 2012, 521, 26–30 CrossRef CAS.
- T. J. Wallington, H. Egsgaard, O. J. Nielsen, J. Platz, J. Sehested and T. Stein, Chem. Phys. Lett., 1998, 290, 363–370 CrossRef CAS.
Footnote |
| † Electronic supplementary information (ESI) available: Details of the model for flash photolysis with MBMS. Experimental procedure and results for measuring p2 PICS. Measured fragmentation patterns of C3H5I and i1-Br. Measured MBMS time profiles of all transient m/z's under all 15 experimental conditions. All measured 408.4 and 447.7 nm absorbance profiles for probing products. TST-calculated rate coefficients on C9H11 PES in the CHEMKIN format. G3(MP2,CC)//B3LYP calculated molecular parameters of all C9H11 species. Input file, CHEMKIN mechanism and dictionary of species structures in a human readable format for the RMG HC mechanism. See DOI: 10.1039/c8cp01159a |
| This journal is © the Owner Societies 2018 |

