 Open Access Article
Creative Commons Attribution 3.0 Unported Licence
Comparing ammonia diffusion in NH3-SCR zeolite catalysts: a quasielastic neutron scattering and molecular dynamics simulation study
A. J.
O'Malley
 *ab,
M.
Sarwar
c,
J.
Armstrong
 d,
C. R. A.
Catlow
abe,
I. P.
Silverwood
 bd,
A. P. E.
York
c and
I.
Hitchcock
*c
aCardiff Catalysis Institute, School of Chemistry, Cardiff University, Main Building, Park Place, Cardiff, CF10 3AT, UK. E-mail: omalleya@cardiff.ac.uk
bUK Catalysis Hub, Research Complex at Harwell, Rutherford Appleton Laboratory, Harwell Oxford, Didcot, Oxfordshire OX11 0FA, UK
cJohnson Matthey Technology Centre, Blounts Court, Sonning Common, Reading RG4 9NH, UK. E-mail: iain.hitchcock@matthey.com
dISIS Facility, STFC Rutherford Appleton Laboratory, Didcot, Oxon OX11 0QX, UK
eUniversity College London, Department of Chemistry, Materials Chemistry, Third Floor, Kathleen Lonsdale Building, Gower Street, London WC1E 6BT, UK
First published on 29th March 2018
Abstract
The diffusion of ammonia in the small pore zeolite and potential commercial NH3-SCR catalyst levynite (LEV) was measured and compared with its mobility in the chabazite (CHA) topology (more established in NOx abatement catalysis), using quasielastic neutron scattering (QENS) and molecular dynamics (MD) simulations at 273, 323 and 373 K. The QENS experiments suggest that mobility in LEV is dominated by jump diffusion through the 8-ring windows between cages (as previously observed in CHA) which takes place at very similar rates in the two zeolites, yielding similar experimental self-diffusion coefficients (Ds). After confirming that the same characteristic motions are observed between the MD simulations and the QENS experiments on the picosecond scale, the simulations suggest that on the nanoscale, the diffusivity is higher by a factor of ∼2 in the CHA framework than in LEV. This difference between zeolites is primarily explained by the CHA cages having six 8-ring windows in the building unit, compared to only three such windows in the LEV cage building unit, thereby doubling the geometric opportunities to perform jump diffusion between cages (as characterised by the QENS experiments) leading to the corresponding increase in the MD calculated Ds. The techniques illustrate the importance of probing both pico- and nanoscale dynamics when studying intracrystalline diffusion in both NH3-SCR catalyst design, and in porous materials generally, where notable consistencies and differences may be found on either scale.
1. Introduction
The catalytic reduction of NOx compounds is a well-established NOx abatement technology in combustion engines, where the selective catalytic reduction with ammonia (NH3-SCR) process in small pore metal exchanged zeolites is currently the leading technology for reducing emissions from oxygen rich diesel engines.1–3Metal exchanged chabazite (CHA) zeolites such as Cu-SSZ-13 exhibit very high N2 selectivity and are highly thermally stable, so are more suited to the harsh vehicle environments when compared to, for example, zeolites ZSM-5 and Beta;4 hence their development in industry for NOx abatement in diesel powered vehicles.5–7 The CHA structure pores are 3.8 Å in diameter built from eight-membered rings,8 and Cu-SSZ-13 in particular has high thermal stability, good N2 selectivity, low N2O formation and high hydrocarbon tolerance. The high thermal stability was attributed to the density of the framework structure, and also originally to the cation location just outside the six-membered rings.9,10 However, it has been shown that on adsorption and interaction with gases, the ion is then pulled into the chabazite cages with an increase in its mobility.11 Optimising NOx abatement catalyst formulation and performance involves an understanding of the active site, mechanism and the reaction kinetics, and also of the diffusion of molecules in the porous catalyst structure.
While the CHA structure is by far the most studied of the 8-ring zeolite topologies for NH3-SCR, other 8-ring structures such as levynite (LEV) and DDR zeolites12 are also of interest, illustrated by recent patents on levyne zeolites for this application.13,14 The LEV topology has the 8-rings in a 2-dimensional arrangement, compared to the 3-dimensional arrangement of CHA zeolites. It is therefore expected that characteristics such as active species mobility (crucial in catalyst design and optimisation) would be affected by this difference in framework dimensionality. Indeed, the lower NOx conversion after hydrothermal treatment in 2-dimensional small pore zeolites is considered to be due to a combination of sorbate diffusion constraints and lower Cu loading achieved through ion exchange.12
While the interaction of the ammonia reductant with the active sites in CHA catalysts has been studied,11,15–18 microscopic diffusive behaviour in these systems had not been investigated until our recent measurements of NH3 diffusion in commercially available H-CHA and Cu-CHA zeolite catalysts using quasielastic neutron scattering (QENS) and molecular dynamics (MD) simulations.19 Indeed, neutron spectroscopic techniques are a growing tool in catalytic science20 and may reveal much about molecule/active site interactions as illustrated by the significant insight obtained into the nanoscale behaviour of ammonia, and its mobility in CHA catalysts as a function of Cu2+ counterion presence. The experiment suggested the presence of Cu2+ had no effect on NH3 mobility on the timescale of the experiment, which was explained through simulation, via the observation of clustering of the NH3 around the counterion, shielding other NH3 molecules from any interaction and thus allowing their unimpeded intercage movement. A similar phenomenon was previously observed for ammonia in silicalite using QENS and PFG-NMR, where an increase in diffusivity was observed with loading due to the blocking of silanol defect adsorption sites, allowing the overall mobility to rise.21
To our knowledge, there are no studies of the nanoscale mobility of active SCR species in other potential catalysts based on small pore zeolites. The combined use of QENS and MD simulations has proved to be very elucidative in studying dynamical behaviour in a number of zeolite systems,22–28 particularly as more accurate contemporary classical models of the framework and sorbates are now able to calculate diffusion coefficients and activation energies which are much closer to experiment.29,30 Given the detailed insight our combined QENS and MD studies gave into both the mobility, and the sorbate-framework interactions of reactive species in chabazite, we have used this combination of techniques to study NH3 mobility in small pore zeolite levynite (LEV), where recent patents13,14 indicate the commercial interest in pursuing other small pore topologies for NH3-SCR catalysis. As noted, LEV contains 8-ring channels similar to CHA, but the channel system has a 2-dimensional topology compared to the 3-dimensional CHA topology. We therefore use this powerful combination of QENS and MD to probe potential diffusivity differences on the pico- and nano time scales between LEV and the more established CHA NH3-SCR catalyst. We find that on a local, molecular scale, the mobility behaviour is very similar between the CHA and LEV topologies. On the nanoscale, however, the different framework structure has a marked effect on the overall diffusivity of NH3.
2. Experimental
The material studied in this work was a commercially available H-LEV zeolite provided by Johnson Matthey, Si/Al = 34. Samples were in powder form and microporous only, as determined by nitrogen gas adsorption at 77 K.2.1 QENS experiments
The H-LEV samples were placed in a stainless steel can and heated to 300 °C overnight at vacuum to remove any pre-adsorbed water. After cooling, the can was transferred to a glovebox under an argon atmosphere. The dry sample (4.1 grams in total) was transferred to a thin walled aluminium container of annular geometry. The aluminium cell was then connected to a gas inlet system, which allowed ammonia to be adsorbed onto the zeolite. The cell pressure was raised to 800 mbar to ensure the zeolite was saturated with ammonia, in order to directly compare with our previous CHA experiments in terms of loading.All measurements were performed using the time-of-flight backscattering neutron spectrometer OSIRIS31 at the ISIS Pulsed Neutron and Muon Source, Rutherford Appleton Laboratory, Oxfordshire. Pyrolytic graphite 002 analyser crystals were used to give an energy resolution of 24.5 μeV at full width at half maximum with energy transfers measured in a window of ±0.55 meV; the detectors covered measurements over a Q range of 0.2–1.7 Å−1. The measurement was taken of an empty zeolite sample and the signal was then subtracted from the signal of the loaded zeolite, so that only the signal from the ammonia could be extracted. In this way any scattering from the aluminium container, which is very low in comparison with the empty zeolite is also subtracted. No further corrections were necessary.
The QENS experiments were performed at 273, 323 and 373 K. The elastic resolution function was measured with a vanadium foil sample. All data were analysed using a combination of Mantid32 and DAVE softwares.33 A detailed discussion of the QENS method and its applicability to deriving dynamical characteristics of sorbates in zeolites can be found in the following ref. 24 and 34.
2.2 Molecular dynamics simulations
Molecular dynamics simulations were performed using Forcite as implemented in Materials Studio 8.0.35 The simulations were run at 273 K, 323 K and 373 K to provide direct comparison with the QENS measurements. The coordinates of the LEV structure were obtained from the IZA database.36 A 2 × 2 × 1 supercell containing 648 atoms with optimised lattice parameters of 26.47 × 26.45 × 22.65 Å was created and periodic boundary conditions were used. The Si atoms in the 8-rings were randomly substituted with Al atoms to give a Si/Al ratio of 17, consistent with our MD simulations of CHA in ref. 19. Charge compensation was achieved by adding protons to the O atoms adjacent to the Al atoms, with the acidic protons oriented pointing into the 8-ring of the LEV cage. Before the simulation, the NH3 molecules and framework structures were optimised using the COMPASS force field37 which represented the intra- and intermolecular forces throughout.In order to provide a direct comparison with our previous study of NH3 mobility in CHA, a loading of 90 NH3 molecules were loaded into the supercell using a Monte Carlo docking algorithm as implemented in the Sorption module in Materials Studio.35 These structures were then re-optimised and subjected to a simulated annealing procedure to ensure a low energy starting structure. Periodic boundary conditions were used throughout and the electrostatic interactions were calculated using an Ewald summation with an 11 Å cut-off; The zeolite framework was fully flexible in the simulations. The system was then equilibrated for 200 ps using a 1 fs time step, after which no statistically meaningful variation in energy was observed. Production runs were then started from these equilibrated systems and run for 5 ns, again using a timestep of 1 fs. The NVT ensemble, with a Nosé thermostat, was used throughout. The trajectory of the N atom was recorded every 250 steps during the course of the simulation. The calculations were run on a Dell Optiplex 7010 parallelised over 4 processors at Johnson Matthey Technology Centre, UK.
The mean squared displacements (MSD) obtained were evaluated for each temperature via the standard equation:
The diffusion coefficients were obtained by fitting the MSD against time in the region 0–500 ps and assuming the Einstein relation below, (where the variation of log MSD vs. log![[thin space (1/6-em)]](https://www.rsc.org/images/entities/char_2009.gif) t has a slope of 1 indicating diffusive behaviour):
t has a slope of 1 indicating diffusive behaviour):
| MSD(t) = A + 6Dt |
Activation energies for self-diffusion were then obtained from an Arrhenius plot.
In our previous study of NH3 mobility in chabazite (ref. 19), the MD simulations were equilibrated for 200 ps production run of 1 ns. To enable direct comparison of ammonia mobility between the CHA and LEV frameworks, the simulations were run again for 5 ns in CHA using the parameters outlined in ref. 19, and subjected to the same analysis outlined in the above paragraphs.
The trajectories of the MD simulations were used to calculate the dynamic structure factor S(Q,ω) of the NH3 protons using the MDANSE program38 using a discrete spherical Q grid ranging from 0.3 to 1.7 Å−1 with bin widths of 0.1 Å−1. A fitted Gaussian of width 24.5 μeV was used as the instrumental resolution function, and was convoluted with the S(Q,ω) to allow a direct comparison between simulation and experiment.
3. Results and discussion
3.1 Quasielastic neutron scattering experiments
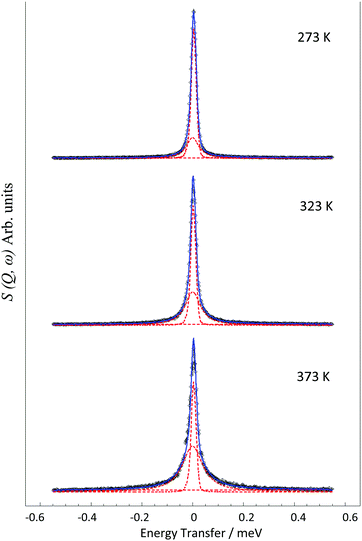
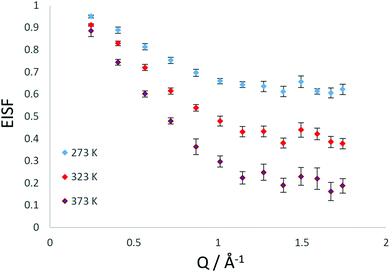
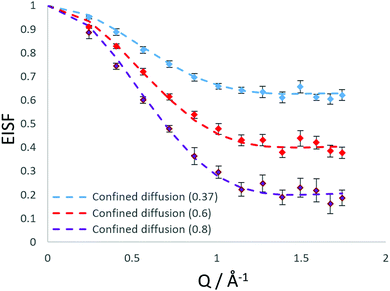
The QENS spectra at Q = 1.01 Å−1 (273, 323 and 373 K) are shown in Fig. 1. The spectra were fitted with the instrumental resolution function, a flat background and a single Lorentzian function suggesting one observable mode of motion on the instrumental timescale. The error in the neutron data points in Fig. 1 are assigned based on Poisson statistics.We note that there is a significant elastic component in the spectra at all temperatures, which may typically be attributable to either a localised motion such as NH3 rotation, or translational diffusion with a component of NH3 which is static on the timescale sampled by the instrument. We characterise this component using the elastic incoherent structure factor (EISF) which is plotted for each temperature in Fig. 2. We note first that there is a significant dependence of the EISF with temperature suggesting the presence of an activated process over this temperature range.
The experimental EISF was then compared with the theoretical models for the EISF which may apply to NH3 in LEV. These include rotational models such as jump rotation around 3 equivalent sites on a circle with a radius (r) approximately that of the N–H bond (1 Å), the theoretical EISF given by
| A0(Q) = j02(Qr). |
We may also consider the model of diffusion confined to a spherical volume of radius rconf as proposed by Volino and Dianoux,39 where the theoretical EISF is given by
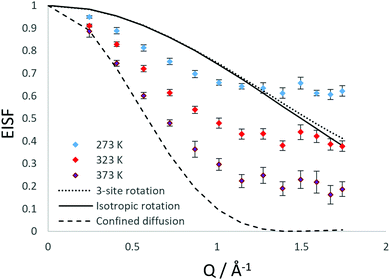
As shown in Fig. 3, the rotational models appear to be a poor fit to the EISF, with the points laying above the experimental points at lower Q for all temperatures and below the experimental points at higher Q values at 273 and 323 K. The model for diffusion confined to a sphere of r = 3.5 Å exhibits the best matching shape to the experimental points, however falls below the experimental points at all Q values (apart from at Q = 0.28 for the highest temperature).
We have also considered that there may be a component of rotating NH3 combined with a component undergoing translational diffusion confined to a sphere. Plots of the experimental EISF with the most optimal convolution of diffusion confined to a sphere with the 3-site jump rotation model are shown in Fig. 4. At 273 K and 323, the combinations do not replicate the shape of the EISF, falling above the experimental points at lower Q and below at higher Q. However, the shape of the experimental EISF is close to the theoretical model at 373 K with a rotational component weighted at 0.3.
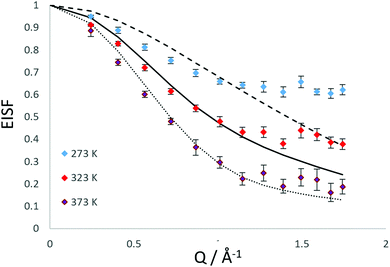
Our best fits at all temperatures however, are obtained upon using the model of confined diffusion in a sphere with a component which is considered static on the timescale sampled by the instrument (∼2–50 ps). We find the best fits were obtained with a spherical radius of 3.5 Å, and a mobile fraction of 0.37 at 273 K, 0.6 at 323 K and 0.8 at 373 K as shown in Fig. 5.
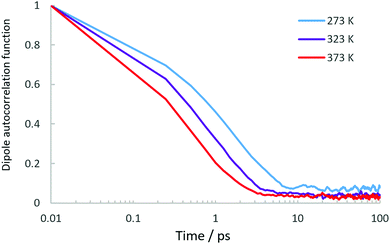
While our EISF analysis allows us to discount a significant contribution of rotational motions at 273 and 323 K, the possibility of such a contribution at 373 K must be addressed due to the EISF fitting in Fig. 4. In order to decipher which model at 373 K is correct between the confined diffusion/static component model, and the confined diffusion/rotational component model, we may use the dipole correlation function obtained from the MD simulations which allow us to assess whether the rotational relaxation time of the NH3 protons around the centre of mass is within the window observable on the QENS instrument. We use the same method as described in a recent study of propane dynamics in porous TiO2![[thin space (1/6-em)]](https://www.rsc.org/images/entities/char_2009.gif) 41 where the orientational-evolution of a unit vector along the N–H bonds are followed along another fixed vector in the molecular frame.
41 where the orientational-evolution of a unit vector along the N–H bonds are followed along another fixed vector in the molecular frame.
The dipole correlation functions are plotted in Fig. 6. We note that the decay is very fast particularly at 373 K, and on the timescale observed by the QENS instrument would more likely produce a flat background, rather than a characterisable quasielastic component. To summarise, the EISF does not conform to a rotational model of ammonia, even when convoluted with confined translational motions (apart from potentially at 373 K), and the dipole correlation function suggests that the rotational relaxation is probably too fast to make a significant contribution to the spectra, especially at 373 K where the EISF may suggest such a rotational contribution. We can therefore conclude that the elastic contribution in our spectra is caused by molecules which are static on the timescale probed by OSIRIS, and that we are observing translational motions with an immobile fraction, rather than observing contributions from localised motions such as ammonia rotation. The presence of an immobile component which lowers with temperature may be related to the same observations as ammonia in silicalite21 where strong binding to active sites was observed, needing thermal energy to break the strong non-bonded interactions.
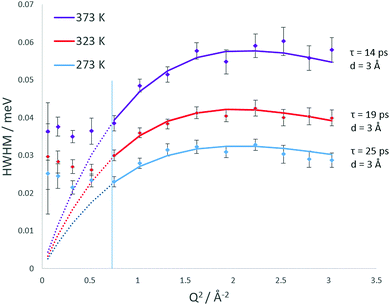
The broadenings of the Lorentzian half-width at half-maximum (HWHM) are plotted at each temperature in Fig. 7. The errors in the Lorentzian HWHM are assigned using a Monte Carlo method where data sets are generated virtually within the neutron data point error bars and then fitted. We observe the plateauing of the HWHM below Q = 0.87 which conforms the Volino–Dianoux model of confined diffusion, where the Lorentzian width will plateau below Q = π/rconf where rconf = 3.5 Å, consistent with the radius of LEV cages. After the plateauing region, we observed that at all temperatures the broadening fits to the Chudley and Elliot jump diffusion model,42 with a fixed jump length of 3 Å.
We note that this is the same mode of motion as was detected in our previous study for ammonia diffusion in CHA.19 The jump residence times decrease over the 273 K to 373 K range from 25–14 ps. The opportunity for jump diffusion arises from movement between LEV cages, as previously shown in CHA and illustrated later by our MD simulations. We therefore consider that the observed motion may be inter-spherical jumps between LEV cages (which are 3.5 Å in diameter) through the 8-ring windows, imposed by the LEV architecture.
The self-diffusion coefficients (Ds) were extrapolated using the Chudley–Elliot model as explained in ref. 23 and 33 and are listed in Table 1 (Ds (QENS, CE)). The coefficients measured are very close to, but slightly higher than those for the CHA system; however, the differences are within the error of the measurements. As with the CHA system, the measured diffusion coefficients are lower by a factor of 3 than those of ammonia obtained in silicalite21 using QENS (with a pore diameter ca. 1.5 Å wider than levynite); though we note that our loadings are significantly higher than even the highest loading in that study (4.3 mol uc−1). The diffusion coefficient may also be estimated via the Volino–Dianoux model, where HWHM values at the low Q plateau at (4.33Ds)/(rconf2). Using rconf = 3.5 Å we obtain the DS values listed in Table 1 (Ds (QENS, VD)) and note that they are similar within error of those obtained using the Chudley–Elliot jump diffusion model.
| LEV | CHA | ||||||
|---|---|---|---|---|---|---|---|
| T K | D s (QENS, CE) | D s (QENS, VD) |
D
s![[thin space (1/6-em)]](https://www.rsc.org/images/entities/char_2009.gif) nano (MD) nano (MD) |
D
s![[thin space (1/6-em)]](https://www.rsc.org/images/entities/char_2009.gif) pico (MD) pico (MD) |
D s (QENS, CE) |
D
s![[thin space (1/6-em)]](https://www.rsc.org/images/entities/char_2009.gif) nano (MD) nano (MD) |
D
s![[thin space (1/6-em)]](https://www.rsc.org/images/entities/char_2009.gif) pico (MD) pico (MD) |
| 273 | 6.63 × 10⁻¹⁰ ± 0.9 × 10⁻¹⁰ | 6.07 × 10⁻¹⁰ ± 0.57 × 10⁻¹⁰ | 1.06 × 10⁻⁹ ± 0.14 × 10⁻⁹ | 2.4 × 10⁻⁹ | 6.0 × 10⁻¹⁰ ± 1.2 × 10⁻¹⁰ | 2.75 × 10⁻⁹ ± 0.72 × 10⁻⁹ | 2.9 × 10⁻⁹ |
| 323 | 8.66 × 10⁻¹⁰ ± 1.3 × 10⁻¹⁰ | 8.1 × 10⁻¹⁰ ± 0.54 × 10⁻¹⁰ | 1.76 × 10⁻⁹ ± 0.3 × 10⁻⁹ | 7.6 × 10⁻¹⁰ ± 1.5 × 10⁻¹⁰ | 3.73 × 10⁻⁹ ± 0.45 × 10⁻⁹ | ||
| 373 | 10.8 × 10⁻¹⁰ ± 1.5 × 10⁻¹⁰ | 10.2 × 10⁻¹⁰ ± 0.59 × 10⁻¹⁰ | 2.13 × 10⁻⁹ ± 0.44 × 10⁻⁹ | 9.4 × 10⁻¹⁰ ± 1.7 × 10⁻¹⁰ | 4.95 × 10⁻⁹ ± 0.33 × 10⁻⁹ | ||
| E a (kJ mol−1) | 4.1 | 4.4 | 6.0 | 3.7 | 4.9 | ||
Crystallite size may also affect the measured diffusivity due to surface barrier effects if the crystallite is too small.43 This effect is not significant in our experiment, as the Angström to nanometre length scale of movement probed by the QENS method is significantly less than the size of the zeolite crystals in our study (∼1–2 μm).
The activation energies were calculated from the Arrhenius plot shown in Fig. 8 and are listed in Table 1. The experimental activation energy is slightly higher than that observed in chabazite by 0.4 kJ mol−1, but we emphasise again the similarity between the extrapolated diffusion coefficients in both systems, which were within the error of the technique. In our previous study of ammonia in chabazite, we noted that over the timescale of the experiment, the dominant motion observed was the jump diffusion between chabazite cages through the 8-ring windows which separated them. The current QENS experiments suggest that the same movement is being observed, and that the change in dimensionality of the system affects neither the rate, nor dominance of this motion in the experimental observations.
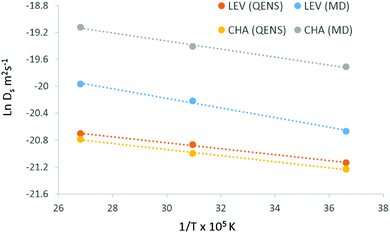 | ||
| Fig. 8 Arrhenius plots for diffusion of ammonia in levynite and chabazite using QENS (Ds (QENS, CE)) and MD, the activation energies obtained are listed in Table 1. | ||
3.2 Molecular dynamics simulations
For a direct comparison between the QENS measurements and MD simulations in both zeolite systems we may calculate the dynamic structure S(Q,ω) which is calculated from the molecular trajectories throughwhich is a discrete Fourier transform over a discrete Q and t range of the intermediate scattering function I(Q,t), directly calculated from the molecular trajectories of the NH3 protons
where R(t) and R(t0) are the position vectors of the NH3 protons at time t and t = 0.
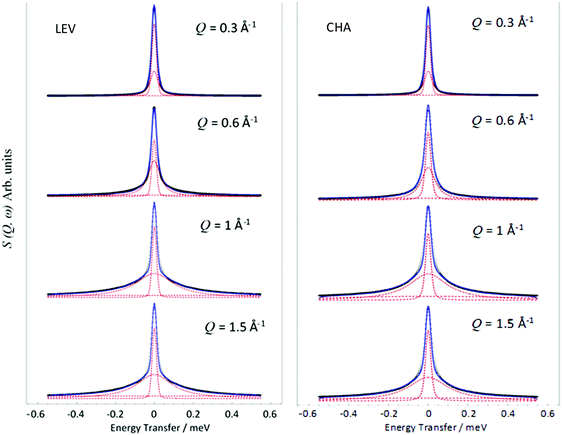
Examples of the S(Q,ω) calculated from the MD simulations are shown in Fig. 9. We note that these can also be fit with a single Lorentzian function as with the experimental data, the broadenings of which may be fitted to the appropriate model to derive the diffusivity in the time window probed by the QENS instrument (∼2–50 ps).
The HWHM of the Lorentzian components fitted to the MD calculated S(Q,ω) in both zeolite systems are plotted in Fig. 10. In both LEV and CHA we observe a Q dependence which could be fitted to the Chudley–Elliot jump diffusion model with the same jump lengths as the experimental data. We note that the fitted residence time is significantly lower than that obtained experimentally at about 6 ps in LEV and 6.5 ps in CHA. The picoscale Ds values (Ds![[thin space (1/6-em)]](https://www.rsc.org/images/entities/char_2009.gif) pico) calculated from these jump parameters are 2.4 × 10⁻⁹ m2 s−1 in LEV and 2.9 × 10⁻⁹ m2 s−1 in CHA (the larger Ds
pico) calculated from these jump parameters are 2.4 × 10⁻⁹ m2 s−1 in LEV and 2.9 × 10⁻⁹ m2 s−1 in CHA (the larger Ds![[thin space (1/6-em)]](https://www.rsc.org/images/entities/char_2009.gif) pico in CHA despite the lower residence time is due to the slightly longer calculated jump distance) and are listed in Table 1. Potential reasons for this lower residence time in the MD compared to the QENS are considered when discussing the overall change in mobility in later paragraphs, pertaining to the generic forcefield use and perfect zeolite crystal. However, we can be confident in our further comparisons that the same type of motion is being observed between the experiment and our simulations. Crucially, we can also conclude that on the picoscale, the diffusivity of ammonia is very similar between LEV and CHA, taking place through jump diffusion which happens at similar rates.
pico in CHA despite the lower residence time is due to the slightly longer calculated jump distance) and are listed in Table 1. Potential reasons for this lower residence time in the MD compared to the QENS are considered when discussing the overall change in mobility in later paragraphs, pertaining to the generic forcefield use and perfect zeolite crystal. However, we can be confident in our further comparisons that the same type of motion is being observed between the experiment and our simulations. Crucially, we can also conclude that on the picoscale, the diffusivity of ammonia is very similar between LEV and CHA, taking place through jump diffusion which happens at similar rates.
 | ||
| Fig. 10 Widths of the Lorentzian broadenings of S(Q,ω) calculated directly from MD simulations in LEV and CHA at 273 K. | ||
Now that we are able to validate that the same mode of motion is observed on the picoscale in our simulations as in experiment, and that the rates of motion are very similar between both zeolites, we will now use the MD simulations to probe the nanoscale mobility of ammonia. Mean Squared Displacement (MSD) plots are presented in Fig. 11 in H-LEV along with those newly calculated for H-CHA at 273 K, 323 K and 373 K. They appear linear at all temperatures, indicating that the statistics in our simulations are sufficient for calculating accurate diffusion coefficients. The calculated diffusion coefficients of NH3 in LEV and CHA are listed in Table 1 (termed Ds![[thin space (1/6-em)]](https://www.rsc.org/images/entities/char_2009.gif) nano MD) and are plotted in Fig. 12.
nano MD) and are plotted in Fig. 12.
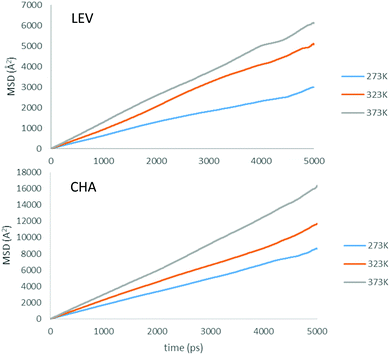 | ||
| Fig. 11 Mean squared displacement (MSD) plots of NH3 in H-LEV and H-CHA obtained from the MD simulations at 273, 323 and 373 K. | ||
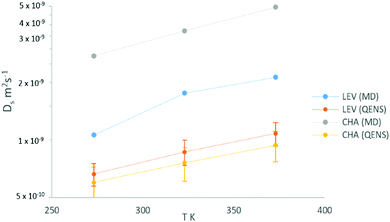 | ||
Fig. 12 Plot of self-diffusion coefficients of NH3 in H-LEV from QENS and MD simulations (Ds![[thin space (1/6-em)]](https://www.rsc.org/images/entities/char_2009.gif) nano), compared with those for the CHA system obtained by both by QENS and MD. nano), compared with those for the CHA system obtained by both by QENS and MD. | ||
We note that the absolute values of Ds calculated from the MD simulations are roughly a factor of 2 higher than those measured by QENS in H-LEV, and a factor of 5 higher than those measured by QENS in H-CHA. The observation of higher calculated diffusivities than those from experiment is common in microscopic studies of sorbate diffusion in zeolites,24,33 often attributed to the ideal zeolite crystal used in the simulation model. The experimental sample is likely to have defects, such as silanol nests and extra-framework aluminium which could hinder sorbate diffusion. An additional reason for the observed difference may be use of the COMPASS force field, which is a generic force field not developed and fitted for these specific systems. Despite the agreement achieved in this study it is important to recognise that any generic force field will have inherent approximations which can only be properly addressed through detailed empirical (or quantum mechanical) fitting of guest–host interactions.
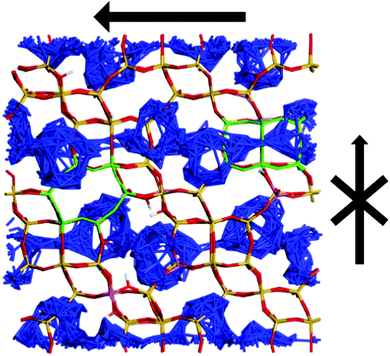
In contrast to the QENS experiments, the MD simulations show a significant difference between the diffusivities calculated in H-CHA and H-LEV. The calculated Ds![[thin space (1/6-em)]](https://www.rsc.org/images/entities/char_2009.gif) nano values are lower in H-LEV than in H-CHA by a factor of 2.5, 2.1 and 2.3 at 273, 323 and 373 K respectively. To explain the difference between the calculated CHA and LEV diffusion coefficients we first consider the MSD plots in the individual directions as shown for 273 K in H-LEV and H-CHA in Fig. 13, where the level of diffusion anisotropy is shown. The 2 dimensional topology of the channels formed from the 8-ring openings in the LEV cage leads to an absence of diffusion in the 001 direction, the equivalent of which is available for diffusion in CHA. This feature is illustrated by the trajectory plot in Fig. 14 which shows the 2D nature of the diffusion in this topology due to the lack of mobility available through the single and double 6-ring windows in this direction. The trajectory plot also illustrates that molecular transport takes place through a jump diffusion mechanism through 8-ring cages as found in the QENS studies.
nano values are lower in H-LEV than in H-CHA by a factor of 2.5, 2.1 and 2.3 at 273, 323 and 373 K respectively. To explain the difference between the calculated CHA and LEV diffusion coefficients we first consider the MSD plots in the individual directions as shown for 273 K in H-LEV and H-CHA in Fig. 13, where the level of diffusion anisotropy is shown. The 2 dimensional topology of the channels formed from the 8-ring openings in the LEV cage leads to an absence of diffusion in the 001 direction, the equivalent of which is available for diffusion in CHA. This feature is illustrated by the trajectory plot in Fig. 14 which shows the 2D nature of the diffusion in this topology due to the lack of mobility available through the single and double 6-ring windows in this direction. The trajectory plot also illustrates that molecular transport takes place through a jump diffusion mechanism through 8-ring cages as found in the QENS studies.
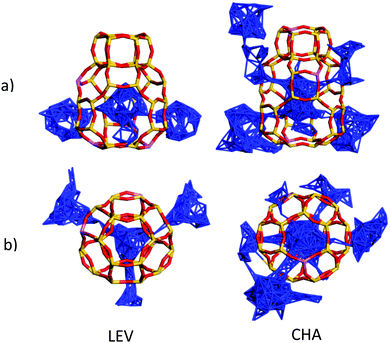
While the anisotropy is a contributing factor to the lower overall diffusivity, it is not however the principle reason for the nanoscale NH3 diffusivity being over a factor of 2 lower in the LEV framework than in CHA. Upon examining the MSD in the individual directions in Fig. 13, we note that even in the mobile 100 and 010 directions, the MSD is significantly lower than that for CHA in Fig. 6. The difference suggests a significantly higher degree of mobility in CHA than in LEV even when the anisotropy is accounted for. An explanation is given upon examining the combined building units of both structures as shown in Fig. 15. The combined building unit of LEV (92 atoms) comprises of a levynite cage (lev) and a double 6-ring (d6r). The combined building unit of CHA (108 atoms) comprises of a chabazite cage (cha) and a double 6-ring (d6r). Despite only a slight increase in size (both in terms of the number of atoms and the volume), there are double the number of 8-rings through which NH3 may diffuse in the CHA structure. Three of the 8-rings in the CHA structure are replaced by 6-rings (which do not allow transport through) in the LEV structure as illustrated in Fig. 8.
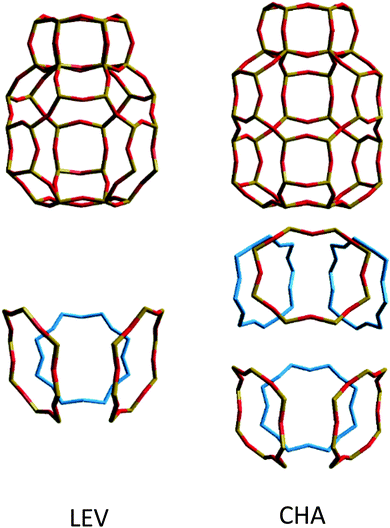 | ||
| Fig. 15 (top) Combined building units for LEV and CHA, with the structural 8-rings highlighted and separated (bottom). | ||
The increased opportunities to leave the cage in CHA are illustrated in Fig. 16, where we show that migration occurs through all the available 8-rings (six in the CHA structure, and three in the LEV structure), and the NH3 molecule therefore has double the number of geometric opportunities to perform intercage diffusion in CHA, explaining its Ds increasing by a factor of ∼2 in the simulations between the two zeolites.
We consider again the QENS experiments and our MD simulations analysed at the picosecond scale, which in contrast to the MD simulations analysed at the nanoscale suggested that the mobility was the same between the two zeolites, as the jump diffusion mechanism observed has the same residence times and jump length. We now consider that rather than contrasting with the MD simulations, the QENS is probing the mode of motion present in the simulations (the intercage jumps through 8-rings), which take place at the same rate in both zeolites; but does not show the frequency with which these jumps take place (which increases by a factor of ∼2 in CHA, in conjunction with the number of 8-rings).
In showing that the intercage jump diffusion behaviour and rate is the same between the two zeolites using QENS and the MD simulations, but that the measured Ds![[thin space (1/6-em)]](https://www.rsc.org/images/entities/char_2009.gif) nano throughout the supercell in the MD simulations differs by a factor of 2, (due to increased opportunities to perform said intercage jumps), the two methods have revealed both consistencies in the behaviour of ammonia between the two zeolites on the local molecular scale, but also illustrated significant differences on the nanoscale, both of which are a direct consequence of the zeolite structure. Our observations not only show both important consistencies and inconsistencies in the dynamical behaviour of the reductant in potential NH3-SCR catalysts, but demonstrate the importance of multiscale study in understanding sorbate behaviour in microporous catalyst design. The ability for combined experimental and theoretical studies to observe and explain such behaviour is also illustrated.
nano throughout the supercell in the MD simulations differs by a factor of 2, (due to increased opportunities to perform said intercage jumps), the two methods have revealed both consistencies in the behaviour of ammonia between the two zeolites on the local molecular scale, but also illustrated significant differences on the nanoscale, both of which are a direct consequence of the zeolite structure. Our observations not only show both important consistencies and inconsistencies in the dynamical behaviour of the reductant in potential NH3-SCR catalysts, but demonstrate the importance of multiscale study in understanding sorbate behaviour in microporous catalyst design. The ability for combined experimental and theoretical studies to observe and explain such behaviour is also illustrated.
4. Summary and conclusions
To understand the influence of framework topology on molecular diffusion in NH3-SCR catalyst design, we have studied the diffusion of ammonia in commercial zeolite levynite (Si/Al = 34) using a combination of QENS and MD simulations between 273 and 373 K. Results were compared with our previous measurements in chabazite (with new MD simulations performed over the same time length in CHA) using the same techniques, to probe any differences in mobility between the 2D LEV structure and the 3D CHA structure. The QENS experiments observed translational diffusion confined to a sphere with a radius of ∼3.5 Å (consistent with the radius of LEV cages), exhibiting a jump diffusion mechanism with a fixed distance of 3 Å, consistent with inter-spherical jumps through the 8-ring windows which link the LEV cages together, as observed in our previous studies in CHA. The extrapolated Ds values were 6.6–10.8 × 10⁻¹⁰ m2 s−1, within error of those obtained in CHA at the same temperatures, suggesting that on the timescale probed by the QENS experiments, the ammonia mobility is the same between the two zeolites. Upon analysing the MD simulations on the picoscale, we observe that the same mode of motion is observed taking place at similar rates between the two frameworks. This consistency between LEV and CHA contrasted with the MD simulations when they were analysed on the nanoscale, which gave Ds values of 1–2.1 × 10⁻⁹ m2 s−1 which in LEV were a factor of ∼2 lower than those obtained for NH3 in CHA at the same temperatures. This difference in nanoscale mobility was attributed to the differing structures of the building units for each zeolite, where the levynite cage (lev) building unit contains three 8-ring windows compared to the six 8-ring windows in the chabazite cage (cha) building unit. The doubling in geometric opportunities for ammonia to jump between chabazite cages through these windows, observed by the QENS experiments, is consistent with the increase in Ds![[thin space (1/6-em)]](https://www.rsc.org/images/entities/char_2009.gif) nano by a factor of ∼2. Our observations that the diffusion coefficients between the two zeolites are measured within error of each other using QENS (and also very similar in the picoscale analysis of the MD simulations), but a factor of ∼2 different from the nanoscale analysis of the MD simulations illustrates the importance of measuring over different time and length scales in such systems. The local molecular scale probed by our QENS experiments (jump diffusion through 8-ring windows) showed significant similarities in ammonia mobility between the two zeolites, compared to the larger nanoscale probed by our MD simulations which show significant differences, directly caused by the difference in zeolite catalyst topology. Data underpinning the results presented here can be found at DOI: 10.5286/ISIS.E.63530347.
nano by a factor of ∼2. Our observations that the diffusion coefficients between the two zeolites are measured within error of each other using QENS (and also very similar in the picoscale analysis of the MD simulations), but a factor of ∼2 different from the nanoscale analysis of the MD simulations illustrates the importance of measuring over different time and length scales in such systems. The local molecular scale probed by our QENS experiments (jump diffusion through 8-ring windows) showed significant similarities in ammonia mobility between the two zeolites, compared to the larger nanoscale probed by our MD simulations which show significant differences, directly caused by the difference in zeolite catalyst topology. Data underpinning the results presented here can be found at DOI: 10.5286/ISIS.E.63530347.
Conflicts of interest
There are no conflicts to declare.Acknowledgements
We acknowledge Johnson Matthey for both the provision of samples and for the permission to study their materials in this publication. The authors acknowledge the ISIS Pulsed Neutron and Muon Source for access to beamline facilities (Experiment RB: 1520464), and the assistance of Dr Stewart Parker during the experimental stage and following discussions. AJOM would like to acknowledge the Ramsay Trust for provision of the Ramsay Trust Memorial Fellowship. We acknowledge the Engineering and Physical Sciences Research Council (EPSRC): grant no. EP/G036675/1 for financial support under their Centres for Doctoral Training scheme and the Science and Technologies Facilities Council. Prof. Nora De Leeuw is thanked for funding under the EPSRC grant EP/K009567/2. The UK Catalysis Hub is kindly thanked for resources and support provided via our membership of the UK Catalysis Hub Consortium and funded by EPSRC (grants EP/K014706/1, EP/K014668/1, EP/K014854/1EP/K014714/1 and EP/M013219/1).References
- R. M. Heck, R. J. Farrauto and S. T. Gulati, Catalytic air pollution control: commercial technology, John Wiley & Sons, 2009 Search PubMed.
- S. Brandenberger, O. Kröcher, A. Tissler and R. Althoff, Catal. Rev., 2008, 50, 492–531 CAS.
- A. M. Beale, F. Gao, I. Lezcano-Gonzalez, C. H. Peden and J. Szanyi, Chem. Soc. Rev., 2015, 44, 7371–7405 RSC.
- J. H. Kwak, R. G. Tonkyn, D. H. Kim, J. Szanyi and C. H. Peden, J. Catal., 2010, 275, 187–190 CrossRef CAS.
- I. Bull, A. Moini, G. S. Koermer, J. A. Patchett, W. M. Jaglowski and S. Roth, US Pat., 7704475, 2010 Search PubMed.
- I. Bull, W.-M. Xue, P. Burk, R. S. Boorse, W. M. Jaglowski, G. S. Koermer, A. Moini, J. A. Patchett, J. C. Dettling and M. T. Caudle, US Pat., 7601662, 2009 Search PubMed.
- I. Bull, W.-M. Xue, P. Burk, R. S. Boorse, W. M. Jaglowski, G. S. Koermer, A. Moini, J. A. Patchett, J. C. Dettling and M. T. Caudle, US Pat., 8735311, 2014 Search PubMed.
- S. I. Zones, US Pat., 4544538, 1985 Search PubMed.
- D. W. Fickel and R. F. Lobo, J. Phys. Chem. C, 2009, 114, 1633–1640 Search PubMed.
- S. T. Korhonen, D. W. Fickel, R. F. Lobo, B. M. Weckhuysen and A. M. Beale, Chem. Commun., 2011, 47, 800–802 RSC.
- U. Deka, A. l. Juhin, E. A. Eilertsen, H. Emerich, M. A. Green, S. T. Korhonen, B. M. Weckhuysen and A. M. Beale, J. Phys. Chem. C, 2012, 116, 4809–4818 CAS.
- D. W. Fickel, E. D’Addio, J. A. Lauterbach and R. F. Lobo, Appl. Catal., B, 2011, 102, 441–448 CrossRef CAS.
- I. Bull, U. Müller and B. Yilmaz, US Pat., 20160129431, 2015 Search PubMed.
- I. Bull, U. Müller and B. Yilmaz, US Pat., 9242241, 2016 Search PubMed.
- I. Lezcano-Gonzalez, U. Deka, B. Arstad, A. Van Yperen-De Deyne, K. Hemelsoet, M. Waroquier, V. Van Speybroeck, B. M. Weckhuysen and A. M. Beale, Phys. Chem. Chem. Phys., 2014, 16, 1639–1650 RSC.
- I. Lezcano-Gonzalez, D. S. Wragg, W. A. Slawinski, K. Hemelsoet, A. Van Yperen-De Deyne, M. Waroquier, V. Van Speybroeck and A. M. Beale, J. Phys. Chem. C, 2015, 119, 24393–24403 CAS.
- F. Giordanino, E. Borfecchia, K. A. Lomachenko, A. Lazzarini, G. Agostini, E. Gallo, A. V. Soldatov, P. Beato, S. Bordiga and C. Lamberti, J. Phys. Chem. Lett., 2014, 5, 1552–1559 CrossRef CAS PubMed.
- K. A. Lomachenko, E. Borfecchia, C. Negri, G. Berlier, C. Lamberti, P. Beato, H. Falsig and S. Bordiga, J. Am. Chem. Soc., 2016, 138, 12025–12028 CrossRef CAS PubMed.
- A. J. O'Malley, I. Hitchcock, M. Sarwar, I. P. Silverwood, S. Hindocha, C. R. A. Catlow, A. P. E. York and P. Collier, Phys. Chem. Chem. Phys., 2016, 18, 17159–17168 RSC.
- A. J. O'Malley, S. F. Parker and C. R. A. Catlow, Chem. Commun., 2017, 53, 12164–12176 RSC.
- H. Jobic, H. Ernst, W. Heink, J. Kärger, A. Tuel and M. Bée, Microporous Mesoporous Mater., 1998, 26, 67–75 CrossRef CAS.
- A. J. O'Malley, V. G. Sakai, I. P. Silverwood, N. Dimitratos, S. F. Parker and C. R. A. Catlow, Phys. Chem. Chem. Phys., 2016, 18, 17294–17302 RSC.
- L. N. Gergidis, D. N. Theodorou and H. Jobic, J. Phys. Chem. B, 2000, 104, 5541–5552 CrossRef.
- H. Jobic and D. N. Theodorou, Microporous Mesoporous Mater., 2007, 102, 21–50 CrossRef CAS.
- A. J. O’Malley, C. R. A. Catlow, M. Monkenbusch and H. Jobic, J. Phys. Chem. C, 2015, 119, 26999–27006 Search PubMed.
- V. Sharma, S. Gautam, S. Mitra, M. N. Rao, A. Tripathi, S. Chaplot and R. Mukhopadhyay, J. Phys. Chem. B, 2009, 113, 8066–8072 CrossRef CAS PubMed.
- A. Sayeed, S. Mitra, A. Anil Kumar, R. Mukhopadhyay, S. Yashonath and S. Chaplot, J. Phys. Chem. B, 2003, 107, 527–533 CrossRef CAS.
- R. Mukhopadhyay, A. Sayeed, S. Mitra, A. A. Kumar, M. N. Rao, S. Yashonath and S. Chaplot, Phys. Rev. E: Stat., Nonlinear, Soft Matter Phys., 2002, 66, 061201 CrossRef CAS PubMed.
- A. J. O’Malley and C. R. A. Catlow, Phys. Chem. Chem. Phys., 2013, 15, 19024–19030 RSC.
- A. J. O'Malley and C. R. A. Catlow, Phys. Chem. Chem. Phys., 2015, 17, 1943–1948 RSC.
- M. T. Telling and K. H. Andersen, Phys. Chem. Chem. Phys., 2005, 7, 1255–1261 RSC.
- O. Arnold, J.-C. Bilheux, J. Borreguero, A. Buts, S. I. Campbell, L. Chapon, M. Doucet, N. Draper, R. F. Leal and M. Gigg, Nucl. Instrum. Methods Phys. Res., Sect. A, 2014, 764, 156–166 CrossRef CAS.
- R. T. Azuah, L. R. Kneller, Y. Qiu, P. L. Tregenna-Piggott, C. M. Brown, J. R. Copley and R. M. Dimeo, J. Res. Natl. Inst. Stand. Technol., 2009, 114, 341 CrossRef CAS PubMed.
- A. J. O’Malley and C. R. A. Catlow, in Experimental Methods in the Physical Sciences, ed. F.-A. Felix and L. P. David, Academic Press, 2017, vol. 49, pp. 349–401 Search PubMed.
- D. S. Materials Studio 8.0, 5005 Wateridge Vista Drive, San Diego, CA 92121 USA, 2014 Search PubMed.
- http://www.iza-structure.org/databases/ .
- H. Sun, J. Phys. Chem. B, 1998, 102, 7338–7364 CrossRef CAS.
- G. Goret, B. Aoun and E. Pellegrini, J. Chem. Inf. Model., 2017, 57, 1–5 CrossRef CAS PubMed.
- F. Volino and A. Dianoux, Mol. Phys., 1980, 41, 271–279 CrossRef CAS.
- M. Bee, Biology and Materials Science, Adam Hilger, Bristol, 1988, 193 Search PubMed.
- S. Gautam and D. Cole, Chem. Phys., 2015, 458, 68–76 CrossRef CAS.
- C. Chudley and R. Elliott, Proc. Phys. Soc., 1961, 77, 353 CrossRef.
- A. R. Teixeira, X. Qi, C.-C. Chang, W. Fan, W. C. Conner and P. J. Dauenhauer, J. Phys. Chem. C, 2014, 118, 22166–22180 CAS.
| This journal is © the Owner Societies 2018 |


