 Open Access Article
Photocatalytic activity and charge carrier dynamics of TiO2 powders with a binary particle size distribution†
Fabian
Sieland
 *a,
Jenny
Schneider
 *a and
Detlef W.
Bahnemann
 ab
ab
aInstitute of Technical Chemistry, Leibniz University Hannover, Callinstr. 5, 30167 Hannover, Germany. E-mail: sieland@iftc.uni-hannover.de; tci.uni-hannover.de; Tel: +49 511 762 16043
bLaboratory “Photoactive Nanocomposite Materials”, Saint-Petersburg State University, Ulyanovskaya Str. 1, Peterhof, Saint-Petersburg, 198504, Russia
First published on 12th February 2018
Abstract
The effects of the particle size distribution on the charge carrier dynamics and the photocatalytic activity of mixed titanium dioxide (TiO2) powder samples were investigated in this work. Instead of the synthesis of the small semiconductor particles, the binary particle size distributions of the powders were obtained by mixing commercially available TiO2 powders with different particle sizes. The pure anatase samples (average diameters: 7, 20, and 125 nm, respectively) were created via ultrasound treatment and discreet drying. The photocatalytic activity of the powder samples was assessed by the degradation of nitric oxide (NO) and acetaldehyde in the gas phase. Furthermore, the charge carrier kinetics was determined using transient absorption spectroscopy following pulsed laser excitation. Importantly, a recently published model based on fractal dimensions was used to fit the transient signals of the photo generated charge carriers in the TiO2 powder samples. The effects of the particle size on the acetaldehyde degradation could be explained by the formation of agglomerates, which reduce the available surface area of smaller particles. The fast oxidation of acetaldehyde on the surface of TiO2 by direct hole transfer was further independent of the observed charge carrier lifetimes on the microsecond time scale. The photocatalytic NO degradation, on the other hand, increased for samples containing larger amounts of small particles. The corresponding photonic efficiencies correlated well with the charge carrier lifetimes determined by the time-resolved studies. Hence, it was concluded that a long charge carrier lifetime generally leads to higher fractional conversions of NO. The employed fractal fit function was proved to be beneficial for the kinetic analysis of charge carrier recombination in TiO2, in direct comparison with a second order fit function.
1. Introduction
Photocatalytic reactions are typically assessed empirically by their overall yield, despite the fact that the photocatalytic process is a complex multistep reaction including photon absorption, charge carrier generation, separation, trapping, and charge carrier transfer.1 The reactant needs to be adsorbed and products desorbed from the catalyst surface, if the reaction is not carried out in the liquid or gas phase by mobile radical species.2 Consequently, the empirical analysis of photocatalytic experiments hampers the identification of the rate limiting step. However, detailed knowledge concerning the primary processes is crucial for the development of photocatalysts with higher efficiencies. The charge carrier lifetime, for instance, represents one of the key parameters influencing the photocatalytic process.3 It is expected that a detailed knowledge of the charge carrier kinetics facilitates the design of future photocatalysts exhibiting higher photocatalytic activities. Transient absorption spectroscopy is a feasible technique to analyze the charge carrier kinetics ranging from femtoseconds to milliseconds and, hence, to provide quantitative and time resolved analysis of the charge carrier related phenomena of the photocatalytic reaction.4,5 Indeed, transient absorption spectroscopy detects the free or trapped charge carriers responsible for the photocatalytic oxidation or reduction on the surface.6 Especially, the trapped charge carriers are of utmost importance due to their long lifetime compared to the free charge carriers.7–9 Subsequently, it is inevitable to determine and to trace the charge carriers in the material to detect and justify the reasons for beneficial or diminished yields.However, the kinetic analysis of the charge carrier recombination is not trivial. Several fit functions, such as monoexponential,10 double-exponential,11 and second order fits,5,12–14 have been employed for the mathematical analysis of charge carrier recombination in TiO2. Recently, Sieland et al. recommended the use of a fractal fit function.15 But the feasibility of the proposed model, especially for the analysis of the charge carrier recombination in TiO2 powders with a more complex particle size distribution, has not been shown yet.
During the last few years the effect of the particle size, and the corresponding change in the surface area, on the photocatalytic activity has been discussed intensely. General agreement appears to exist for the fact that for surface driven reactions, where the photogenerated hole is directly transferred to an adsorbed species, a large interface is essential for both the adsorption and the charge carrier transfer. Nevertheless, this mechanism is substrate specific and a direct correlation between the surface area and photocatalytic activity was found in TiO2 suspensions only for a few reactants.16 Moreover, current studies demonstrate that indeed the charge carrier kinetics of TiO2 depend on the particle size as well. TiO2 particles with a diameter of 20 nm displayed the smallest charge carrier signal compared to both, larger and smaller particles.10 One possible explanation for this finding is the ambivalent effect of surface recombination and surface trapping reactions. This has also been proposed to be the reason for the reduced photoreactivity of small TiO2 particles as compared with P25: due to their intrinsic defects, smaller particles are likely to exhibit higher charge carrier recombination rates.17 On the other hand, kinetic models point out that due to the bulk recombination, the quantum yield of TiO2 should decrease with its grain size.18 Agrios and Pichat analyzed the correlation of the surface area, charge carrier recombination rate and photocatalytic removal of phenol, anisole, and pyridine for a series of TiO2 photocatalysts.19 They only found a good correlation of the described properties for the degradation of phenol, which was explained by a potential adsorption of the reactants or intermediates formed on the photocatalyst.19
Overall, the listed studies do not lead to a clear and distinct correlation of the particle size and photocatalytic activity. Moreover, most studies related to the effect of the TiO2 surface area or the particle size assess the photocatalytic activity in particulate suspensions in water.14,20–22 These aqueous systems have the drawback that water molecules can replace adsorbed molecules on the catalyst surface and thereby interfere with the charge carrier trapping and radical formation reactions.16,23,24 Consequently, the degradation of simple gaseous molecules on solid–gas interfaces might reveal a better correlation of the particle size and charge carrier lifetime.
In sum, detailed studies of the effect of the particle size on the charge carrier dynamics and on the photocatalytic activity at the solid–gas interface are still required. Furthermore, since most commercially available TiO2 powders have a rather broad particle size distribution, mixing of TiO2 powders represents a much simpler alternative to the synthesis of powder samples with an intermediate particle size. Subsequently, instead of the utilization of synthesized nanoparticles with a uniform particle size, a simple mixing approach of commercially available TiO2 powders was used here. Hence, it is of great interest, if the effects observed upon variation of the particle size by chemical synthesis reported in the literature agree with the results achieved for the mixed powder samples with a binary particle size distribution.
Therefore, the present study investigates the effect of the binary particle size distribution of TiO2 powder samples on the lifetime of the deeply trapped charge carriers and correlates the charge carrier kinetics with the photocatalytic degradation of air pollutants. The charge carrier recombination was studied with the help of a fractal fit function. The photocatalytic degradation of acetaldehyde and nitric oxide was carried out, which is a frequently used standardized method for the analysis of photocatalytic activities.25–27
2. Experimental details
2.1. Materials
The TiO2 samples were created by mixing of the following materials: PC500 (PC500, Cristal; anatase, 5–10 nm particles), PC105 (PC105, Cristal; anatase, 15–20 nm), and Kronos1001 (Kronos1001, KRONOS International Inc.; anatase, 50–200 nm particles). For suspensions ultra-pure water (Milli-Q, EMD Millipore) and ethanol (Carl Roth GmbH & Co. KG; 99.8% with 1% MEK) were used. The gas degradation experiments were carried out using gas bottles of acetaldehyde and NO in nitrogen (The Linde Group; 200 ppm acetaldehyde in N2; 50 ppm NO in N2) and compressed, oil-free air.The surface area and particle size of the three different TiO2 powders are given in Table 1.
| Material | Average particle size (nm) | BET surface area provided by the supplier (m2 g−1) | BET surface area measured (m2 g−1) |
|---|---|---|---|
| PC500 | 7 | 350 | 305 |
| PC105 | 17 | 90 | 78 |
| Kronos1001 | 125 | 12 | 10 |
2.2. Preparation of the TiO2 mixtures
Large spherical Kronos1001 particles served as carriers for the smaller PC105/350 particles. To obtain a good distribution of small particles deposited on the large particles the following ultrasound procedure was applied (Fig. 1). PC105 or PC500 was added to an aqueous ethanolic solution (10 vol% ethanol) and subjected to 5 minute ultrasound treatment (340 W L−1). A final concentration of 10 g L−1 TiO2 was achieved by the addition of Kronos1001. Sonication was not interrupted for the addition of the larger particles. The ultrasound processing of the mixed suspension was extended for further 3 minutes. The solid particles were separated via centrifugation with a maximum speed of 500 rpm for 6 hours. To achieve a better phase separation the samples were stored over night and the precipitates were collected. The reference materials, that are pure Kronos1001, PC105, and PC500, were treated in the same manner. | ||
| Fig. 1 Two-step ultrasound treatment for the synthesis of TiO2 with a binary particle size distribution (mixed TiO2). | ||
According to the described procedure two series of new materials were manufactured: samples consisting of large Kronos1001 particles were combined with 0.4, 5, 20, 40, and 70 wt% of small particles PC105/PC500. All results discussed in this work are related to these two powder series.
2.3. Instrumentation
All powder samples were mixed with a Branson 450 Digital Sonifier (102-C Converter), centrifuged with a Kendro Megafuge 1.0 and dried in an oven (Memmert GmbH + Co. KG; BE 400). The photocatalytic acetaldehyde degradation was determined as described by ISO 22197-2:2011 using the following equipment: Philips Lamp HB 175 (4× Philips Cleo 15 W, 365 nm); flow meter: Brooks Instrument B.V. Smart Mass Flow 5850S; Gas chromatography: Syntech Spectras GC 955. The photocatalytic NO degradation was determined as described by ISO 22197-1:2011: Philips Lamp HB 175 (4× Philips Cleo 15 W, 365 nm); flow meter: Brooks Instrument B.V. Smart Mass Flow 5850S; NO analyzer APNA 360 from Horiba. The TEM images were taken with a FEI Tecnai G2 F20 TMP instrument (200 kV FEG). BET surface area measurements were carried out with a Micromeritics AutoMate 23. Transient absorption spectroscopy was performed with an Applied Photophysics LKS 80 Laser Flash Photolysis Spectrometer coupled with a Brilliant B Nd-YAG laser (3rd harmonic, 355 nm) from Quantel.2.4. Acetaldehyde degradation
Acetaldehyde degradation was measured as described in ISO 22197-2. However, the geometrical surface area and the gas flow diverged from the ISO conditions. First, all powder samples were pulverized with a mortar and pestle. The fine powders were pressed into sample holders (3.1 × 3.1 × 0.1 cm) made from PTFE. The active surface in contact with the acetaldehyde stream was 9.6 cm2. UV-pretreatment was carried out with 10 W m−2 (365 nm, Philips Cleo) for 72 hours. Between measurement and pretreatment the samples were stored in vacuum tight desiccators. Each measurement was performed under a constant stream of synthetic air containing 1 ppm acetaldehyde at 50% relative humidity. The conversion of acetaldehyde was detected under 10 W m−2 UV-A radiation (365 nm, Philips Cleo).In the ESI† the course of the acetaldehyde concentration during the experimental procedure is illustrated (Fig. S1, ESI†). At the beginning of the experiment the concentration of acetaldehyde cAcetaldehyde is detected in the bypass mode. After changing from bypass to the reactor the adsorption of acetaldehyde on the sample surface leads to a negative concentration peak. The stable concentration of acetaldehyde in the dark cDark is in dynamic equilibrium with the adsorption on the sample surface and was averaged from the last 13 data points (>60 min) before the illumination was started. The illumination of the sample with UV light leads to the photocatalytic degradation of acetaldehyde and the concentration of acetaldehyde under illumination cIllumination was averaged from the last 13 data points before the light was turned off. The fractional conversion of acetaldehyde ΔcAcetaldehyde was taken from the difference in the concentration between dark and illumination (eqn (1)).
| ΔcAcetaldehyde = cDark − cIllumination | (1) |
The fractional conversion of acetaldehyde or NO ΔcGas was used to calculate the photonic efficiency. Eqn (2) shows the mathematical relation for the calculation of the photonic efficiency ξ.28 The experimental attributes are: volume flow ![[V with combining dot above]](https://www.rsc.org/images/entities/i_char_0056_0307.gif) [1.66 × 10⁻⁵ m3 s−1], pressure p [101
[1.66 × 10⁻⁵ m3 s−1], pressure p [101![[thin space (1/6-em)]](https://www.rsc.org/images/entities/char_2009.gif) 325 Pa], Avogadro constant NA [6.022 × 10²³ mol−1], Planck constant h [6.626 × 10⁻³⁴ m2 kg s−1], speed of light c [2.998 × 10⁸ m s−1], light intensity I [10 W m−2], employed wavelength of the light (assuming monochromatic light) λ [3.65 × 10⁻⁷ m], gas constant R [8.314 J mol−1 K−1], temperature T [298 K], and probing area of the catalyst A [9.61 × 10⁻⁴ m2].
325 Pa], Avogadro constant NA [6.022 × 10²³ mol−1], Planck constant h [6.626 × 10⁻³⁴ m2 kg s−1], speed of light c [2.998 × 10⁸ m s−1], light intensity I [10 W m−2], employed wavelength of the light (assuming monochromatic light) λ [3.65 × 10⁻⁷ m], gas constant R [8.314 J mol−1 K−1], temperature T [298 K], and probing area of the catalyst A [9.61 × 10⁻⁴ m2].
 | (2) |
The results were averaged from three experiments and in the case of the acetaldehyde degradation the standard errors (SE) were calculated according to eqn (3).
 | (3) |
2.5. NO degradation
The NO degradation was measured as described in ISO 22197-1. However, the active surface area and the gas flow diverged from the ISO conditions. Sample preparation, sample holder, UV-pretreatment and storage were identical to the acetaldehyde degradation described in Section 2.4. Each measurement was performed under a constant stream of synthetic air (gas flow of![[V with combining dot above]](https://www.rsc.org/images/entities/i_char_0056_0307.gif) [5.0 × 10⁻⁵ m3 s−1]) containing 1 ppm NO and 50% relative humidity. Conversion of NO was detected under 10 W m−2 UV radiation (365 nm, Philips Cleo). The experimental course of the NO concentration (Fig. S2, ESI†) is similar to the course of the acetaldehyde concentration, since the same experimental setup was used. At the beginning of the experiment 1 ppm NO is detected in the bypass mode and the adsorption of NO can be seen as a negative peak when the gas flow is changed from bypass to the reactor. The concentration of NO in the dark cDark and the concentration of NO under illumination cIllumination were averaged from 120 data points. The fractional conversion of NO ΔcNO (eqn (4)) was calculated from the difference in the concentration between dark and illumination and was used to calculate the photonic efficiency ξNO similar to the degradation of acetaldehyde (cf.eqn (2)).
[5.0 × 10⁻⁵ m3 s−1]) containing 1 ppm NO and 50% relative humidity. Conversion of NO was detected under 10 W m−2 UV radiation (365 nm, Philips Cleo). The experimental course of the NO concentration (Fig. S2, ESI†) is similar to the course of the acetaldehyde concentration, since the same experimental setup was used. At the beginning of the experiment 1 ppm NO is detected in the bypass mode and the adsorption of NO can be seen as a negative peak when the gas flow is changed from bypass to the reactor. The concentration of NO in the dark cDark and the concentration of NO under illumination cIllumination were averaged from 120 data points. The fractional conversion of NO ΔcNO (eqn (4)) was calculated from the difference in the concentration between dark and illumination and was used to calculate the photonic efficiency ξNO similar to the degradation of acetaldehyde (cf.eqn (2)).| ΔcNO = cDark − cIllumination | (4) |
2.6. Transient absorption spectroscopy
Charge carrier signals were detected in the time range from 5 μs to 1 ms and in the wavelength range between 700 and 400 nm (20 nm step size). The excitation wavelength was 355 nm and each 6 ns laser pulse had an average energy density of 2 mJ cm−2. A xenon lamp was focused onto the samples as analyzing light and the scattered light was guided into the monochromator and detector (Hamamatsu PMT R928). Each transient signal represents the average of 200 laser shots. The samples were flushed with nitrogen for 30 minutes prior to the experiments. The optical change in reflectance J of the powder samples at 500 nm was processed and analyzed according to the second order kinetics with baseline (eqn (5)) and fractal charge carrier dynamics (eqn (6)). | (5) |
 | (6) |
In second order decay and in the fractal functions, the change in reflectance ΔJ decays from the initial height of the signal A with the decay constant k. B represents the baseline of the fit function. In the case of the fractal kinetics k2,f is the rate constant and h is the fractal dimension coefficient. The second order rate constant and the fractal rate constant are generally related to the recombination of the photogenerated charge carriers. The details of the fractal dynamics approach and the differences to the second order kinetics with a baseline have been described elsewhere.15 In short, the difference between the two models is the diffusion of the reactive species. In both models two species of trapped charge carriers (electrons and holes) are the reactive species. However, the simple second order approach describes the reaction of the species in a free three-dimensional space, while the fractal model assumes that the diffusion of the species is limited to the surface of the TiO2 particles.15 The structured two-dimensional surface of the agglomerated particles limits the diffusion and represents a fractal dimension.
3. Results
3.1. Structure of the TiO2 agglomerates
Good mixing between the large and the small TiO2 particles was achieved in the TiO2 mixtures synthesized in this study. The particle agglomerates need to be separated to enable the formation of mixed agglomerates. The high energy density during the ultrasound treatment facilitated the formation of small agglomerated nanoparticles attached to the surface of larger spherical TiO2 particles.29 The homogeneity of the samples prepared here was assessed using TEM images. The resulting microstructure of the samples generated in this study is illustrated in the ESI† (Fig. S3). Only mixed agglomerates were detected by TEM imaging. Hence, intimate contact between the differently sized particles has apparently been realized thus hopefully enabling an unrestricted charge transfer between the different particles.3.2. Acetaldehyde degradation
The photocatalytic activity of the prepared samples was tested by acetaldehyde degradation in the gas phase. The fractional conversion of acetaldehyde was employed to calculate the photonic efficiency ξAcetaldehyde according to eqn (2). The photonic efficiency of pure untreated PC105 was calculated from the fractional conversion of acetaldehyde. A fractional conversion of 0.42 ppmv results in a photonic efficiency of 0.98%. The calculated values for the three untreated commercial TiO2 samples are shown in Table 2.| Material | ΔcAcetaldehyde (ppmv) | ξ Acetaldehyde (%) | ΔcAcetaldehyde (ppmv) | ξ Acetaldehyde (%) |
|---|---|---|---|---|
| Untreated TiO2 | Untreated TiO2 | Ultrasound treated TiO2 | Ultrasound treated TiO2 | |
| a Average of three measurements and standard error. | ||||
| PC500 | 0.37 | 0.86 | 0.54 | 1.25 (±0.22) |
| PC105 | 0.42 | 0.98 | 0.60 | 1.38 (±0.22) |
| Kronos1001 | 0.31 | 0.71 | 0.61 | 1.41 (±0.20) |
Fig. 2 illustrates the impact of the content of smaller particles (PC500 or PC105) on the photonic efficiency in mixtures of these particles with the large Kronos1001 particles.
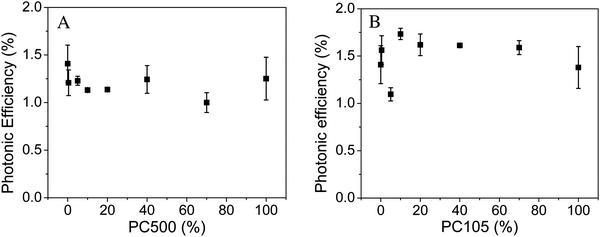 | ||
| Fig. 2 Photonic efficiencies obtained from the photocatalytic acetaldehyde degradation employing PC500 (A) and PC105 (B) mixed with Kronos1001 (average of three measurements and standard error). | ||
For this series with small PC500 particles deposited on the large Kronos1001 particles no systematic effect of the mixing ratio on the photonic efficiency could be detected (cf.Fig. 2). These results do not comply with our original expectations. It should be noted here that the pure TiO2 powder exhibits almost the same photocatalytic activity as the mixtures even though only PC500, that is Cristal PC500, has been developed as a photocatalyst, while Kronos1001, Kronos 1001, is sold as a pigment. PC500 typically shows high photocatalytic activity for self-cleaning, nitric oxide degradation and methylene blue oxidation.30–32Fig. 2B shows the photonic efficiencies of mixtures between PC105 and Kronos1001. Similar to the series containing PC500, the addition of PC105 has only little impact on the acetaldehyde degradation. Obviously, the acetaldehyde degradation indicates no systematic trends of the mixing ratio on the photocatalytic activity for our synthesized samples. The photocatalytic degradation of acetaldehyde in the gas phase on TiO2 surfaces has previously been investigated by Freitag et al.28 However, these authors mainly studied modified anatase materials, rutile, and mixtures of rutile and anatase. Additionally, the initial concentration of acetaldehyde in the gas flow was much higher than in the present study (5 ppmv instead of 1 ppmv). Hence, the reported values for the photocatalytic activities are higher and cannot be compared with the results obtained here.
3.3. NO degradation
As an alternative to the acetaldehyde degradation, which showed only small variations in the photocatalytic activity, nitric oxide was investigated as a probe molecule. The degradation setup for both probe molecules was identical. Pure untreated PC105 showed a fractional conversion of 0.117 ppmv NO resulting in a photonic efficiency of 0.82%. The calculated values for the three untreated commercial TiO2 samples are summarized in Table 3.| Material | ΔcNO (ppmv) | ξ NO (%) | ΔcNO (ppmv) | ξ NO (%) |
|---|---|---|---|---|
| Untreated | Untreated | Ultrasound treated TiO2 | Ultrasound treated TiO2 | |
| PC500 | 0.124 | 0.86 | 0.156 | 1.08 |
| PC105 | 0.117 | 0.82 | 0.167 | 1.16 |
| Kronos1001 | 0.065 | 0.45 | 0.091 | 0.63 |
For the two series with varying particle sizes the photonic efficiencies were calculated with eqn (2) and the results are illustrated in Fig. 3.
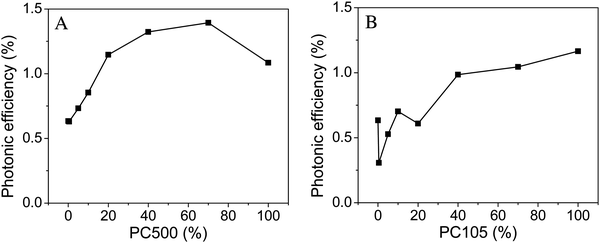 | ||
| Fig. 3 Photonic efficiencies obtained from the photocatalytic NO degradation employing PC500 (A) and Kronos1001 (B) mixed with Kronos1001. | ||
The nitrogen(II) oxide degradation efficiency tends to increase with higher loadings of smaller particles (PC500). Furthermore, a maximum in activity was observed for mixtures containing 70% PC500. The samples with a binary particle size distribution, in the area of 20 to 70% loadings of PC500, showed a higher photocatalytic activity in comparison to the pure basic materials. Fig. 3B displays the results for the series containing PC105. Similar to the samples with PC500 the increasing trend of photocatalytic activity with a higher content of small particles was observed. In contrast to the series with PC500 no mixed sample outperformed the pure PC105, which showed with 1.16% the highest photonic efficiency of this series.
In addition to the degradation of NO, the removal of NOx was determined. The respective results are illustrated in the ESI† (S4–S6). Generally, the NOx degradation was much smaller than the NO degradation. Nonetheless, the same trends were identified for the NOx degradation as discussed previously for the NO degradation. In 2014, Bloh et al. published the photonic efficiencies of several pure commercial photocatalysts based on nitric oxide degradation.32 They reported values of 0.31% for PC500 and slightly higher activity of 0.36% for PC105 with a concentration of 8 ppm nitric oxide in the gas flow. Accordingly, in this study the catalyst showed a higher photonic efficiency of up to 1.4%, which can be explained by the difference in the nitric oxide concentration and the volume flow (8 × 10⁻⁷ m3 s−1 was applied in their studies instead of 5 × 10⁻⁵ m3 s−1, which was used in the present study). Freitag et al. analyzed the photocatalytic NO degradation under nearly similar conditions as employed here, only the sample area of 5 × 10⁻³ m2 was five times higher.28 Since the calculated photonic efficiencies are normalized to the sample area, the potential influence is considered to be small. Indeed, the obtained photonic efficiencies for the untreated commercial PC105 and PC500 with small particle sizes (0.82% and 0.86%) are close to the reported values from Freitag et al. for UV100 (0.5%), which is a commercial anatase TiO2 with a similar particle size to PC500.28 The results of this study confirm that PC105 and PC500 both have a high and almost similar photocatalytic activity for the removal of NO.
3.4. Surface area
Both assays for the determination of the photocatalytic activity focus on the gas phase degradation of a probe molecule at the solid–gas interface of the photocatalyst. Hence, the size of this interface should potentially influence the photocatalytic activity. As indicated by the names given to the pure TiO2 samples in this work, derived from the BET surface area provided by the suppliers, there is more than one order of magnitude change in the surface area (Kronos1001 to PC500).We determined the BET surface areas of the two series of synthesized samples in triplicates and the outcome is shown in Table 4 and Fig. 4.
| Material | BET surface area before ultrasound synthesis (m2 g−1) | BET surface area after ultrasound synthesis (m2 g−1) |
|---|---|---|
| PC500 | 305 | 309 |
| PC105 | 78 | 81 |
| Kronos1001 | 10 | 11 |
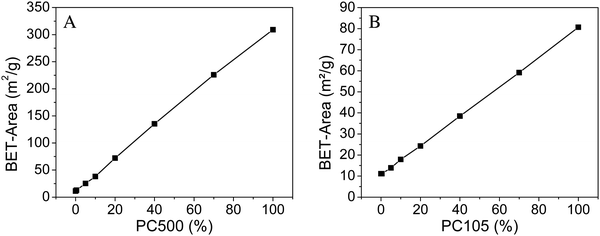 | ||
| Fig. 4 BET surface area of PC500 (A) and PC105 (B) mixed with Kronos1001 (average from three measurements). | ||
The BET surface area of the tested samples shows a linear correlation starting from 11 m2 g−1 for Kronos1001 to 309 m2 g−1 for PC500 and to 81 m2 g−1 for PC105, respectively. Hence, the BET surface areas are found to be in good agreement with the information provided by the suppliers. Furthermore, the linearity of the results provides good evidence for the composition of the samples studied here.
To estimate the effective surface area, which can be utilized for the gas phase degradation of NO, we determined the amount of NO adsorbed on the geometrical sample surfaces. At the beginning of every NO degradation experiment a dark adsorption measurement is carried out, when the gas-flow of 1 ppm NO is changed from the bypass to the reactor mode. The amount of adsorbed NO is readily obtained from the adsorption peak area of this drop in concentration (cf. Fig. S2, ESI†). Dillert et al. used this method to calculate the Langmuir adsorption isotherm of NO on P25.33 The amounts of adsorbed NO normalized to the geometrical surface area for the two experimental series are listed in the ESI† (Tables S7 and S8) and illustrated in Fig. 5.
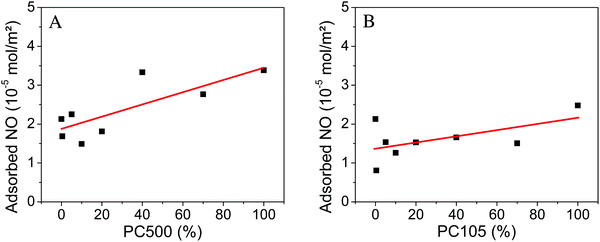 | ||
| Fig. 5 Adsorbed nitric oxide normalized to the geometrical surface area on PC500 (A) and PC105 (B) mixed with Kronos1001 (the linear fits in red are a guide to the eye). | ||
For samples containing PC500 a small increase of the amount of adsorbed NO from 2.1 × 10⁻⁵ mol m−2 for pure Kronos1001 to 3.4 × 10⁻⁵ mol m−2 for pure PC500 is observed. The sample with 40% PC500 shows the second highest value with 3.3 × 10⁻⁵ mol m−2. The experimental series with PC105 displays a much smaller increase of the adsorbed amount of NO from 2.1 × 10⁻⁵ mol m−2 for pure Kronos1001 to 2.5 × 10⁻⁵ mol m−2 for PC105. The sample with 0.4% PC105 showed the smallest amount of adsorbed NO with 0.8 × 10⁻⁵ mol m−2.
Similar to the amount of adsorbed NO, the adsorbed acetaldehyde concentration on the powder surface was calculated from the adsorption peaks of the respective measurement. The results are given in Table 5.
| Material | Amount of adsorbed acetaldehyde (mol m−2) | Amount of adsorbed NO (mol m−2) |
|---|---|---|
| PC500 | 3.3 × 10⁻¹ | 3.4 × 10⁻⁵ |
| PC105 | 2.1 × 10⁻¹ | 2.5 × 10⁻⁵ |
| Kronos1001 | 2.2 × 10⁻¹ | 2.1 × 10⁻⁵ |
The apparent adsorption of acetaldehyde on the surface of the TiO2 powders is several orders of magnitude larger than the adsorption of NO on the same surface. Moreover, there is a good correlation between the BET surface area of the powder samples and the acetaldehyde adsorption. However, Barteau, Kim and Idris have reported in 1993 that acetaldehyde easily forms crotonaldehyde on dark and dry TiO2 surfaces.34,35 Recent studies of Melchers showed that a high relative humidity drastically reduces the formation of crotonadehyde on the TiO2 surface.36 To avoid the corresponding overestimation of the adsorbed acetaldehyde concentration the relative humidity was kept constant between 40 and 50% during the degradation of acetaldehyde.
3.5. Laser-flash-photolysis-spectroscopy
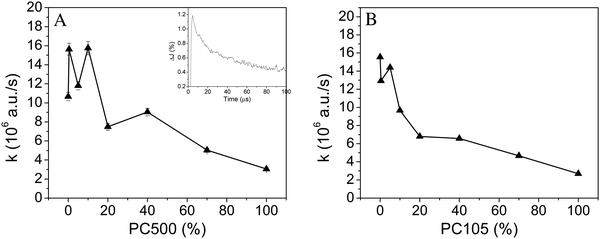
Second order decay functions are frequently applied to fit transient absorption signals observed following a bandgap laser flash excitation of a photocatalyst powder sample.14 Therefore, the transient reflectance signals observed following excitation of the mixed powder sample with λex = 355 nm were analyzed at 500 nm employing eqn (5). The fitted second order decay constants k for the synthesized TiO2 series are shown in Fig. 6. Illustrations for all fitting parameters and fitted decay constants are given in the ESI† (Fig. S9 and S10).For both experimental series a smaller decay constant k was observed for samples with a higher content of small particles. Pure Kronos1001 showed a recombination constant of 15 × 106 a.u. s−1, while for PC105 and PC500 reduced values of 3 × 10⁶ a.u. s−1 have been obtained, respectively. The values were confirmed by the analysis of the wavelengths 460 nm and 540 nm, which gave similar results. Accordingly, the lifetime of the charge carrier signal is longer for samples compromising a higher amount of small particles. In 2008 Tang et al. reported that the lifetime of the trapped charge carriers depends on the excitation energy.37 The authors observed that at higher excitation energies (2.5–10 mJ per pulse) the photogenerated electrons and holes show rapid non-geminate recombination, while they observed rate constants around 1 × 10⁵ a.u. s−1 for low excitation energies of 350 μJ cm−2. The second order decay constants observed here are larger than the latter values reported by Tang et al., which can be explained by the higher excitation energy of 2 mJ cm−2 used here rather than 350 μJ cm−2. On the other hand, the results (3–15 × 106 a.u. s−1) reported here are in good agreement with the charge carrier recombination constants observed for diluted nanoparticulate TiO2 in aqueous suspensions of 1.3 × 10⁷ a.u. s−1 reported by Bahnemann et al. after laser excitation with 10 mJ per shot.38
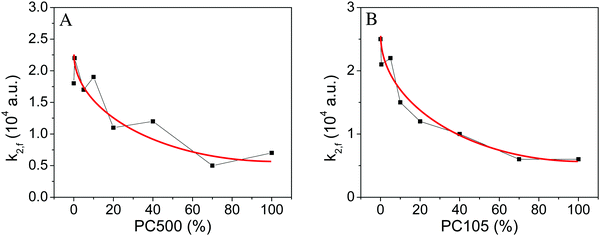
When the transient absorption signals at 500 nm were analyzed employing the fractal rate fit function tendencies similar to the analysis with second order fit functions are observed for the addition of small particles (cf.Fig. 6 and 7).
Application of the fractal fit with a free fractal parameter results in an average fractal rate constant of 0.61. All respective fitting parameters are shown in the ESI† (S11 and S12). However, the studies of Toussaint and Wilczek revealed a fractal rate constant of 0.5, for the idealized case of a bimolecular reaction on square lattices at long times.39 Similarly, a t−1/2 dependence of the second-order rate coefficient was reported by Grela and Colussi.40 Therefore, a fractal rate constant of 0.5 has been selected for the comparison of the different TiO2 samples.
A constant fractal dimension coefficient enables the systematic analysis of the change in the rate constant. This way the changes in the charge carrier decay rates only influence the rate constant, while changes in the fractal shape of the samples are not considered. All fitting parameters are shown in the ESI† (S13 and S14).
Fig. 7 illustrates that the highest fractal rate constant is observed for pure Kronos1001 (2.3 × 10⁴ a.u.), while pure PC500 and PC105 show the smallest rate constant (0.6 × 10⁴ a.u.). The rate constant kF decreases for samples with a higher percentage of small particles (PC500/PC105). This trend is similar to the second order rate constant also displaying a smaller rate constant for samples with a higher content of small particles. However, in contrast to the almost linear trend observed for the second order rate constant at higher loadings of small particles (cf.Fig. 6), the fractal rate constant shows a gradual reduction of the slope (cf. red line in Fig. 7). A larger drop of the fractal charge carrier recombination constant is observed for the samples containing small loading (0% to 20%) of small particles PC105 or PC500 in comparison to the samples with a higher content (40–100%) of small particles, which shows a smaller decay of the rate constant.
4. Discussion
4.1. Ultrasound synthesis and the structure of mixed TiO2
In the present study, the TiO2 particles with mixed particle sizes were prepared employing a two-step ultrasound treatment. The strong energy densities of more than 300 W L−1 lead to disaggregation of the small particles and allow the formation of agglomerates with a binary particle size distribution.29 The TEM images of the thus prepared materials show that small clusters of 1–30 particles were deposited on the surface of Kronos1001 particles. The intimate contact between the particles with different sizes should facilitate charge transfer between the particles.The ultrasound synthesis increased the photocatalytic activity of the samples for both, NO and acetaldehyde degradation (cf.Tables 2 and 3). This can be related to the ultrasound treatment in combination with the washing and discreet drying steps. The washing process removes undesired compounds from the surface of TiO2. These compounds represent residues of the technical synthesis of commercial TiO2. Usually traces of chloride, sulfate or phosphate are found in TiO2 powders from the chloride or sulfate process, respectively. The TiO2 powders utilized in this study were synthesized by the sulfate process. Sulfate and phosphate on the surface of TiO2 are known to reduce the photocatalytic activity, due to their strong coordination to the catalyst surface.41,42
4.2. Acetaldehyde vs. NO degradation
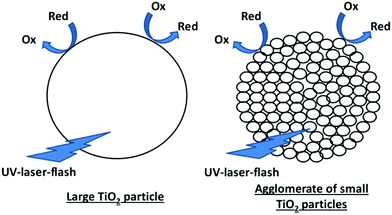
The degradation of acetaldehyde was nearly constant for all synthesized materials, including the pure basic materials Kronos1001, PC105 and PC500. This is an unexpected result, since Kronos1001 is a pigment consisting of very large particles exhibiting a small surface area, whereas PC105 and PC500 are small photocatalyst nanoparticles with a high surface area. Thus, for the degradation of acetaldehyde at the solid–gas interface a detectable variation of the activity for the different catalyst powders was expected. At first glance, the results could lead to the conclusion that the degradation of acetaldehyde is mainly the reaction of desorbed radicals in the gas phase independent of the surface area. Nevertheless, several publications show a beneficial effect of surface area on the photocatalytic degradation of acetaldehyde.43–46 Hence, we still suppose that acetaldehyde is adsorbed and degraded at the surface of TiO2 and that consequently the active surface area plays a key role in the photocatalytic degradation of gaseous molecules such as acetaldehyde.47,48 The detailed analysis of the TEM images reveals that the small TiO2 particles form larger agglomerates of particles in the samples containing mainly small TiO2. The size of the agglomerates of the smallest PC500 reaches the dimensions of the individual particles in Kronos1001. This formation of agglomerates explains the measured photocatalytic activities provided that in the course of the reaction acetaldehyde molecules are adsorbed, decomposed and desorbed only on the outer surface of the agglomerated particles (Fig. 8). Therefore, the active surface area for driving the reaction is quite similar for the three basic materials, even if the primary particle sizes vary by more than one order of magnitude.The results of the BET surface area measurement will be discussed in detail in Section 4.4 (vide infra). Another possible explanation for the similar photocatalytic activities could be a variation of the degradation mechanism of acetaldehyde on the three basic TiO2 materials. Unfortunately, the acetaldehyde degradation mechanism on TiO2 is still not completely understood.2 Hence, it cannot be ruled out that for different crystallographic TiO2 surfaces the degradation mechanism changes and that on each of the three commercial TiO2 particles another degradation mechanism is dominant. Hence, the photonic efficiencies would only accidentally be similar. Nonetheless, the results obtained for the removal of NO (cf.Fig. 3) also exhibit a rather limited influence of the particle size. Moreover, as discussed in Section 4.5., this observed change in activity can be related to the charge carrier lifetimes of the samples. Overall, this supports the suggested mechanism of the degradation of acetaldehyde and NO on the surface of agglomerated particles. The different degradation mechanisms and the resulting relationship with the charge carrier kinetics will be discussed in Section 4.5.
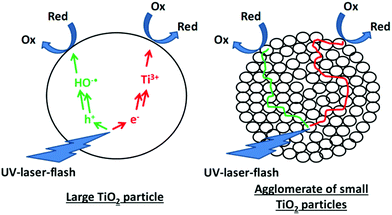 | ||
| Fig. 9 Charge transfer to adsorbed molecules in large TiO2 particles and synergetic charge transfer in TiO2 agglomerates following the antenna mechanism. | ||
In short, the similar behavior observed for large TiO2 particles and large TiO2 clusters of small particles can be taken as strong evidence for the beneficial charge transfer from the centre to the outer particles in the clusters.
4.3. Effects of the surface area
A linear increase of the BET-surface area with an increasing content of small particles was observed here (cf.Fig. 4). However, there is approximately no correlation between the determined photocatalytic activities (acetaldehyde and nitric oxide) and the BET surface area. Throughout the series of TiO2 powders prepared here the BET surface area changes by more than one order of magnitude (30-fold) without being accompanied by any similar variation of the respective photocatalytic activity. For the given experimental conditions, namely the gas phase degradation of NO and acetaldehyde, the BET surface area can therefore not be regarded as a good tool to describe the active surface area. During the measurement of the BET surface area, the samples were dried in a vacuum at high temperatures. This harsh procedure is necessary to remove adsorbed molecules, mainly water, which would interfere with the measurement. However, this drying process produces a different surface than that employed for the gas phase degradation experiments, where the samples were used as synthesized.The TEM images reveal that the smaller particles are agglomerated. The voids between the small particles are filled with water and its capillary forces keep the particles together. Transport of reagents is limited in the voids and thus between the center and the surface of the agglomerates. Hence, the agglomerated particles apparently do not possess large photocatalytically active surface areas as determined by the BET measurements (which just determine the N2-adsorption on the dry surface). A better system to judge the active surface area was obtained here by the measurement of the amount of adsorbed NO on the surface of the powder samples. In Fig. 10 these results are shown in correlation with the photonic efficiencies of the samples.
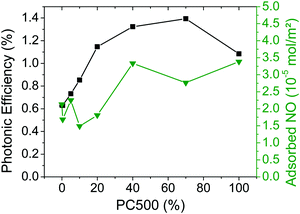 | ||
Fig. 10 Photonic efficiencies of NO degradation (■) and adsorbed amounts of NO ( ) for the synthesized TiO2 materials containing PC500 (data taken from Fig. 3 and 5). ) for the synthesized TiO2 materials containing PC500 (data taken from Fig. 3 and 5). | ||
Small amounts of adsorbed NO (1.5–2.2 × 10⁻⁵ mol m−2) are obtained for the samples containing small loadings of PC500. The small values represent small active surface areas for the degradation of NO. Samples with more than 40% of PC500 display slightly higher quantities of adsorbed NO (2.8–3.4 × 10⁻⁵ mol m−2). These results agree with the increase of the NO degradation for samples containing higher PC500 contents. Hence, it is obvious that a higher amount of adsorbed NO on the surface leads to a higher photocatalytic activity. Mixing of PC500 and Kronos1001 increases the active surface area. Especially, the sample with 40% PC500 exhibits the second largest quantity of adsorbed NO and shows one of the highest activity values for the photocatalytic NO degradation.
Fig. 11 illustrates the interdependence between the photonic efficiency and the amount of adsorbed NO for mixtures between PC105 and Kronos1001. Interestingly, for 0.4% PC105 a large drop in the active surface area and also in the photocatalytic activity is noted revealing the potential dependency of the two quantities. This sample exhibits the lowest amount of adsorbed NO (0.8 × 10⁻⁵ mol m−2) and also the lowest photonic efficiency (0.3%).
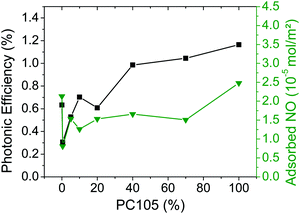 | ||
Fig. 11 Photonic efficiencies of NO degradation (■) and adsorbed amounts of NO ( ) for the synthesized TiO2 materials containing PC105 (data taken from Fig. 5 and 7). ) for the synthesized TiO2 materials containing PC105 (data taken from Fig. 5 and 7). | ||
In contrast to the series with PC500, the mixtures of PC105 and Kronos1001 showed only smaller active surface areas than pure Kronos1001. Only the sample with 100% PC105 had a slightly higher surface area. Nevertheless, the photonic efficiencies of the mixed samples increase with a higher content of small particles. Hence, for this series the active surface area for NO adsorption does not correlate with the respective photonic efficiencies.
Overall, the amount of adsorbed NO is several orders of magnitude smaller in comparison to the amount of adsorbed acetaldehyde (cf.Table 5). Hence, it remains questionable whether the degradation reactions occur mainly on the particle surface or in the gas phase by radicals released from this surface. According to Freitag et al., the visible light degradation of NO is mediated by a ligand to metal charge transfer (LMCT) complex of NO on the surface of TiO2.28 This LMCT evinces the large influence of the adsorption of NO on the mechanism of NO degradation. Nevertheless, the potential influence of the amount of adsorbed NO is not the only factor to be considered when assessing the degradation of NO on TiO2. In summary, a higher amount of adsorbed NO can be taken as a sign for a higher active surface area thus leading to an increase of the respective photonic efficiency. Nonetheless, such a dependency on the surface area does not explain the observed photocatalytic activities alone. The amount of adsorbed NO does not change much (2.1 × 10⁻⁵ mol m−2 for Kronos1001; 2.5 × 10⁻⁵ mol m−2 for PC105; 3.5 × 10⁻⁵ mol m−2 for PC500). Furthermore, the effective change of the active surface area differs for the two experimental series, while mixing of PC500 results in larger surface areas than that of Kronos1001, the active surface areas of mixtures with medium percentages of PC105 were slightly reduced.
4.4. Correlation of photonic efficiencies and charge carrier kinetics
In the present study, the charge carrier decay kinetics have been determined and analyzed at 500 nm following pulsed laser excitation at λex = 355 nm. The respective transient changes in reflectance were fitted by second order fit functions with baseline adjustment (eqn (5)) and according to fractal charge carrier kinetics (eqn (6)), respectively. Both approaches revealed similar trends. It has recently been reported that the fractal kinetics fit is a versatile tool for the analysis of the charge carrier kinetics of TiO2 in a selected time domain employing a laser energy density of 2 mJ cm−2.15 Furthermore, the fractal kinetics analysis is able to successfully fit the experimental curves without the need of an additional baseline. Therefore, the fractal rate constants kF are considered as being more reliable for easier comparison of the samples. But the discussed trends are also observed employing the second order fit with baseline.Under the experimental conditions employed here, namely the observation of long living transient signals in the micro- to millisecond region under a nitrogen atmosphere, only deeply trapped charge carriers are apparently present. In the absence of any reactants these deeply trapped charge carriers are considered only to react through random recombination with each other. Hence, the lifetime of the deeply trapped electrons is equal to the lifetime of deeply trapped holes. This concept of binary recombination was reported by Schneider revealing the same decay constant for trapped electrons and holes in TiO2 in the microsecond time domain.50 Accordingly, the observation of just one charge carrier species is sufficient to analyze the overall charge carrier kinetics.
The degradation of acetaldehyde displayed no change in activities in course of the two tested mixed TiO2 series. As discussed in Section 4.2., the complex degradation mechanism of acetaldehyde could lead to incidentally similar photocatalytic activities for the different TiO2 samples. Nevertheless, the main difference between NO and acetaldehyde observed in this study is the strong adsorption of acetaldehyde on the TiO2 surface in contrast to the rather weak adsorption of NO. Table 5 illustrates that the amount of adsorbed acetaldehyde on the surface is more than three order of magnitude higher than the amount of adsorbed NO (Fig. 5). Hence, one explanation for the missing impact of the charge carrier kinetics on the yield of the acetaldehyde degradation might be that this reaction is initiated by a direct oxidation of acetaldehyde by valence band holes. The degradation of NO, on the other hand, can be carried out on the surface or in the gas phase by photogenerated holes or electrons.51–53 In the microsecond time regime analyzed by the transient spectroscopy the long living deeply trapped charge carriers are observed.14 These deeply trapped charge carriers can be regarded as Ti3+ centers (trapped electrons) and surface OH˙ (trapped holes), respectively.1 However, the charge transfer to adsorbed acetaldehyde molecules seems to proceed much faster. Hence, the photocatalytic degradation of acetaldehyde is independent of the lifetime of trapped charge carriers studied under an inert gas atmosphere.
However, the degradation of nitric oxide displays a strong correlation with the inverse fractal rate constant representing a feasible tool to quantify the charge carrier lifetime (Fig. 12). The half-life of a pure second order process could be calculated according to  .
.
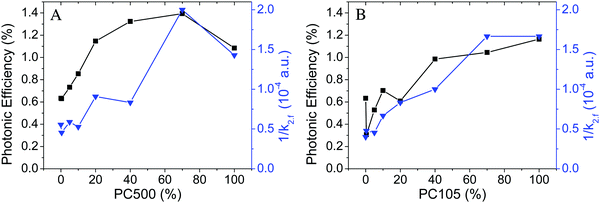 | ||
Fig. 12 Photonic efficiencies of NO degradation (■) and inverse fractal rate constants k2,f at 500 nm ( ) for the synthesized TiO2 materials containing PC500 (A) and PC105 (B) mixed with Kronos1001 (data taken from Fig. 3 and 7). ) for the synthesized TiO2 materials containing PC500 (A) and PC105 (B) mixed with Kronos1001 (data taken from Fig. 3 and 7). | ||
Samples with an increased content of PC500 display larger photonic efficiencies and smaller fractal rate constants than pure Kronos1001. The mixture of 70% of PC500 with Kronos1001 displays the highest photonic efficiency and the smallest rate constant of all tested samples. Subsequently, mixing of PC500 and Kronos1001 increases the photocatalytic activity of the mixture and the synthesized material outperforms the pure materials. These results indicate an effect of the binary particle size distribution on the photonic efficiency of the TiO2 samples synthesized here. Moreover, a strong correlation of photonic efficiency and the inverse fractal rate constant was identified. Samples with a high photocatalytic activity display a low charge carrier recombination rate as indicated by the inverse fractal rate constant. Interestingly, a small content of small particles between 40 and 70% is sufficient to reduce the charge carrier recombination rate to achieve the same photocatalytic activity as that of pure and more expensive PC500.
Fig. 12B shows that the results obtained for PC500 can also be applied on mixtures with PC105. The NO degradation obtained for samples with PC105 correlates well with the charge carrier lifetime represented by the inverse fractal rate constant. Higher photonic efficiencies are observed upon raising the percentage of PC105 from 0% to 100%, while the inverse rate constant of the charge carrier recombination grows accordingly. The comparison of the samples with the highest and the lowest content of PC105 reveals that an increase of the photonic efficiency by a factor of 2 correlates with a rise of the inverse fractal rate constant of 200% (0.5 × 10⁻⁴ a.u. to 1.5 × 10⁻⁴ a.u.). Similar to PC500 small quantities (20–40%) of small PC105 particles reduce the charge carrier recombination effectively resulting in high photocatalytic activities.
If the second order rate constant is employed instead of the fractal rate constant comparable trends are observed. The corresponding graphs are shown in the ESI† (Fig. S15). However, the photonic efficiency and inverse fractal rate constant display a slightly stronger correlation. This is evidence for the beneficial characteristics of the fractal kinetics fit in contrast to the second order fit function.
The beneficial charge transfer in the agglomerated TiO2 particles following the antenna mechanism (vide supra) readily explains the beneficial photocatalytic activities of samples with a mixed particle size distribution. Especially, the high photonic efficiencies observed for mixtures with more than 20% PC105 or PC500 can be related to the long charge carrier lifetimes. Some of the mixed samples actually showed the highest NO degradation yields in our experiments. The charge transfer between small and large TiO2 particles can moreover explain the increased NO degradation efficiency on the powder surface. This charge carrier transfer could support the charge carrier separation and enhance the photocatalytic activity of the samples with a binary particle size distribution.
Fig. 13 illustrates the dependence of the photocatalytic activity on the charge carrier lifetime. Samples with a high content of small particles exhibit longer charge carrier lifetimes under inert conditions and higher photonic efficiencies. These experimental results are also supported by theoretical calculations.18 The large domain size in large TiO2 particles increases the bulk recombination of the charge carriers. Moreover, the large BET surface area of the small particles facilitates an effective charge carrier trapping. Consequently, a drop of the charge carrier recombination rate below 50% is observed in small particle samples (PC105 and PC500), which also shows twice the photonic efficiency for NO degradation.
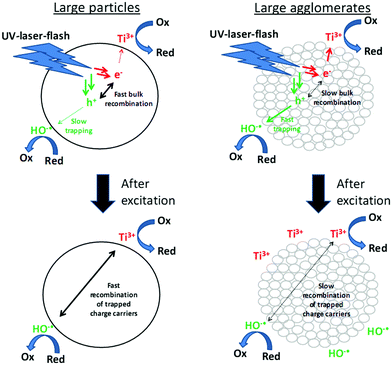 | ||
| Fig. 13 Correlation of the charge carrier lifetime and degradation efficiency of adsorbed nitric oxide. | ||
Correlation of higher photocatalytic activities with longer charge carrier lifetimes has previously been observed by time resolved microwave conductivity experiments and phenol degradation in TiO2 suspensions by Alaoui et al.54 Similar correlations were not possible for the photocatalytic degradation of rhodamine B, which was explained by a higher adsorption of rhodamine B on TiO2. These results are in good agreement with the effects of the surface area and charge carrier lifetime on the NO and on the acetaldehyde degradation, respectively, obtained in this study. Like rhodamine B acetaldehyde is strongly adsorbed on the surface of TiO2 and no correlation of the charge carrier lifetime and photocatalytic activity could be detected. NO is only weakly adsorbed on the surface and the observed NO degradation shows good correlation with the charge carrier kinetics. Nevertheless, a higher amount of adsorbed NO still facilitates the direct transfer of charge carriers and the fast degradation of NO. However, due to the weak adsorption of NO, the effect of surface area observed in this study is small, while the effect of the charge carrier lifetime detected throughout these experiments is strong. A longer charge carrier lifetime leads to a higher population of trapped charge carriers like OH˙ radicals and O2−˙ radicals on the surface of the TiO2 samples thus increasing the removal of NO.
To draw a complete picture of the photocatalytic processes on the particle surface, one has to consider the active surface areas and the charge carrier lifetimes. Boujday et al. have already related this behavior to the simple model of photocatalysis being determined by two subdivisions the photo part (charge carrier generation and kinetics) and the catalysis part (surface radical formation).55 Only the combination of both effects can explain the beneficial effect of mixing PC500/PC105 with Kronos1001.
5. Conclusions
In this study, two series of TiO2 mixtures with a binary particle size distribution were prepared using a simple two-step ultrasound process. The average particle size was adjusted by mixing of TiO2 powder samples instead of the directed synthesis of powder samples with uniform particle sizes. The results indicate that the approach represents a facile way to tune the properties of the semiconductor powder samples, such as charge carrier kinetics and photocatalytic activity. However, the small particles, which formed large agglomerated TiO2 clusters, and large single TiO2 particles displayed rather small changes in the photocatalytic activity. These results have been related to nearly identical active surface areas of the samples due to the formation of agglomerates, being non equivalent to the huge changes in the BET-surface area (11–309 m2 g−1). Consequently, no correlation between the removal of NO and the BET surface area was observed. Furthermore, the adsorbed amount of NO on the surface of the powder samples was identified as a better indicator for the active surface area of the samples than the BET surface area. Larger amounts of NO on the surface caused a higher photocatalytic activity. In addition to the change in the surface area, a slower charge carrier recombination in the TiO2 samples containing high percentages of small particles could be identified by the fractal fit function. The faster recombination of trapped charge carriers in larger particles explains the smaller photonic efficiencies of these samples (calculated from the NO degradation). The fractal model for the kinetic analysis of charge carrier recombination was applied for the first time on complex pure TiO2 samples. It was proved to be beneficial in comparison to the second order fit with a rather arbitrary baseline. In particular, the results of the photocatalytic NO degradation show a closer correlation with the fractal charge carrier recombination constant in comparison to the second order rate constant. All in all, NO degradation results of both TiO2 series could be explained by the combination of the charge carrier lifetime and the active surface area. The absence of any influences of the charge carrier lifetime on the degradation of acetaldehyde, on the other hand, was related to the direct oxidation of acetaldehyde via valence band holes.Abbreviations
| NO | Nitric oxide |
| TiO2 | Titanium dioxide |
| PTFE | Polytetrafluoroethylene |
| SE | Standard error |
| ABS | Absorption |
| OX | Oxidized species |
| RED | Reduced species |
Author contributions
All authors have given approval to the final version of the manuscript.Conflicts of interest
There is no conflict to declare.Acknowledgements
We acknowledge the financial support from the Federal Ministry of Education and Research (BMBF) Project “PureBau” No. 13N13350. Moreover, we thank KRONOS International, Inc. and Cristal for the TiO2 powders and the Laboratory of Nano and Quantum Engineering (LNQE) for providing TEM equipment. F. Sieland acknowledges support from the Foundation of German Business (sdw).References
- J. Schneider, M. Matsuoka, M. Takeuchi, J. Zhang, Y. Horiuchi, M. Anpo and D. W. Bahnemann, Chem. Rev., 2014, 114, 9919–9986 CrossRef CAS PubMed.
- Z. Topalian, B. I. B. Stefanov, C. G. C. Granqvist and L. Österlund, J. Catal., 2013, 307, 265–274 CrossRef CAS.
- N. Serpone, D. Lawless, R. Khairutdinov and E. Pelizzetti, J. Phys. Chem., 1995, 99, 16655–16661 CrossRef CAS.
- F. Wilkinson and G. P. Kelly, in Studies in Surface Science and Catalysis, ed. T. Matsuura and M. Anpo, 1989, vol. 47, pp. 30–47 Search PubMed.
- R. B. Draper and M. A. Fox, Langmuir, 1990, 6, 1396–1402 CrossRef CAS.
- T. Yoshihara, R. Katoh, A. Furube, Y. Tamaki, M. Murai, K. Hara, S. Murata and H. Arakawa, J. Phys. Chem. B, 2004, 108, 3817–3823 CrossRef CAS.
- H. G. Baldoví, B. Ferrer, M. Álvaro and H. García, J. Phys. Chem. C, 2014, 118, 9275–9282 Search PubMed.
- F. Le Formal, S. R. Pendlebury, M. Cornuz, S. D. Tilley, M. Grätzel and J. R. Durrant, J. Am. Chem. Soc., 2014, 136, 2564–2574 CrossRef CAS PubMed.
- A. J. Cowan and J. R. Durrant, Chem. Soc. Rev., 2013, 42, 2281–2293 RSC.
- Y. Murakami, J. Nishino, T. Mesaki and Y. Nosaka, Spectrosc. Lett., 2011, 44, 88–94 CrossRef CAS.
- Y. Tamaki, A. Furube, R. Katoh, M. Murai, K. Hara, H. Arakawa and M. Tachiya, C. R. Chim., 2006, 9, 268–274 CrossRef CAS.
- B. Ohtani, R. M. Bowman, D. P. Colombo Jr., H. Kominami, H. Noguchi and K. Uosaki, Chem. Lett., 1998, 579–580 CrossRef CAS.
- M. R. Hoffmann, S. T. Martin, W. Choi and D. W. Bahnemann, Chem. Rev., 1995, 95, 69–96 CrossRef CAS.
- A. Furube, T. Asahi, H. Masuhara, H. Yamashita and M. Anpo, J. Phys. Chem. B, 1999, 103, 3120–3127 CrossRef CAS.
- F. Sieland, J. Schneider and D. W. Bahnemann, J. Phys. Chem. C, 2017, 121, 24282–24291 CAS.
- J. Ryu and W. Choi, Environ. Sci. Technol., 2008, 42, 294–300 CrossRef CAS PubMed.
- S. T. Martin, H. Herrmann, W. Choi and M. R. Hoffmann, J. Chem. Soc., 1994, 90, 3315–3322 CAS.
- B. Liu and X. Zhao, Electrochim. Acta, 2010, 55, 4062–4070 CrossRef CAS.
- A. G. Agrios and P. Pichat, J. Photochem. Photobiol., A, 2006, 180, 130–135 CrossRef CAS.
- Z. Li, R. Liu and Y. Xu, J. Phys. Chem. C, 2013, 117, 24360–24367 CAS.
- L. Gao and Q. Zhang, Scr. Mater., 2001, 44, 1195–1198 CrossRef CAS.
- S. Horikoshi, H. Tsutsumi, H. Matsuzaki, A. Furube, A. V. Emeline and N. Serpone, J. Mater. Chem. C, 2015, 3, 5958–5969 RSC.
- A. Yamakata, T. Ishibashi and H. Onishi, J. Phys. Chem. B, 2001, 105, 7258–7262 CrossRef CAS.
- T. Hirakawa and Y. Nosaka, Langmuir, 2002, 18, 3247–3254 CrossRef CAS.
- A. Engel, R. Dillert and D. W. Bahnemann, J. Adv. Oxid. Technol., 2015, 18, 195–203 CAS.
- V. C. Papadimitriou, V. G. Stefanopoulos, M. N. Romanias, P. Papagiannakopoulos, K. Sambani, V. Tudose and G. Kiriakidis, Thin Solid Films, 2011, 520, 1195–1201 CrossRef CAS.
- ISO 22197-1: 2007, Fine Ceramics (Advanced Ceramics, Advanced Technical Ceramics) – Test Method for Air-Purification Performance of Semiconducting Photocatalytic Materials – Part 1: Removal of Nitric Oxide, 2007 Search PubMed.
- J. Freitag, A. Domínguez, T. A. Niehaus, A. Hülsewig, R. Dillert, T. Frauenheim and D. W. Bahnemann, J. Phys. Chem. C, 2015, 119, 4488–4501 CAS.
- F. Sieland, J. Schneider, T. Lippmann and D. W. Bahnemann, Proc. SPIE, 2016, 9935, 99350G1 CrossRef.
- M. Nuño, R. J. Ball and C. R. Bowen, in Semiconductor Photocatalysis – Materials, Mechanisms and Applications, ed. W. Chao, 2016, pp. 613–634 Search PubMed.
- M. Keulemans, S. W. Verbruggen, B. Hauchecorne, J. A. Martens and S. Lenaerts, J. Catal., 2016, 344, 221–228 CrossRef CAS.
- J. Z. Bloh, A. Folli and D. E. Macphee, RSC Adv., 2014, 4, 45726–45734 RSC.
- R. Dillert and A. Engel, Phys. Chem. Chem. Phys., 2013, 15, 20876–20886 RSC.
- S. Luo and J. L. Falconer, Catal. Lett., 1999, 57, 89–93 CrossRef CAS.
- H. Idriss, K. S. Kim and M. A. Barteau, J. Catal., 1993, 139, 119–133 CrossRef CAS.
- S. Melchers, J. Schneider and D. W. Bahnemann, unpublished work.
- J. Tang, J. R. Durrant and D. R. Klug, J. Am. Chem. Soc., 2008, 130, 13885–13891 CrossRef CAS PubMed.
- D. W. Bahnemann, M. Hilgendorff and R. Memming, J. Phys. Chem. B, 1997, 101, 4265–4275 CrossRef CAS.
- D. Toussaint and F. Wilczek, J. Chem. Phys., 1983, 78, 2642–2647 CrossRef CAS.
- M. A. Grela and A. J. Colussi, J. Phys. Chem., 1996, 3654, 18214–18221 CrossRef.
- H. Y. Chen, O. Zahraa and M. Bouchy, J. Photochem. Photobiol., A, 1997, 108, 37–44 CrossRef CAS.
- D. Gumy, S. A. Giraldo, J. Rengifo and C. Pulgarin, Appl. Catal., B, 2008, 78, 19–29 CrossRef CAS.
- S. Kim and S. K. Lim, Appl. Catal., B, 2008, 84, 16–20 CrossRef CAS.
- D. B. Hamal and K. J. Klabunde, J. Colloid Interface Sci., 2007, 311, 514–522 CrossRef CAS PubMed.
- I. Sopyan, M. Watanabe, S. Murasawa, K. Hashimoto and A. Fujishima, J. Photochem. Photobiol., A, 1996, 98, 79–86 CrossRef CAS.
- B. Tryba, M. Tygielska, J. Orlikowski and J. Przepiórski, React. Kinet., Mech. Catal., 2016, 119, 349–365 CrossRef CAS.
- B. Ohtani, Catalysts, 2013, 3, 942–953 CrossRef CAS.
- A. O. T. Patrocinio, J. Schneider, M. D. França, L. M. Santos, B. P. Caixeta, A. E. H. Machado and D. W. Bahnemann, RSC Adv., 2015, 5, 70536–70545 RSC.
- C. Wang, R. Pagel, J. K. Dohrmann and D. W. Bahnemann, C. R. Chim., 2006, 9, 761–773 CrossRef CAS.
- J. Schneider, Nanosecond Laser Flash Photolysis Studies for the Elucidation of Photoinduced Processes in Different TiO2 Photocatalysts, Gottfried Wilhelm Leibniz University Hannover, 2016 Search PubMed.
- J. Chen and C. S. Poon, Build. Environ., 2009, 44, 1899–1906 CrossRef.
- M. M. Ballari, M. Hunger, G. Hüsken and H. J. H. Brouwers, Appl. Catal., B, 2010, 95, 245–254 CrossRef CAS.
- S. Laufs, G. Burgeth, W. Duttlinger, R. Kurtenbach, M. Maban, C. Thomas, P. Wiesen and J. Kleffmann, Atmos. Environ., 2010, 44, 2341–2349 CrossRef CAS.
- O. Tahiri Alaoui, A. Herissan, C. Le Quoc, M. E. M. Zekri, S. Sorgues, H. Remita and C. Colbeau-Justin, J. Photochem. Photobiol., A, 2012, 242, 34–43 CrossRef CAS.
- S. Boujday, F. Wünsch, P. Portes, J. F. Bocquet and C. Colbeau-Justin, Sol. Energy Mater. Sol. Cells, 2004, 83, 421–433 CrossRef CAS.
Footnote |
| † Electronic supplementary information (ESI) available. See DOI: 10.1039/c8cp00398j |
| This journal is © the Owner Societies 2018 |

