
 Open Access Article
 This Open Access Article is licensed under a
 Creative Commons Attribution 3.0 Unported Licence
Influence of Ce3+ polarons on grain boundary space-charge in proton conducting Y-doped BaCeO3
Jonathan M.
Polfus
 *,
Mehdi
Pishahang
and
Rune
Bredesen
*,
Mehdi
Pishahang
and
Rune
Bredesen
SINTEF Industry, Sustainable Energy Technology, P.O. Box 124 Blindern, Oslo, NO-0314, Norway. E-mail: jonathan.polfus@sintef.no
First published on 4th June 2018
Abstract
Defect segregation and space-charge formation were investigated for a (0 2 1)[1 0 0] symmetric tilt grain boundary in Y-doped BaCeO3. Density functional theory calculations according to the PBE+U formalism were used to calculate segregation energies for protons, oxygen vacancies and Y-acceptor dopants from the bulk to the grain boundary core. Defect concentration and potential profiles across the grain boundary were obtained from thermodynamic space-charge models. Oxygen vacancies were found to exhibit a particularly exothermic segregation energy of up to −1.66 eV while protons exhibited segregation energies in the range of −0.47 eV to −0.93 eV. The grain boundary was determined to be predominated by protons below 800 K in 3% H2O and the corresponding space-charge potential was 0.4–0.7 V under the Mott–Schottky approximation. The role of electronic defects in the space-charge properties was evaluated, and it was substantiated that electron conduction along the grain boundary could become evident under reducing conditions.
1. Introduction
Proton conducting ceramics within the acceptor doped BaZrO3–BaCeO3 system exhibit excellent ionic conductivity at intermediate temperatures1–3 and can be utilized in proton ceramic fuel cells (PCFC) and electrolyzer cells (PCEC),4,5 and electrochemical membrane reactors for steam methane reforming6 and dehydrogenation reactions.7 Zr-rich compositions display superior chemical stability in CO2-containing atmospheres, although recent reports have shown some extent of surface reactivity also in BaZrO3 by accommodating Ba-deficiency in the subsurface region.8,9Grain boundaries in the polycrystalline BaZrO3-based electrolytes have been found to exhibit reduced conductivity compared to bulk – a phenomenon ascribed to space-charge formation.10–16 Segregation of oxygen vacancies and protons –  and
and  in Kröger–Vink notation17 – to the structural interface, i.e., grain boundary core, yields a net positive charge of this region. Electroneutrality is maintained by formation of space-charge regions adjacent to the grain boundary core. The increased grain boundary resistance can be associated with the locally depleted concentration of protons in the space-charge regions. Proton mobility may also be reduced at the structurally distorted grain boundary core.18
Computational studies based on density functional theory (DFT) calculations and thermodynamic space-charge models have proven effective for understanding the fundamentals of coincident site lattice (CSL) type grain boundaries. In this respect, several studies on Y-doped BaZrO3 have shown that protons exhibit a particularly strong tendency for segregation to the grain boundary core.19–24 Similar interface properties have been obtained for BaZrO3 surfaces and heterointerfaces.25–28 Theoretically obtained space-charge potentials may exceed 1 V under the Mott–Schottky approximation, i.e., constant concentration of the acceptor dopant across the interface. However, equilibration of the Y-concentration profile may significantly reduce the potential by segregation and accumulation in the space-charge regions,19,26,27 in line with potentials and concentration profiles obtained experimentally.29,30
In comparison to cubic BaZrO3, proton segregation energies obtained for orthorhombic BaCeO3 have been found to be about half as exothermic for similar grain boundary structures.31,32 Lindman et al. related the lower segregation energies in BaCeO3 to a higher stability of protons in the bulk region due to stronger hydrogen bond formation, rather than a property of the grain boundary structure.32
In the present work, we further investigate space-charge formation at a (0 2 1)[1 0 0] tilt boundary in Y-doped BaCeO3. Particular emphasis is put on the multivalent nature of cerium which can attain a +3 charge state, i.e.,  , with a polaron formation energy of −0.78 eV relative to the conduction band.33 Under reducing conditions, the minority electron polarons may therefore accumulate in the core and/or space-charge regions and lower the space-charge potential.
2. Methodology
2.1 First-principles calculations
The DFT calculations were performed with projector augmented wave (PAW) pseudopotentials34 as implemented in VASP.35 The generalized gradient approximation functional due to Perdew, Burke, Ernzerhof (GGA-PBE) was used together with the Hubbard U correction according to the approach by Dudarev et al. (DFT+U).36,37 An effective on-site interaction parameter of U = 6 eV was used for Ce 4f in line with previous reports on BaCeO3 allowing for the localization of electrons as small Ce3+ polarons.38 The electrons explicitly treated as valence states were Ba (5s2 5p6 6s2), Ce (5s2 5p6 4f 5d 6s2) and O (2s2 2p4), while the Ce3+ (5s2 5p6 5d 6s2) pseudopotential was used for isolated Ce3+ polarons. For Ce3+ polarons associated with oxygen vacancies, initial structural relaxation was performed with the Ce3+ pseudopotential, and spin-polarization was employed for subsequent structural and electronic optimization. The plane wave energy cutoff was set to 400 eV and a Monkhorst–Pack k-point grid of 6 × 6 × 4 was used for the orthorhombic Pnma BaCeO3 unit cell (20 atoms). The relaxed cell parameters were a = 6.31 Å, b = 8.88 Å and c = 6.30 Å. Subsequent calculations were performed with fixed cell volume and shape, and the ionic positions were relaxed until the residual forces were smaller than 0.02 eV Å−1. The effective charge states of the point defects were imposed by adjusting the total number of electrons in the system.2.2 Grain boundary structure
The (0 2 1) [1 0 0] symmetric tilt boundary was constructed as a stoichiometric cell with a stoichiometric interface plane comprising two formula units (Fig. 1). The axis perpendicular to the grain boundary was optimized with respect to interface energy in incremental steps of 0.1 Å. Due to the periodic boundary conditions, the cell contained two identical interfaces which were separated by 11 Ba/Ce layers (22.2 Å). Defect calculations were performed in a supercell containing 480 atoms (12.63 Å × 15.41 Å × 44.45 Å) with Γ-point sampling. The difference in segregation energies obtained with 2 × 2 × 1 k-point sampling was within 1.5–4.5 meV for and
and  and up to 0.1 eV for
  .
.
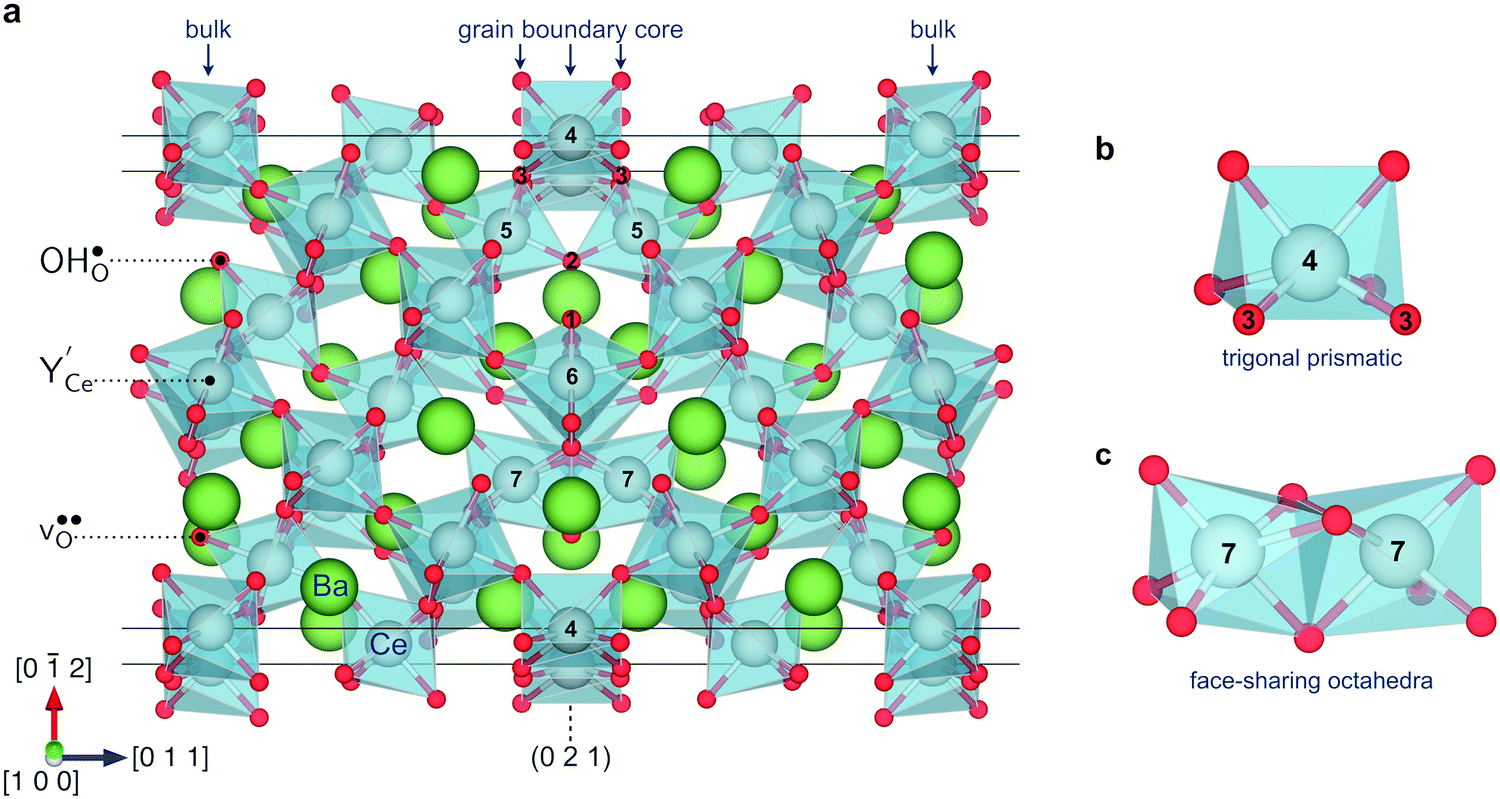 | ||
| Fig. 1 Relaxed structure of the (0 2 1)[1 0 0] boundary (half width of the 240 atom cell) showing the defect sites in bulk and grain boundary layers (a), and distorted Ce coordination environments in the boundary core (b and c). | ||
2.3 Space-charge model
Defect segregation energies, ΔEsegi, were calculated as the total energy difference for the defect between the interface sites and the bulk region within the same cell, i.e., 4 to 6 atomic layers from the closest interface. The considered defects were ,
,  ,
,  ,
,  and
and  . With several non-equivalent sites in the bulk region, the most stable defect site was used for calculating the segregation energy. For the interface, the most stable defect sites were fully relaxed in the supercell after initial calculations.
The defect segregation energies were used as input to a thermodynamic space-charge model based on a constant electrochemical potential of all species across the interface and a global electroneutrality condition.12,39–42 A relative dielectric constant of 30 was used.32 Further details on the approach used in the present work can be found in ref. 19. The point defect concentrations in bulk were described according to a fixed Y-acceptor concentration of 0.10, and the hydration reaction which describes the relative concentrations of oxygen vacancies and protons
 | (1) |
The bulk concentrations of minority electrons and holes were taken from He et al. based on the electrical measurements of a BaCe0.85Gd0.15O3−δ single crystal as a function of oxygen partial pressure, pO2.43Table 1 lists the corresponding thermodynamic parameters used to obtain the bulk defect concentrations. The defects were generally treated within the dilute concentration limit while restrictions were imposed for the maximum defect concentrations in the core (cf. Section 3.2). An approach for treating concentrated solutions has been provided by Mebane et al. based on the Poisson–Cahn theory applied to CeO2-based electrolytes.44
![[thin space (1/6-em)]](https://www.rsc.org/images/entities/char_2009.gif)
3. Results and discussion
3.1 Grain boundary structure
Fig. 1 illustrates the relaxed structure of the (0 2 1)[1 0 0] grain boundary. The interface contains two coordination environments that differ considerably from the bulk corner sharing octahedral coordination: trigonal prismatic coordination (Fig. 1b) and face-sharing octahedra (Fig. 1c). The optimized [1 0 2] axis corresponded to an expansion of 0.45 Å per grain boundary. The grain boundary energy was 0.036 eV Å−2 (0.58 J m−2), which is slightly lower than the energy obtained for the (1 2 0)[0 0 1] boundary, 0.038 eV Å−2.32 These grain boundaries exhibit different coordination environments around Ce6 and Ce7 (Fig. 1a) although the Pnma [1 0 0] and [0 0 1] directions differ only in the type of octahedral tilting.3.2 Defect segregation energies
Fig. 2 shows the relaxed structures of oxygen vacancies at the most stable sites in the grain boundary core. The O1 site was found to be particularly favorable and vacancies introduced on neighboring sites relaxed to the O1 sites (Fig. 2c). Introduction of the vacancies was not accompanied by considerable relaxation of the surrounding lattice, apart from slight tilting of the polyhedra. Fig. 3 shows the structure and electron charge-density of polarons associated with the oxygen vacancies, i.e., . In the case of the O1 vacancy, the excess charge predominantly localized on Ce6 while some charge localized on Ce7 further from the vacancy (Fig. 3a). The polaron localized on Ce5 in the case of the O2 vacancy (Fig. 3b) and on the two Ce adjacent to the vacancy in bulk (Fig. 3c). The Ce–O bond lengths increased by 5% upon localizing the polarons.
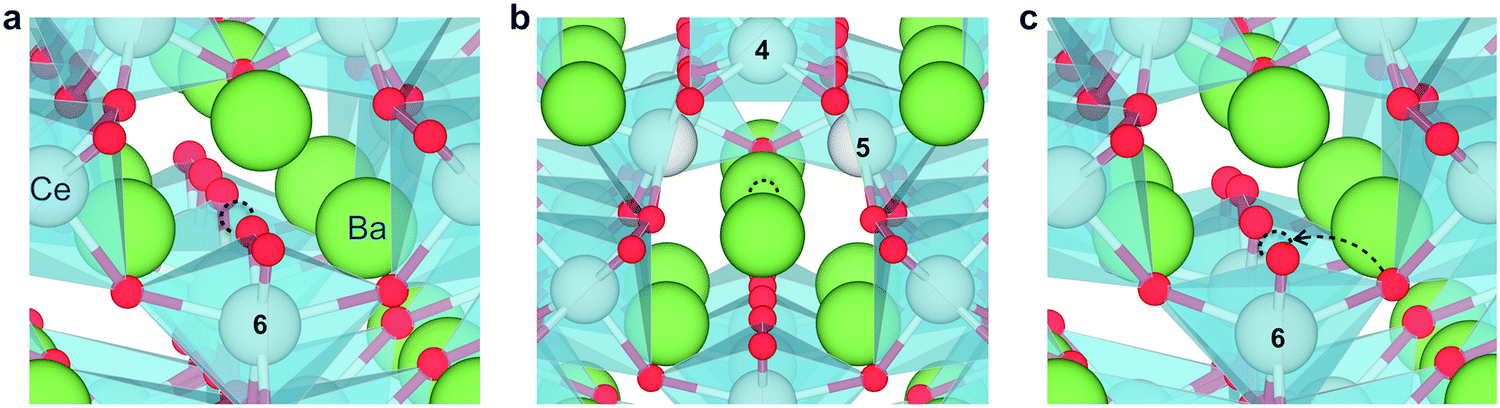 | ||
| Fig. 2 Relaxed structure of oxygen vacancies shown as a dashed outline on sites O1 (a) and O2 (b), and the relaxation path of a vacancy to the O1 site from an initial adjacent site (c). | ||
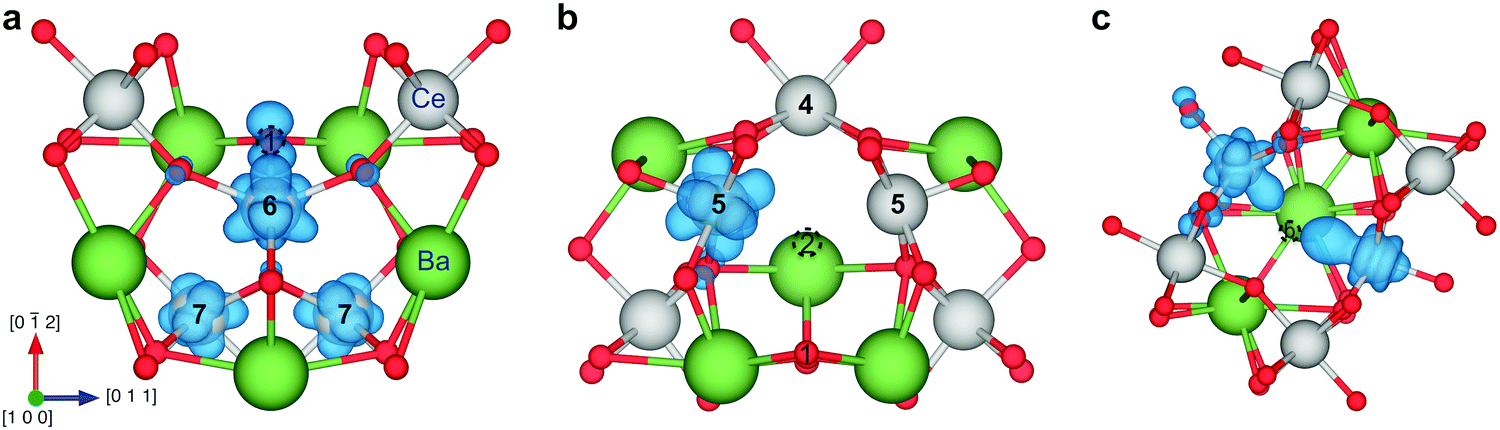 | ||
| Fig. 3 Spin-density isosurfaces of an electron polaron associated with an O1 vacancy (a), an O2 vacancy (b) and a bulk oxygen vacancy (c). The isosurfaces display distinct f-orbital shapes. | ||
Fig. 4 shows the relaxed structures for protons at the most stable sites at the grain boundary core. In all cases, the proton relaxed towards open spaces in the core and towards neighboring oxide ions to form hydrogen bonds. The O–H bond length remained essentially unchanged at about 1.02 Å, while the bond lengths to neighboring oxide ions, 1.56–1.79 Å, were smaller than that in bulk, 1.93 Å.
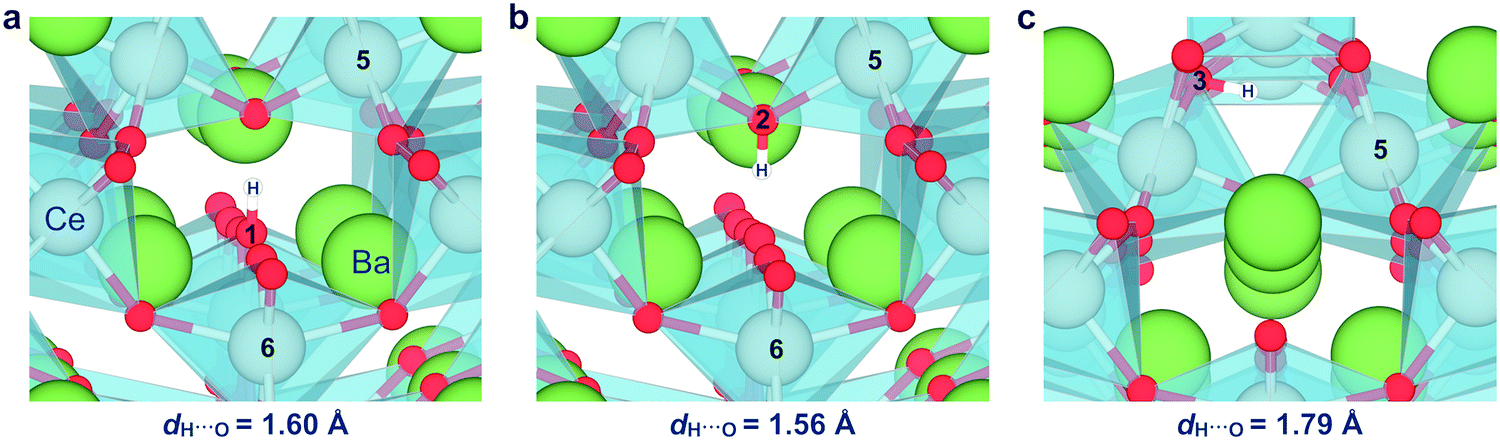 | ||
| Fig. 4 Relaxed structure of protons associated with the O1 (a), O2 (b), and O3 (c) oxide ions in the grain boundary core, including the bond length to the neighboring oxide ion. | ||
Table 2 shows the segregation energies for the most stable defect configurations. Oxygen vacancies exhibited the most exothermic segregation energy of −1.66 eV, which is similar to the (1 0 2)[0 0 1] boundary, −1.74 eV.32 The vacancy segregation energies were essentially unchanged with accompanying polarons in the form of 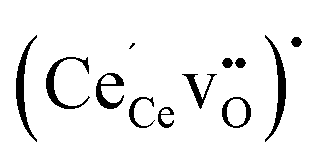 . Notably, the segregation energies of
  to the O1 and O2 sites, −0.93 and −0.83 eV, respectively, were considerably more exothermic than the reported value for the (1 0 2)[0 0 1] boundary, −0.51 eV.32 The O1 site is under-coordinated to Ce relative to the doubly coordinated oxide ion sites in corner sharing octahedra (Table 2). In combination with Ce6 being coordinated to two O1, this may explain the particularly exothermic segregation energies for effectively positive defects to the O1 site. Neither
  or
or  was particularly stable associated with the trigonal prismatic or face-sharing oxide ion sites shown in Fig. 1. In the case of
  , the segregation energies were mostly positive except for the face-sharing Ce7 site. In comparison,
 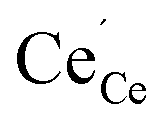 polarons exhibited quite favorable segregation energies of −0.28 eV and −0.48 eV to the fully coordinated Ce4 and Ce7 sites relative to a fully coordinated bulk site. However, due to the strong binding energy of −0.44 eV for
  in bulk,33 the appropriate segregation energies for acceptor doped materials were taken as 0.16 eV and −0.04 eV for the Ce4 and Ce7 site, respectively. Furthermore, due to the favorable oxygen vacancy segregation energies adjacent to Ce5 and Ce6, the most relevant Ce3+ polaron segregation energy was in the form of
  . The segregation energies of Ce3+ were therefore 0.04 eV and 0.03 eV for Ce5 and Ce6, respectively, since segregation of
  was considered separately (Table 2). Association between polarons and protons was not considered due to their relatively low binding energy of −0.05 eV in bulk.33
| Defect | Site | Multiplicity | Coordination | ΔEsegi/eV |
|---|---|---|---|---|

|
O1 | 3 | 1 Ce | −1.66 |
| O2 | 1 | 2 Ce | −0.84 | |

|
O1/Ce6 | 3 | 1 Ce | −1.63 |
|
O2/Ce5 | 1 | 2 Ce | −0.80 |

|
O1 | 3 | 1 Ce | −0.93 |
| O2 | 1 | 2 Ce | −0.83 | |
| O3 | 4 | 2 Ce | −0.47 | |

|
Ce4 | 1 | 6 O | 0.16/−0.28 |
| Ce5 | 2 | 6 O | 0.14/0.17 | |
| Ce6 | 1 | 6 O | 0.56/0.31 | |
| Ce7 | 2 | 6 O | −0.08/−0.48 | |
For the oxide ion sites in the core, upper limits on the defect occupancy were imposed based on the local coordination environment. In particular, protons associated with neighboring oxide ions would otherwise reside in the same region, e.g., O1 and O2 sites in Fig. 4. The total defect occupancy was limited to half for the O1 and O3 sites while full occupancy was allowed for the structurally isolated O2 site.
3.3 Space-charge properties
Fig. 5 shows the calculated defect concentrations in the grain boundary core and as a function of distance from the boundary at 873 K and 3% H2O in air. Under these conditions, the Y-acceptors in bulk are mainly charge compensated by . The core attains a net positive charge due to excess concentrations of
  and
and  , and the resulting potential of 0.74 V extends about 1.5 nm into the space-charge regions. The core is predominated by
  due to the large exothermic segregation energy to the O1 site (Table 2) resulting in a concentration of 0.50 site fraction according to the defined saturation limit. Protons compete for the same oxide ion sites and exhibit concentrations of 0.18, 0.16 and 4.3 × 10⁻⁴ site fraction for the O1, O2 and O3 sites, respectively. Electron polarons display a quite significant accumulation in the space-charge region, and core concentration close to the bulk hole concentration despite the oxidizing atmospheric conditions.
 | ||
| Fig. 5 Defect concentrations and potential in the grain boundary core and as a function of distance in the space-charge region. The core concentrations are averages for the sites in Table 2. | ||
Fig. 6 shows the calculated defect concentrations in the grain boundary core as a function of temperature as well as the corresponding space-charge potential. At the lowest temperatures, the core is saturated by  on the O1 and O2 sites, while the
  site fraction was 3.8 × 10⁻² for the O3 site. The core gradually dehydrates with increasing temperature, which results in a higher potential due to the higher core charge as
  is exchanged with
  . In contrast to several studies on BaZrO3 grain boundaries, the core becomes mainly dehydrated at a lower temperature (805 K) than bulk (1000 K).19–21,32 The space-charge potential exhibits a maximum at about 873 K as the O1 site becomes saturated by
  while the total core charge is reduced at higher temperatures since the concentration of
  becomes lower on the O2 and O3 sites. The concentration of the electronic defects in the core remains negligible in terms of the overall core charge.
 | ||
| Fig. 6 Defect concentrations in the grain boundary core and space-charge potential as a function of temperature. The core concentrations are averages for the sites in Table 2. | ||
Fig. 7 shows the core defect concentrations and space-charge potential as a function of oxygen partial pressure from highly reducing to highly oxidizing conditions at 873 K. Under the most reducing conditions, the electron polaron concentration in the core becomes significant in terms of charge compensation, i.e., within one order of magnitude of  , and the space-charge potential is lowered. Nevertheless, the lower core potential increases the stability of the effectively positive defects and the concentration of
  thereby increases on the O2 and O3 sites below pO2 = 10−18 bar as the electron concentration in the core increases.
 | ||
| Fig. 7 Defect concentrations in the grain boundary core and space-charge potential as a function of oxygen partial pressure. The core concentrations are averages for the sites in Table 2. | ||
At higher pO2, the space-charge potential remains fairly constant and the concentration of electron polarons in the core follows the same functional dependency as in bulk, i.e., pO2−1/4. Despite a bulk hole concentration of 10−4 per mole BaCeO3 at pO2 = 100 bar, depletion of holes in the space-charge region does not affect the space-charge potential. This is because depletion of minority defects in the space-charge region cannot contribute to charge compensation of the core.
The potential for ionic conduction along the grain boundary core can be assessed based on the defect concentrations and connectivity between the relevant core sites. In this respect, the O1 sites may provide a conduction path for oxide ions (Fig. 2a), while proton conduction may proceed along O1 and/or O2 sites (Fig. 4a and c) depending on the level of hydration. The specific activation energies of migration are also required for a complete assessment of grain boundary conduction. However, the contribution from the grain boundary core to the overall ionic conductivity of the polycrystalline material can be expected to be negligible since the bulk exhibits relatively high ionic conductivities. On the other hand, significant ionic conductivity along grain boundaries may become evident in materials with relatively low bulk ionic conductivities.
In electrolyte materials such as Y-doped BaCeO3, grain boundary conduction may therefore only become evident for species which exhibit comparatively low conductivities in bulk, e.g., cations and electronic charge carriers. Due to the positively charged core, the present work has shown significant accumulation of electron polarons in the core and space-charge regions, particularly under reducing conditions. The electron conductivity along the grain boundary can be expected to increase accordingly, while the contribution from the polarons in the core also depends on their mobility relative to the bulk which exhibits an activation energy of about 0.3 eV.33 In this respect, experimental evidence of n-type grain boundary conduction has been reported for Y-doped BaZrO3 under strongly reducing conditions, e.g., pO2 < 10−30.10,16 Due to the higher reducibility of Ce relative to Zr, this effect can be expected to be even more prominent in Ce-containing compositions. Electron conduction along grain boundaries may contribute to non-faradaic electronic leak paths in electrochemical devices based on these electrolyte materials.
4. Conclusion
Space-charge formation at the (0 2 1)[1 0 0] symmetric tilt grain boundary of Y-doped BaCeO3 was determined to originate from significant segregation of protons and oxygen vacancies. These defects compete for some of the most stable defect sites in the core which could be saturated by oxygen vacancies or protons depending on temperature and water vapor pressure. Ce3+ polarons were almost equally stabilized adjacent to oxygen vacancies in the bulk and grain boundary core, and their tendency to accumulate in the core was therefore mainly given by the core potential. The space-charge potential increased from 0.45 V to 0.75 V upon dehydration of the core mainly due to the higher effective charge of oxygen vacancies compared to protons. Accumulation of minority electrons in the core and space-charge regions was quite substantial and increased with increasing temperature and decreasing pO2. However, the influence of electrons on the space-charge potential was evident only under considerably reducing conditions, e.g., pO2< 10−16 bar at 873 K.Conflicts of interest
There are no conflicts to declare.Acknowledgements
Financial support from The Research Council of Norway under the program NANO2021 to the project (Number 228355) “Functional oxides for clean energy technologies: fuel cells, gas separation membranes and electrolyzers” (FOXCET) conducted by SINTEF Materials and Chemistry, University of Oslo and The Norwegian University of Science and Technology (NTNU) is gratefully acknowledged. Computational resources were provided by The Norwegian Metacentre for Computational Science (NOTUR) under the project nn9259k.References
- H. Iwahara, T. Yajima, T. Hibino, K. Ozaki and H. Suzuki, Protonic conduction in calcium, strontium and barium zirconates, Solid State Ionics, 1993, 61, 65–69 CrossRef.
- Y. Yamazaki, R. Hernandez-Sanchez and S. M. Haile, High total proton conductivity in large-grained yttrium-doped barium zirconate, Chem. Mater., 2009, 21, 2755–2762 CrossRef.
- K. D. Kreuer, S. Adams, W. Münch, A. Fuchs, U. Klock and J. Maier, Proton conducting alkaline earth zirconates and titanates for high drain electrochemical applications, Solid State Ionics, 2001, 145, 295–306 CrossRef.
- C. Duan, J. Tong, M. Shang, S. Nikodemski, M. Sanders, S. Ricote, A. Almansoori and R. O’Hayre, Readily processed protonic ceramic fuel cells with high performance at low temperatures, Science, 2015, 349, 1321–1326 CrossRef PubMed.
- L. Bi, S. Boulfrad and E. Traversa, Steam electrolysis by solid oxide electrolysis cells (SOECs) with proton-conducting oxides, Chem. Soc. Rev., 2014, 43, 8255–8270 RSC.
- H. Malerød-Fjeld, D. Clark, I. Yuste-Tirados, R. Zanón, D. Catalán-Martinez, D. Beeaff, S. H. Morejudo, P. K. Vestre, T. Norby, R. Haugsrud, J. M. Serra and C. Kjølseth, Thermo-electrochemical production of compressed hydrogen from methane with near-zero energy loss, Nat. Energy, 2017, 1–9 Search PubMed.
- S. H. Morejudo, R. Zanon, S. Escolastico, I. Yuste-Tirados, H. Malerød-Fjeld, P. K. Vestre, W. G. Coors, A. Martinez, T. Norby, J. M. Serra and C. Kjølseth, Direct conversion of methane to aromatics in a catalytic co-ionic membrane reactor, Science, 2016, 353, 563–566 CrossRef PubMed.
- R. Sažinas, C. Bernuy-López, M.-A. Einarsrud and T. Grande, Effect of CO2 Exposure on the Chemical Stability and Mechanical Properties of BaZrO3-Ceramics, J. Am. Ceram. Soc., 2016, 99, 3685–3695 CrossRef.
- J. M. Polfus, B. Yildiz, H. L. Tuller and R. Bredesen, Adsorption of CO2 and Facile Carbonate Formation on BaZrO3 Surfaces, J. Phys. Chem. C, 2018, 122, 307–314 Search PubMed.
- C. Kjølseth, H. Fjeld, Ø. Prytz, P. I. Dahl, C. Estournès, R. Haugsrud and T. Norby, Space–charge theory applied to the grain boundary impedance of proton conducting BaZr0.9Y0.1O3−δ, Solid State Ionics, 2010, 181, 268–275 CrossRef.
- C.-T. Chen, C. E. Danel and S. Kim, On the origin of the blocking effect of grain-boundaries on proton transport in yttrium-doped barium zirconates, J. Mater. Chem., 2011, 21, 5435 RSC.
- R. A. De Souza, Z. A. Munir, S. Kim and M. Martin, Defect chemistry of grain boundaries in proton-conducting solid oxides, Solid State Ionics, 2011, 196, 1–8 CrossRef.
- F. Iguchi, C.-T. Chen, H. Yugami and S. Kim, Direct evidence of potential barriers at grain boundaries in Y-doped BaZrO3 from dc-bias dependence measurements, J. Mater. Chem., 2011, 21, 16517 RSC.
- M. Shirpour, R. Merkle, C. T. Lin and J. Maier, Nonlinear electrical grain boundary properties in proton conducting Y-BaZrO3 supporting the space charge depletion model, Phys. Chem. Chem. Phys., 2012, 14, 730–740 RSC.
- M. Shirpour, R. Merkle and J. Maier, Space charge depletion in grain boundaries of BaZrO3 proton conductors, Solid State Ionics, 2012, 225, 304–307 CrossRef.
- M. Shirpour, R. Merkle and J. Maier, Evidence for space charge effects in Y-doped BaZrO3 from reduction experiments, Solid State Ionics, 2012, 216, 1–5 CrossRef.
- F. A. Kröger and H. J. Vink, Relations between the Concentrations of Imperfections in Crystalline Solids, Solid State Phys., 1956, 3, 307–435 Search PubMed.
- D. H. Kim, B. K. Kim and Y. C. Kim, Energy barriers for proton migration in yttrium-doped barium zirconate super cell with Σ5 (3 1 0)/[0 0 1] tilt grain boundary, Solid State Ionics, 2012, 213, 18–21 CrossRef.
- J. M. Polfus, K. Toyoura, F. Oba, I. Tanaka and R. Haugsrud, Defect chemistry of a BaZrO3 Σ3 (1 1 1) grain boundary by first principles calculations and space-charge theory, Phys. Chem. Chem. Phys., 2012, 14, 12339–12346 RSC.
- A. Lindman, E. E. Helgee and G. Wahnström, Theoretical modeling of defect segregation and space-charge formation in the BaZrO3 (2 1 0)[0 0 1] tilt grain boundary, Solid State Ionics, 2013, 252, 121–125 CrossRef.
- E. E. Helgee, A. Lindman and G. Wahnström, Origin of Space Charge in Grain Boundaries of Proton-Conducting BaZrO3, Fuel Cells, 2013, 13, 19–28 CrossRef.
- J. Kim, J. Yang, B. Kim and Y. Kim, Study of – Σ3 BaZrO3 (2 1 0)[0 0 1] tilt grain boundaries using density functional theory and a space charge layer model, J. Ceram. Soc. Jpn., 2015, 123, 245–249 CrossRef.
- J.-S. Kim and Y.-C. Kim, Equilibrium crystal shape of BaZrO3 and space charge formation in the (0 1 1) surface by using ab-initio thermodynamics, J. Korean Phys. Soc., 2017, 70, 75–80 CrossRef.
- A. Lindman, T. S. Bjørheim and G. Wahnström, Defect segregation to grain boundaries in BaZrO3 from first-principles free energy calculations, J. Mater. Chem. A, 2017, 5, 13421–13429 Search PubMed.
- J.-S. Kim, J.-H. Yang, B.-K. Kim and Y.-C. Kim, Proton conduction at BaO-terminated (0 0 1) BaZrO3 surface using density functional theory, Solid State Ionics, 2015, 275, 19–22 CrossRef.
- J. M. Polfus, T. S. Bjørheim, T. Norby and R. Bredesen, Surface defect chemistry of Y-substituted and hydrated BaZrO3 with subsurface space-charge regions, J. Mater. Chem. A, 2016, 4, 7437–7444 Search PubMed.
- J. M. Polfus, T. Norby and R. Bredesen, Proton segregation and space-charge at the BaZrO3 (0 0 1)/MgO (0 0 1) heterointerface, Solid State Ionics, 2016, 297, 77–81 CrossRef.
- T. S. Bjørheim, M. Arrigoni, S. W. Saeed, E. Kotomin and J. Maier, Surface segregation entropy of protons and oxygen vacancies in BaZrO3, Chem. Mater., 2016, 28, 1363–1368 CrossRef.
- M. Shirpour, B. Rahmati, W. Sigle, P. A. Van Aken, R. Merkle and J. Maier, Dopant segregation and space charge effects in proton-conducting BaZrO3 perovskites, J. Phys. Chem. C, 2012, 116, 2453–2461 Search PubMed.
- M. Shirpour, G. Gregori, L. Houben, R. Merkle and J. Maier, High spatially resolved cation concentration profile at the grain boundaries of Sc-doped BaZrO3, Solid State Ionics, 2013, 262, 860–864 CrossRef.
- J.-H. Yang, B.-K. Kim and Y.-C. Kim, Theoretical Analysis for Proton Conductivity at Σ3 Tilt Grain Boundary of Barium Cerate, J. Nanosci. Nanotechnol., 2015, 15, 8584–8588 CrossRef PubMed.
- A. Lindman, E. E. Helgee and G. Wahnström, Comparison of Space-Charge Formation at Grain Boundaries in Proton-Conducting BaZrO3 and BaCeO3, Chem. Mater., 2017, 29, 7931–7941 CrossRef.
- M. Swift, A. Janotti and C. G. Van De Walle, Small polarons and point defects in barium cerate, Phys. Rev. B: Condens. Matter Mater. Phys., 2015, 1–7, 214114 CrossRef.
- P. E. Blöchl, Projector augmented-wave method, Phys. Rev. B: Condens. Matter Mater. Phys., 1994, 50, 17953–17979 CrossRef.
- G. Kresse and D. Joubert, From ultrasoft pseudopotentials to the projector augmented-wave method, Phys. Rev. B: Condens. Matter Mater. Phys., 1999, 59, 1758–1775 CrossRef.
- J. Perdew, K. Burke and M. Ernzerhof, Generalized Gradient Approximation Made Simple, Phys. Rev. Lett., 1996, 77, 3865–3868 CrossRef PubMed.
- S. L. Dudarev, S. Y. Savrasov, C. J. Humphreys and A. P. Sutton, Electron-energy-loss spectra and the structural stability of nickel oxide: An LSDA+U study, Phys. Rev. B: Condens. Matter Mater. Phys., 1998, 57, 1505–1509 CrossRef.
- D. Marrocchelli, S. R. Bishop, H. L. Tuller, G. W. Watson and B. Yildiz, Charge localization increases chemical expansion in cerium-based oxides, Phys. Chem. Chem. Phys., 2012, 14, 12070 RSC.
- R. A. De Souza, The formation of equilibrium space-charge zones at grain boundaries in the perovskite oxide SrTiO3, Phys. Chem. Chem. Phys., 2009, 11, 9939–9969 RSC.
- K. Lehovec, Space-Charge Layer and Distribution of Lattice Defects at the Surface of Ionic Crystals, J. Chem. Phys., 1953, 21, 1123 CrossRef.
- K. L. Kliewer and J. S. Koehler, Space Charge in Ionic Crystals. I. General Approach with Application to NaCl, Phys. Rev., 1965, 140, A1226 CrossRef.
- J. Jamnik, J. Maier and S. Pejovnik, Interfaces in solid ionic conductors: Equilibrium and small signal picture, Solid State Ionics, 1995, 75, 51–58 CrossRef.
- T. He, Impedance spectroscopic study of thermodynamics and kinetics of a Gd-doped BaCeO3 single crystal, Solid State Ionics, 1997, 95, 301–308 CrossRef.
- D. S. Mebane and R. De Souza, A generalised space-charge theory for extended defects in oxygen-ion conducting electrolytes: from dilute to concentrated solid solutions, Energy Environ. Sci., 2015, 4, 1166–1169 Search PubMed.
- A. Løken, T. S. Bjørheim and R. Haugsrud, The pivotal role of the dopant choice on the thermodynamics of hydration and associations in proton conducting BaCe0.9X0.1O3−δ (X = Sc, Ga, Y, In, Gd and Er), J. Mater. Chem. A, 2015, 3, 23289–23298 Search PubMed.
| This journal is © the Owner Societies 2018 |