 Open Access Article
Creative Commons Attribution 3.0 Unported Licence
Singlet-assisted diffusion-NMR (SAD-NMR): redefining the limits when measuring tortuosity in porous media†‡
Monique C.
Tourell
,
Ionut-Alexandru
Pop§
,
Lynda J.
Brown
,
Richard C. D.
Brown
and
Giuseppe
Pileio
 *
*
Chemistry, University of Southampton, SO17 1BJ, Southampton, UK. E-mail: g.pileio@soton.ac.uk
First published on 6th March 2018
Abstract
Long-lived singlet order is exploited in diffusion NMR experiments to successfully measure the tortuosity of randomly packed spheres with diameters ranging from 500 to 1000 μm. The pore spaces in such packings have characteristic length scales well beyond the length scale limit set by spin relaxation in conventional NMR-diffusion experiments. Diffusion times of up to 240 s were used to obtain the restricted diffusion coefficient as a function of diffusion time in the long-time diffusion regime. Experimental results were validated with numerical simulations and data from X-ray micro-computed tomography.
1. Introduction
Tortuosity is the ratio of the effective path length to the shortest path length in a porous medium and, as an indicator of pore connectivity, is a fundamental quantity in understanding fluid transport through the material. It can also be difficult to measure directly. Nevertheless, it is essential in a wide variety of applications including characterization of porous rock samples,1 evaluating performance of batteries,2 understanding nutrient transport pathways in cell cultures and biological tissues3 and identifying abnormal blood vessels for diagnosis and therapeutic monitoring of numerous diseases.4Diffusion nuclear magnetic resonance (NMR) techniques are a non-destructive means of evaluating tortuosity in porous media by measurement of the restricted self-diffusion coefficient at so-called long measurement times.5 At these times, the displacement of the diffusing molecules through the porous media is much larger than the characteristic length-scale of the pore space. The measured restricted diffusion coefficient, D(Δ), approaches an asymptotic value that is independent of the measurement time, Δ, and directly related to the tortuosity of the porous material, α, as simply D(Δ)/D0 = 1/α.6 Unlike other flux-based tortuosity measurements (e.g. analysis of electrical conductivity or diffusion under flow), the restricted self-diffusion coefficient is directly related to tortuosity without a dependence on porosity.7 In this, NMR provides a unique advantage over other methods. Additionally, NMR is ideal for in situ based measurements and dynamic systems where the pore space changes with time.8,9 However, the maximum diffusion time, Δ, that can be measured using traditional diffusion-NMR methods, such as the pulsed-gradient spin echo (PGSE) and stimulated echo (PGSTE) experiments, is determined by the relaxation time of the associated spin order that has been prepared; T2 in PGSE and T1 in PGSTE. Consequently, there is an upper limit on the pore sizes that can be explored using these traditional methods. For typical PGSTE experiment T1 is of the order of seconds and the diffusing species has an unrestricted diffusion coefficient between 10−10 and 10−9 m2 s−1. Because of this, the maximum displacement that can be measured in conventional NMR experiments is about 50–100 μm, and the true long-time diffusion coefficient can only be reached in materials with characteristic pore sizes several times smaller than this, ∼10 μm.
There are many porous materials with characteristic pore spaces larger than this limit in which knowledge of tortuosity and fluid transport is essential. For example, the electrodes in proton-exchange membrane (PEM) fuel cells are multi-scale porous media with pore sizes ranging from 0.1–200 μm.10,11 A key element of electrode design is management and removal of liquid water, the waste product of the cell. Accumulation of water in the gas diffusion layer (GDL) of the electrodes restricts the access of the reactant gases to the catalytic sites, thereby limiting the upper power limit of the cell. To achieve the power output that is required for commercial use of PEM fuel cells (in electric vehicles, for example), improved water management and a better understanding of water transportation in the cell is necessary. While optical imaging12 and MR imaging13 can visualize water pathways in the GDL, computational approaches suggest that tortuosity of the GDL is important in determining water retention and the performance of the cell.14,15
Similarly, water transport is a vital element in the design of tissue engineering scaffolds.16 These are three dimensional, porous structures that support and guide cell growth for the regeneration of biological tissue, with pores sizes of 50–500 μm.16,17 Infiltration of the pore space by the newly formed tissue causes nutrient and waste transport pathways within the scaffold to become more tortuous. If the scaffold is not designed appropriately, cells at the centre can be cut off from essential nutrients resulting in a necrotic core.16 Previous studies have provided information on the restricted diffusion coefficient in unseeded18 and seeded9 tissue engineering constructs using conventional diffusion-NMR measurements of water protons in the samples. However, given the pore spacing in these structures (150–500 μm) and the diffusion time accessed (Δ = 18–250 ms), these studies can only provide insight into the short to intermediate diffusion regimes. The scaffold tortuosity can only be inferred from these measurements, not directly measured.
Clearly, non-invasive diffusion-NMR still has a significant role to play in the characterization of tortuosity and fluid transport in porous materials. There are two conceivable ways of extending the current spatial limit that restricts traditional NMR diffusion experiments. Firstly, a diffusing species with a diffusion coefficient much larger than what is conventionally used can be chosen. For example, Mair et al. used 129Xe gas (D0 = 5.7 × 10⁻⁶ m2 s−1 at 1 bar pressure; T1 = 1.4 s with added paramagnetic O2) to reach the long-time diffusion limit and measure the tortuosity in randomly packed glass spheres characterized by pore length scales up to 2000 μm.19 However, this method requires the preparation of pressurized and hyperpolarized 129Xe (which requires specialized knowledge and equipment) and suffers from drawbacks directly related to the large diffusion coefficient of the gas. There is now a lower limit on the short-time diffusion behaviour that can be measured, which in turn limits the capability of this method in probing multi-scale systems. Additionally, breach of the narrow-pulse approximation (due to large translational displacement during the application of the pulsed gradients) can render the diffusion data acquired before the asymptotic long-time diffusion regime difficult to interpret.19
In this paper, we propose an alternate approach which utilizes long-lived singlet spin order as a means of storing magnetization during the diffusion time. The characteristic decay time of such spin order, TS, is typically 10–50 times longer than the T1. When combined with diffusion NMR, the long lifetime of singlet spin order has allowed calculation of slow diffusion coefficients,20 and extended measurement time in q-space diffusion diffraction experiments.21,22 Previously, our group has used singlet-enhanced diffusion NMR to image slow flow, and unrestricted diffusion over the course of several millimeters,23,24 and more recently, have successfully measured cavity sizes up to 2 mm in singlet-enhanced q-space experiments.25
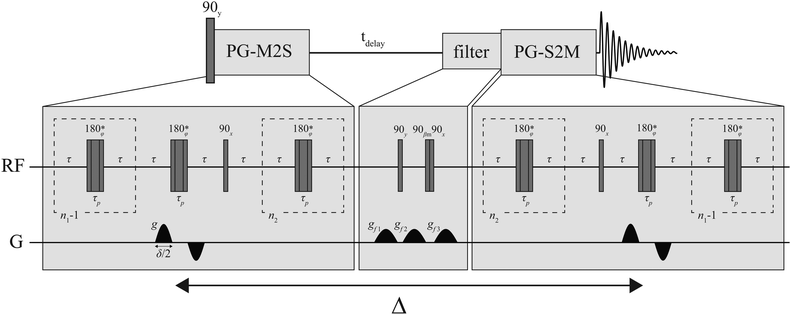
In this work, we present a singlet-assisted diffusion-NMR technique, SAD-NMR. The technique is based on magnetization-to-singlet order transfers and is able to measure tortuosity in porous samples where the characteristic length-scale of the pore space requires a diffusion time of hundreds of seconds to report on the tortuosity of the medium. Such length-scales are out of reach for traditional NMR-diffusion methods based on spin echoes (PGSE or PGSTE). In particular, we demonstrate and discuss the performances of this method on samples of randomly-packed spheres up to 1 mm in diameter.
2. Tortuosity
There are many ways to define tortuosity and relate it to the restricted diffusion coefficient in porous media.26 While the tortuosity factor is always inversely related to the ratio of restricted versus unrestricted diffusion coefficient (D(Δ)/D0), the absolute relationship is often squared, and can sometimes include porosity27 and (more rarely) constrictivity terms.28 Here, we adopt the relationship most commonly used in analysis of NMR diffusion data. In randomly-packed sphere packings, neglecting surface relaxation at the pore walls, the long-time behavior of the diffusion coefficient, D(Δ) is related to tortuosity, α, as:5,29 | (1) |
3. Materials and methods
3.1 Experimental
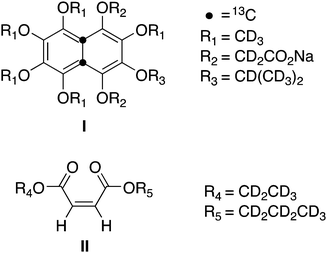
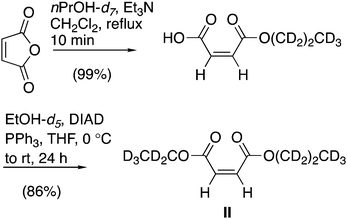
The diffusion-NMR experiments discussed below use two different molecular systems and a variety of beads.The unsymmetrical maleate diester (II, Scheme 1) was synthesised from commercially available maleic anhydride, nPrOH-d7 and EtOH-d5 in two steps in an 85% overall yield (see Scheme 2). The details of the synthesis are available in literature.28,29
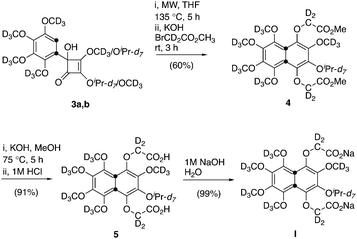
The doubly 13C labelled perdeuterated naphthalene derivative (I, Scheme 1) is a water-soluble analogue of a compound previous reported by some of us.30,31 The synthesis of I made use of the previously reported mixture of cyclobutene regioisomers 3a and 3b (ratio ∼1![[thin space (1/6-em)]](https://www.rsc.org/images/entities/char_2009.gif) :
:![[thin space (1/6-em)]](https://www.rsc.org/images/entities/char_2009.gif) 1, Scheme 3), which underwent thermal rearrangement, by microwave irradiation, to afford a naphthalene-1,4-diol intermediate that was immediately alkylated with methyl bromoacetate-2,2-d2 in THF to afford the diester 4 in 60% yield over the two steps. Saponification of the diester 4 followed by acid work up delivered the naphthalene diacid 5 in 91% yield after purification. The desired aqueous solubility was achieved through formation of the disodium salt 5, obtained in quantitative yield from the diacid. Further details on this synthesis are available in the ESI.‡
1, Scheme 3), which underwent thermal rearrangement, by microwave irradiation, to afford a naphthalene-1,4-diol intermediate that was immediately alkylated with methyl bromoacetate-2,2-d2 in THF to afford the diester 4 in 60% yield over the two steps. Saponification of the diester 4 followed by acid work up delivered the naphthalene diacid 5 in 91% yield after purification. The desired aqueous solubility was achieved through formation of the disodium salt 5, obtained in quantitative yield from the diacid. Further details on this synthesis are available in the ESI.‡
All experiments were carried out on a 7 T Bruker Avance III spectrometer equipped with a micro-imaging probe carrying a 1H/13C 10 mm resonator and able to deliver a maximum gradient amplitude of 1.5 T m−1. Successively, PE beads of the three given sizes were poured to form a random packing into the three NMR tubes filled with the solution of compound I. Similarly, the 1000 μm GB were poured in the NMR tube containing the compound II. The resulting systems are labelled as in summarized Table 2.
| Name | Molecule | Solvent | Beads type | Beads size (μm) |
|---|---|---|---|---|
| S1 | I | D2O | Polyethylene | 500–600 |
| S2 | I | D2O | Polyethylene | 710–850 |
| S3 | I | D2O | Polyethylene | 1000–1180 |
| S4 | II | Ethanol-d6 | Glass | 1000 |
The magnetic susceptibilities of PE and de-ionized water are relatively well matched (0.78 ppm33) and, as a result, systems S1–S3 are expected to produce relatively small background magnetic field gradients. Conversely, GBs and ethanol in S4 are not susceptibility matched, resulting in possible internal magnetic field gradients. The spheres were poured into the solutions inside a glove box with low O2 and both T1 and TS were measured again (Table 1). In both systems, the TS was significantly longer than the T1. In the PE systems, the addition of the spheres into the solution did not significantly affected the measured TS. This was not the case in the system contain glass beads and could be due to surface relaxation.
| Molecule | τ (ms) | τ p (μs) | n 1 | n 2 |
|---|---|---|---|---|
| I (in D2O) | 4.5 | 82 | 20 | 10 |
| II (in ethanol-d6) | 20.9 | 36 | 32 | 16 |
3.2 Numerical simulations
All numerical simulations were written in Mathematica (Wolfram Inc., Illinois). To estimate the pore size in each sample and verify the experimental results, a random packing of 250 monodisperse spheres with periodic boundaries and a porosity 0.385 (appropriate for dense, randomly packed spheres34) was constructed using a force-packing algorithm.35 This volume used to generate four simulation volumes (for the three PE and one glass samples) by rescaling the simulated sphere diameters to the average of the range of diameters specified by the manufacturer; for example, the 500–600 μm PE system (S1) was simulated using a sphere diameter of 550 μm. The pore size density function for each simulation volume was numerically calculated by distributing a series of test points randomly in the pore volume, and calculating the minimum distance to a sphere.36 These distributions are shown in Fig. 2. The mean distance across the simulation volumes ranged from 37 to 75 μm and can be thought of as the average minimum distance a diffusing molecule must travel to encounter an obstruction from any position in the pore space.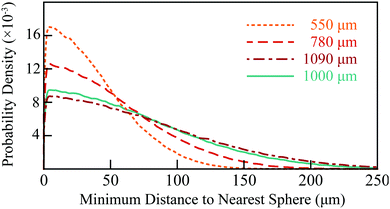 | ||
| Fig. 2 Radial distance distributions in the simulated sphere packings at 550, 780, 1090 (to simulate the PE system) and 1000 μm (to simulate the glass system). | ||
Diffusion of the molecules through these volumes was simulated using a Monte Carlo (MC) algorithm. During the simulation, NP = 5000 tracer molecules were positioned randomly in the pore space of the sphere packing and their stochastic trajectories over NT time-steps were tracked. In each time step, Δt, each molecule attempted a step of length Δr = √(6D0Δt). The experimentally obtained values of the unrestricted diffusion coefficient, D0, were used (Table 1) and Δt was chosen such that the resultant Δr (∼5 μm) was small enough to ensure tracer molecules didn’t ‘step through’ the spheres without encountering them. The direction of the step attempted by a tracer was chosen randomly from a continuous distribution of directions, uniform on the surface of a sphere and centred on that tracer molecule.
The chosen direction was uncorrelated with any of the previous steps for that or any other molecule. If, during a time step, a molecule attempted to move inside the sphere volume, then the position of the tracer was taken as the point of intersection between the attempted step and the sphere surface; the displacement of the tracer for this time step was adjusted accordingly. Such boundary conditions can be considered “weakly absorbing” compared to other, reflective boundary conditions. However, in the limit of small Δt, the effect of choice of boundary condition on the result of the MC simulation is negligible.37 Standard periodic boundary conditions were applied to molecules moving outside of the random sphere packing unit cell.
The normalized apparent diffusion coefficient at time step k (diffusion time Δ = Δtk) in the simulation was calculated as:
 | (2) |
3.3 Micro-CT
To determine the validity of the simulation volume used in the above numerical simulations, a Nikon XT H 255 scanner was used to obtain an X-ray micro-computed tomography (μ-CT) 3D volume image of S1 with a resolution of 7.3 μm. Post-processing of this data set was done in Image J. Firstly, a region of interest, 2450 × 3500 × 3500 μm, was extracted from the centre of the reconstructed 3D volume and a sigma filter used to smooth and reduce noise. The Bone J package38 was used to binarize this data set (distinguishing between sphere and pore volume) and determine the porosity (ϕ) and surface area to volume ratio (S/Vp) of the pore space as 0.352 and 0.021 μm−1, respectively. The corresponding values in the mono-disperse 550 μm simulated sphere packing were ϕ = 0.385 and S/Vp = 0.023 μm−1. The radial distribution function in the binarized μ-CT data was calculated in Mathematica and was also comparable to that in the simulation volume, shown in Fig. 3. The average minimum distance to the nearest obstruction in the mono-sized sphere packing model and the experimental μ-CT volume were 37 and 43 μm, respectively.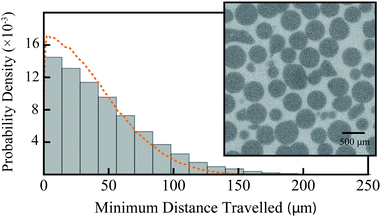 | ||
| Fig. 3 Comparison of the radial distance distributions in the mono-sized 550 μm sphere packing (dashed, orange line; as in Fig. 2) and the binarized μ-CT data (grey histogram). The inset shows a representative sample cross-section of the μ-CT data, with darker pixels indicating PE spheres and lighter pixels indicating the pore space. | ||
A 3D square lattice with nodes of 1 indicating sphere volume and nodes of 0 indicating pore space was created from the binarized data and used as the simulation volume for a Monte Carlo lattice random walk, similar to that described above with some small alterations. The initial positions of the tracer molecules lie on lattice points in the pore space, randomly chosen within a volume 10 × 100 × 100 at the centre of the 3D square lattice (total dimension 350 × 500 × 500 lattice points 7.3 μm apart). This ensured that the tracer molecules did not move outside of the simulation lattice during the simulation and boundary conditions, with discontinuous sphere boundaries, at the simulation edge could be avoided. We ensured the tracers still move through enough of the simulation volume to accurately represent the full volume, not just the small initial subset. The step size Δr is automatically defined as the resolution of the μ-CT scan (7.3 μm) and the corresponding time-step value was calculated as Δt = Δr2/(6D0), with D0 the appropriate experimentally obtained value (Table 1).
In each time-step, a tracer may move in one of the six ±x, ±y or ±z directions, chosen randomly. If in a time-step, a tracer attempted to move onto a lattice node in the sphere volume, the tracer remained stationary for that time-step and the displacement for that time-step was 0 (these boundary conditions can also be considered as weakly absorbing). The normalized apparent diffusion coefficient at different times in the simulation was calculated according to eqn (2).
4. Results and discussion
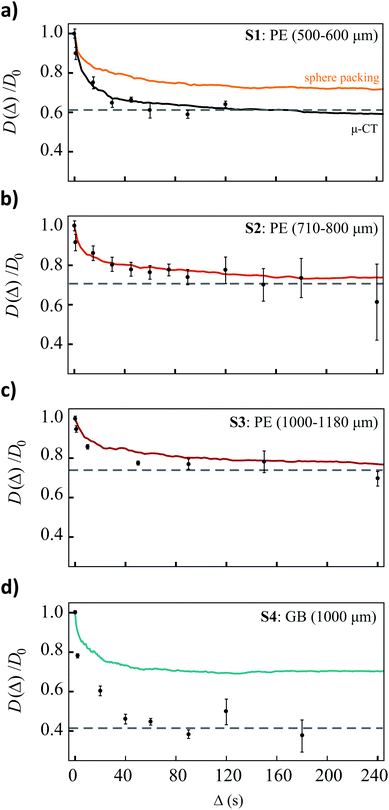
The measured, normalized diffusion coefficients as a function of measurement time for the four sphere packings (S1–S4) are shown in Fig. 4, the solid lines in these plots are the associated simulation data. In the PE spheres (Fig. 4a–c), the onset of the long-diffusion regime occurred at longer times as the sphere size increased consistent with an increase in pore size. Although the onset of the long diffusion regime is accurately modelled by the simulations of the diffusion through the mono-sized sphere packings in each of the PE sphere packings, there was some discrepancy between the simulated and experimental asymptotic values.Experimentally obtained values for the asymptotic restricted diffusion coefficient, and hence tortuosity, in random packings of monodisperse spheres vary in the literature. Due to the various definitions of tortuosity and, the sometimes-apparent dependence of tortuosity on transport mechanism27 (e.g. bulk vs. Knudsen diffusion regimes), we limit our comparison to studies of bulk fluid diffusion measured from NMR.
The simulated apparent diffusion coefficient in a model mono-sized sphere packing of diameter 780 μm and 1090 μm, reaches an asymptote for D(Δ)/D0 = 0.71–0.73 (the range is a result of statistical noise in the simulations, and the weakly absorbing sphere surfaces), which is in agreement with the experimental data obtained by singlet-enhanced diffusion NMR on the analogous samples S2 and S3. The simulated data agrees with previous MC simulations of tracer molecules through random mono-sized sphere packings. For random sphere packings of porosity 0.36–0.46, generated using two different methods of sphere packing, Khirevich et al. report restricted diffusion coefficients in the range of 0.71–0.76.39 Additionally, our experimental values are comparable to those reported in Latour et al. where the restricted diffusion coefficient of water in mono-disperse, random packings of glass spheres (48, 96 and 194 μm in diameter) was around 0.68.5
In the 500–600 μm PE sphere packing (S1), the experimental data (Fig. 4a, grey points) reach an asymptote for D(Δ)/D0 = 0.61, a value which is much lower than that predicted by our simulations in the model monodisperse sphere packing with diameter 550 μm (Fig. 4a, orange line). The accurate modeling of the initial drop-off of D(Δ)/D0 and the onset of the asymptotic regime, indicates that the S/Vp of the 500–600 μm PE sphere packing is accurately modelled by the simulated sphere packing (seen above when comparing the S/Vp of the simulated packing and the μ-CT data), but that the tortuosity of the sample is not.29 The black solid line in Fig. 4a (labelled μ-CT) is the simulated restricted diffusion coefficient as a function of diffusion time through the μ-CT data and is in near-perfect agreement with the experimental curve. The inadequate modelling of the sample by the simulated, model sphere packing could be a combination of the distribution of sphere sizes, the slightly higher porosity in the simulated sphere packing and the irregular shaped beads in the actual PE sample (see inset of Fig. 3).
The experimental (grey points) and simulated (solid line) values of D(Δ)/D0 in the glass bead system (S4) are shown in Fig. 4d. Again, our simulations of the diffusion through the mono-sized bead packing accurately models the time at which the asymptotic diffusion coefficient is reached, however the value of the experimental asymptote, 0.4, is well below that predicted by the simulations. Unfortunately, because of artifacts arising at glass/solvent interfaces, we were not able to run a μ-CT on S4 and therefore we cannot compare diffusion through the actual system to diffusion in the model system. It is possible that, like in the 500–600 μm PE system, the model packing does not accurately represent the actual sample. In sphere packings in cylindrical containers, the container walls can impose some order on the packing geometry when the container diameter is only a few times the sphere diameter.40 This could alter both porosity and tortuosity of the packing. However, if this effect was present in the glass beads packing, it would also be present in the case of the 1000–1180 μm PE sphere packing. As the restricted diffusion coefficient in this PE system is accurately modelled by the random packing, we can rule out any regions of order affecting the tortuosity in the glass samples as well. Additionally, previous simulations by Sen et al. show only minor changes in the measured restricted diffusion coefficient as a result of ordered or disordered packing.40
Another possible cause of the discrepancy between the value of the asymptote obtained in the simulated and experimental case is surface relaxation, which, in the case of randomly packed beads, can act to decrease the restricted diffusion coefficient at long diffusion times.40 The Monte Carlo simulation described above and shown in Fig. 4d assumes no surface relaxation, as does eqn (1). Surface relaxation can be implemented into MC simulations if the relaxivity of the surface, ρ, is known a priori. In each time step, Δt, a molecule encountering a sphere has a probability γ, of being “killed off”:40
 | (3) |
 | (4) |
The sensitivity of singlet order to surface relaxation has not been modelled in detail yet. However, the above results suggest it may be minimal. Additionally, a simple external-random-field approach would predict that the higher the correlation of the random fields action on the individual spins in the singlet pair the smaller their contribution on singlet relaxation, meaning that if the source of the relaxation is at an equal distance from the two spins its effect (through dipolar interaction for example) is minimised.42 If the results in Fig. 4 are read in this framework then one can imagine that the singlet pair in I is more shielded against surface relaxation than the pair in II simply because located more to the core of the molecule.
In addition to surface relaxation effects, the magnetic susceptibility difference between the glass spheres and the fluid phase creates background magnetic field gradients. In this sense, the glass system represents a more physically relevant system (a more realistic model for porous materials of scientific and industrial interest), compared to the PE spheres. In convectional diffusion-NMR experiments the presence of background gradients can substantially affect the ability to measure the apparent diffusion coefficient accurately.43 The potential effect of background gradients on the singlet diffusion NMR signal is not included here. Singlet order, represented by a rank-zero spherical tensor operator, is immune to magnetic field gradients and for that reason immune to background gradients. These internal gradients, however, may have a subtler effect: spins diffusing in a medium where magnetic susceptibility differences are big and at microscopic level, experience a strong relaxation mechanism that acts on transverse magnetization (T2-like). Because of this, the transverse magnetization created during the PG-M2S block of Fig. 1 may decay completely prior to the preparation of the singlet order, in this case the singlet order cannot not be accessed. In systems with large magnetic susceptibility differences, the most effective way of avoiding this effect is to work at low-field, where background magnetic field gradients are minimized.
Future work will investigate the effects of surface interactions and internal gradients on the relaxation of singlet order, to try and better understand the relaxation mechanisms in porous media. A more extensive knowledge of these mechanisms is essential for the rationalisation of the discrepancies between simulated and experimental data on tortuosity, not just in our pseudo-realistic glass system, but, more importantly, in real-world applications.
Conclusions
We have demonstrated the ability to accurately measure the tortuosity from the long-time diffusion coefficient in model porous media using long-lived spin order. The characteristic pore-sizes in these model systems ensure that accessing the long-diffusion limit is well beyond the capabilities of traditional diffusion NMR experiments. Using the presented SAD-NMR pulse sequence, the experimentally measured restricted diffusion coefficient in the systems of polyethylene spheres was in excellent agreement with the diffusion simulations.A more thorough understanding of the relaxation mechanisms of singlet order in porous media is required to understand the apparent discrepancy between the theoretical and experimentally measured tortuosity values in the glass system and this will be the topic of future work. However, the results in this paper clearly demonstrate the ability of singlet-assisted diffusion NMR to probe pore sizes even larger than those used here for the sake of demonstration.
This technique can be applied, for example, to measure the tortuosity and fluid transport in gas diffusion layers in proton-exchange membrane fuel cells and monitor changes to nutrient pathways in tissue engineering scaffolds as a result of cell growth. For these, and other practical cases, the technique should be run in low magnetic field to avoid the susceptibility related issues described above. We are currently developing an apparatus to carry out these measurements in a field-cycling fashion.
Conflicts of interest
There are no conflicts to declare.Acknowledgements
Funding for this project was provided by EPSRC grant EP/N033558/1. We thank Prof. M. H. Levitt and EPSRC grant EP/I036141/1 for support to the synthesis. The authors thank μ-VIS X-ray Imaging Centre at the University of Southampton for provision of tomographic imaging facilities, supported by EPSRC grant EP-H01506X. M. C. T. gratefully acknowledges Sean Powell for fruitful discussions and Francesco Giustiniano for technical assistance.Notes and references
- M. D. Hurlimann, K. G. Helmer, L. L. Latour and C. H. Sotak, Restricted Diffusion in Sedimentary Rocks. Determination of Surface-Area-to-Volume Ratio and Surface Relaxivity, J. Magn. Reson., Ser. A, 1994, 111(2), 169–178 CrossRef.
- I. V. Thorat, D. E. Stephenson, N. A. Zacharias, K. Zaghib, J. N. Harb and D. R. Wheeler, Quantifying tortuosity in porous Li-ion battery materials, J. Power Sources, 2009, 188(2), 592–600 CrossRef CAS.
- A. H. Kyle, C. T. O. Chan and A. I. Minchinton, Characterization of three-dimensional tissue cultures using electrical impedance spectroscopy, Biophys. J., 1999, 76(5), 2640–2648 CrossRef CAS PubMed.
- E. Bullitt, G. Gerig, S. M. Pizer, W. L. Lin and S. R. Aylward, Measuring tortuosity of the intracerebral vasculature from MRA images, IEEE Trans. Med. Imag., 2003, 22(9), 1163–1171 CrossRef PubMed.
- L. L. Latour, P. P. Mitra, R. L. Kleinberg and C. H. Sotak, Time-Dependent Diffusion-Coefficient of Fluids in Porous-Media as a Probe of Surface-to-Volume Ratio, J. Magn. Reson., Ser. A, 1993, 101(3), 342–346 CrossRef CAS.
- P. P. Mitra, P. N. Sen, L. M. Schwartz and P. Ledoussal, Diffusion Propagator as a Probe of the Structure of Porous-Media, Phys. Rev. Lett., 1992, 68(24), 3555–3558 CrossRef CAS PubMed.
- R. K. J. Valiullin, Diffusion NMR of Confined Systems: Fluid Transport in Porous Solids and Heterogeneous Materials. The Royal Society of Chemistry, 2017 Search PubMed.
- A. C. Forse, J. M. Griffin, C. Merlet, J. Carretero-Gonzalez, A. R. O. Raji, N. M. Trease and C. P. Grey, Direct observation of ion dynamics in supercapacitor electrodes using in situ diffusion NMR spectroscopy, Nat. Energy, 2017, 2(3), 16216 CrossRef.
- S. F. Othman, K. Wartella, V. K. Sharghi and H. Xu, The e-incubator: a magnetic resonance imaging-compatible mini incubator, Tissue Eng., Part C, 2015, 21(4), 347–355 CrossRef PubMed.
- M. Gobel, M. Godehardt and K. Schladitz, Multi-scale structural analysis of gas diffusion layers, J. Power Sources, 2017, 355, 8–17 CrossRef.
- S. Park, J.-W. Lee and B. N. Popov, A review of gas diffusion layer in PEM fuel cells: materials and designs, Int. J. Hydrogen Energy, 2012, 37(7), 5850–5865 CrossRef CAS.
- S. Litster, D. Sinton and N. Djilali, Ex situ visualization of liquid water transport in PEM fuel cell gas diffusion layers, J. Power Sources, 2006, 154(1), 95–105 CrossRef CAS.
- K. W. Feindel, S. H. Bergens and R. E. Wasylishen, Insights into the distribution of water in a self-humidifying H-2/O-2 proton- exchange membrane fuel cell using H-1 NMR microscopy, J. Am. Chem. Soc., 2006, 128(43), 14192–14199 CrossRef CAS PubMed.
- Y. Wang and S. Wang, Evaluation and modeling of PEM fuel cells with the Bruggeman correlation under various tortuosity factors, Int. J. Heat Mass Transfer, 2017, 105(suppl. C), 18–23 CrossRef.
- Y. Wang, C.-Y. Wang and K. S. Chen, Elucidating differences between carbon paper and carbon cloth in polymer electrolyte fuel cells, Electrochim. Acta, 2007, 52(12), 3965–3975 CrossRef CAS.
- T. S. Karande, J. L. Ong and C. M. Agrawal, Diffusion in musculoskeletal tissue engineering scaffolds: design issues related to porosity, permeability, architecture, and nutrient mixing, Ann. Biomed. Eng., 2004, 32(12), 1728–1743 CrossRef PubMed.
- V. Karageorgiou and D. Kaplan, Porosity of 3D biomaterial scaffolds and osteogenesis, Biomaterials, 2005, 26(27), 5474–5491 CrossRef CAS PubMed.
- S. K. Powell, N. Ristovski, S. Liao, K. A. Blackwood, M. A. Woodruff and K. I. Momot, Characterization of the Microarchitecture of Direct Writing Melt Electrospun Tissue Engineering Scaffolds Using Diffusion Tensor and Computed Tomography Microimaging, 3D Print. Addit. Manuf., 2014, 1(2), 95–103 CrossRef.
- R. W. Mair, M. D. Hurlimann, P. N. Sen, L. M. Schwartz, S. Patz and R. L. Walsworth, Tortuosity measurement and the effects of finite pulse widths on xenon gas diffusion NMR studies of porous media, Magn. Reson. Imaging, 2001, 19(3–4), 345–351 CrossRef CAS PubMed.
- S. Cavadini, J. Dittmer, S. Antonijevic and G. Bodenhausen, Slow diffusion by singlet state NMR spectroscopy, J. Am. Chem. Soc., 2005, 127(45), 15744–15748 CrossRef CAS PubMed.
- N. N. Yadav, A. M. Torres and W. S. Price, NMR q-space imaging of macroscopic pores using singlet spin states, J. Magn. Reson., 2010, 204(2), 346–348 CrossRef CAS PubMed.
- A. M. Torres, B. Ghadirian and W. S. Price, Diffusion-diffraction using singlet spin states and various NMR coherences in a J-coupled AX spin system, RSC Adv., 2012, 2(8), 3352–3360 RSC.
- G. Pileio, J.-N. Dumez, I.-A. Pop, J. T. Hill-Cousins and R. C. D. Brown, Real-space imaging of macroscopic diffusion and slow flow by singlet tagging MRI, J. Magn. Reson., 2015, 252(0), 130–134 CrossRef CAS PubMed.
- J. N. Dumez, J. T. Hill-Cousins, R. C. D. Brown and G. Pileio, Long-lived localization in magnetic resonance imaging, J. Magn. Reson., 2014, 246, 27–30 CrossRef CAS PubMed.
- G. Pileio and S. Ostrowska, Accessing the long-time limit in diffusion NMR: The case of singlet assisted diffusive diffraction q-space, J. Magn. Reson., 2017, 285, 1–7 CrossRef CAS PubMed.
- L. Shen and Z. Chen, Critical review of the impact of tortuosity on diffusion, Chem. Eng. Sci., 2007, 62(14), 3748–3755 CrossRef CAS.
- J. M. Zalc, S. C. Reyes and E. Iglesia, The effects of diffusion mechanism and void structure on transport rates and tortuosity factors in complex porous structures, Chem. Eng. Sci., 2004, 59(14), 2947–2960 CrossRef CAS.
- J. van Brakel and P. M. Heertjes, Analysis of diffusion in macroporous media in terms of a porosity, a tortuosity and a constrictivity factor, Int. J. Heat Mass Transfer, 1974, 17(9), 1093–1103 CrossRef.
- P. N. Sen, Time-dependent diffusion coefficient as a probe of geometry, Concepts Magn. Reson., Part A, 2004, 23(1), 1–21 CrossRef.
- G. Stevanato, J. T. Hill-Cousins, P. Håkansson, S. S. Roy, L. J. Brown, R. C. D. Brown, G. Pileio and M. H. Levitt, A nuclear singlet lifetime of more than one hour in room-temperature solution, Angew. Chem., Int. Ed., 2015, 54, 3740–3743 CrossRef CAS PubMed.
- J. T. Hill-Cousins, I. A. Pop, G. Pileio, G. Stevanato, P. Hakansson, S. S. Roy, M. H. Levitt, L. J. Brown and R. C. Brown, Synthesis of an isotopically labeled naphthalene derivative that supports a long-lived nuclear singlet state, Org. Lett., 2015, 17(9), 2150–2153 CrossRef CAS PubMed.
- G. Pileio, M. Carravetta and M. H. Levitt, Storage of nuclear magnetization as long-lived singlet order in low magnetic field, Proc. Natl. Acad. Sci. U. S. A., 2010, 107(40), 17135–17139 CrossRef CAS PubMed.
- M. C. Wapler, J. Leupold, J. Dragonu, D. von Elverfeld, M. Zaitsev and U. Wallrabe, Magnetic properties of materials for MR engineering, micro-MR and beyond, J. Magn. Reson., 2014, 242, 233–242 CrossRef CAS PubMed.
- F. A. L. Dullien, Porous Media: Fluid Transport and Pore Structure, Academic Press, San Diego, CA, 2nd edn, 1992 Search PubMed.
- M. Bargiel and J. Moscinski, C-Language Program for the Irregular Close Packing of Hard-Spheres, Comput. Phys. Commun., 1991, 64(1), 183–192 CrossRef.
- S. Torquato, Random Heterogeneous Materials: Microstructure and Macroscopic Properties, Springer, New York, 2002, vol. 16 Search PubMed.
- H. Xing, F. Lin, Q. Wu and Q. Gong, Investigation of different boundary treatment methods in Monte-Carlo simulations of diffusion NMR, Magn. Reson. Med., 2013, 70(4), 1167–1172 CrossRef PubMed.
- M. Doube, M. M. Klosowski, I. Arganda-Carreras, F. P. Cordelieres, R. P. Dougherty, J. S. Jackson, B. Schmid, J. R. Hutchinson and S. J. Shefelbine, BoneJ Free and extensible bone image analysis in ImageJ, Bone, 2010, 47(6), 1076–1079 CrossRef PubMed.
- S. Khirevich, A. Holtzel, A. Daneyko, A. Seidel-Morgenstern and U. Tallarek, Structure-transport correlation for the diffusive tortuosity of bulk, monodisperse, random sphere packings, J. Chromatogr. A, 2011, 1218(37), 6489–6497 CrossRef CAS PubMed.
- P. N. Sen, L. M. Schwartz, P. P. Mitra and B. I. Halperin, Surface Relaxation and the Long-Time Diffusion-Coefficient in Porous-Media – Periodic Geometries, Phys. Rev. B: Condens. Matter Mater. Phys., 1994, 49(1), 215–225 CrossRef.
- W. F. J. Slijkerman and J. P. Hofman, Determination of surface relaxivity from NMR diffusion measurements, Magn. Reson. Imaging, 1998, 16(5-6), 541–544 CrossRef CAS PubMed.
- M. Carravetta and M. H. Levitt, Theory of long-lived nuclear spin states in solution nuclear magnetic resonance. I. Singlet states in low magnetic field, J. Chem. Phys., 2005, 122, 214505 CrossRef PubMed.
- G. Zheng and W. S. Price, Suppression of background gradients in (B-0 gradient-based) NMR diffusion experiments, Concepts Magn. Reson., Part A, 2007, 30(5), 261–277 CrossRef.
Footnotes |
| † This paper is dedicated to Prof. J. W. Emsley in occasion of his 50th work anniversary at the University of Southampton, UK. |
| ‡ Electronic supplementary information (ESI) available: Details of the synthesis of compound I in Scheme 1. See DOI: 10.1039/c8cp00145f |
| § Current address: Concept Life Sciences, CT13 9ND, Sandwich, UK. |
| This journal is © the Owner Societies 2018 |

