
 Open Access Article
 This Open Access Article is licensed under a
 Creative Commons Attribution 3.0 Unported Licence
Experimental evidence of TICT state in 4-piperidinyl-1,8-naphthalimide – a kinetic and mechanistic study
Zoltán
Szakács
 a,
Sylvia
Rousseva
a,
Márton
Bojtár
b,
Dóra
Hessz
c,
István
Bitter
b,
Mihály
Kállay
d,
Michiel
Hilbers
e,
Hong
Zhang
e and
Miklós
Kubinyi
*ac
a,
Sylvia
Rousseva
a,
Márton
Bojtár
b,
Dóra
Hessz
c,
István
Bitter
b,
Mihály
Kállay
d,
Michiel
Hilbers
e,
Hong
Zhang
e and
Miklós
Kubinyi
*ac
aDepartment of Physical Chemistry and Materials Science, Budapest University of Technology and Economics, 1521 Budapest, Hungary. E-mail: kubinyi@mail.bme.hu
bDepartment of Organic Chemistry and Technology, Budapest University of Technology and Economics, 1521 Budapest, Hungary
cInstitute of Materials and Environmental Chemistry, Research Center for Natural Sciences, Hungarian Academy of Sciences, P.O. Box 286, 1519 Budapest, Hungary
dMTA-BME Lendület Quantum Chemistry Research Group, Department of Physical Chemistry and Materials Science, Budapest University of Technology and Economics, 1521 Budapest, Hungary
eVan't Hoff Institute for Molecular Sciences, University of Amsterdam, P.O. Box 94157, 1090 GD Amsterdam, The Netherlands
First published on 28th March 2018
Abstract
The excited state processes in N-propyl-4-piperidinyl-1,8-naphthalimide have been studied by measuring its fluorescence spectra and decay curves in solvents of different polarity and viscosity and also in a frozen solvent glass. The results unanimously proved the formation of a dark twisted intramolecular charge transfer (TICT) state from the emissive charge transfer (CT) species, the direct product of excitation. The rate coefficients of the TICT process and the deactivations of the CT and TICT species were determined, using a reversible two-state kinetic model. The temperature dependence of the kinetic data was consistent with a kinetic barrier consisting of three terms, the inherent barrier of the reaction, and the contributions of the solute–solvent interactions related to the solvent viscosity and polarity. The potential energy surfaces were calculated in the S0 and the S1 states along the coordinate of turning motion which was conclusive concerning the direction of the twisting and indicated a possible conformational change of the piperidinyl unit. The theoretical calculations confirmed that the TICT species is dark and has a stronger charge transfer character compared to the CT state.
Introduction
1,8-Naphthalimides (NIs) with an electron donor substituent in the 4-position, constitute an important class of push–pull type fluorescent compounds. Their fluorescence wavelengths and in particular, their fluorescence quantum yields are sensitive to the local environment. This attractive feature led to numerous naphthalimide-based fluorescent probes and chemosensors1,2 for various cations,3,4 anions,5 small biomolecules6,7 and protein–protein interactions.8,9The parent compound, 1,8-naphthalimide, and its derivatives with weak donor/acceptor substituents exhibit low fluorescence quantum yields in apolar solvents, somewhat higher values in polar aprotic solvents, which increase further in protic solvents. The effect is due to an efficient intersystem crossing between their S1 and T2 excited states, lying close in apolar media. The interactions with polar, and in particular, with hydrogen-bond donor solvents shift the T2 state to higher, the S1 state to lower energies, reducing the effect.10
Introducing an electron donor substituent into the 4-position of 1,8-NI, the longest wavelength absorption and fluorescence bands are shifted to longer wavelengths.11–14 In most cases, the fluorescence quantum yield becomes higher, because, with the lowering of the energy of the S1 state, the S1–T2 energy gap becomes larger, reducing the yield of inter-system crossing.11,13 The excitation is accompanied by an intramolecular charge transfer (CT) – an electron transfer from the substituent to the electron withdrawing dicarboximide group.15 The excited species are stabilized by polar and more efficiently by protic polar solvents, as indicated by the redshift of the fluorescence band in polar media. The photogenerated higher electric field can serve for a fluorescence quenching mechanism which is called generally as photoinduced electron (charge) transfer (PET) in the literature.16 This phenomenon is of key importance in the construction of NI-based ‘turn-on’ fluorescent chemosensors.17 Most frequently, they contain an electron rich receptor unit attached through a spacer to their 4-position, or an electron withdrawing receptor unit connected through a spacer to their imide nitrogen atom. Their fluorescence quenched strongly in free state via PET mechanism, is restored when the analyte binds to the receptor unit, shielding its local charge.2
In NIs with more rigid electron donating groups on their 4-carbon atom, a twisted intramolecular charge transfer (TICT) process has also been discovered.18 The TICT state may be emissive, manifesting in a dual fluorescence. Examples for this are NIs with a styrene or phenoxy unit inserted between an electron donor group and their 4-position.19,20 More frequently, however, the TICT state is dark, leading only to the weakening of the emission from the CT excited state.21 The TICT of push–pull NIs is of significance in several potential applications, like when these molecules act as polarity8,9 and viscosity probes,22 the inhibition of TICT in solid state leads to aggregation induced emission,23–26 TICT and E/Z isomerization may occur as simultaneous reactions.19
Despite the fluorescence properties of several NIs have been interpreted in terms of two (a CT and a TICT) interconverting S1 excited states, a comprehensive photophysical study had lacked on a more simple push–pull derivative to give experimental proof of the formation of TICT state. This motivated us to provide a detailed description of the excited state processes in N-propyl-4-piperidinyl-1,8-naphthalimide (2, see Fig. 1), combining experimental and theoretical methods. N-Propyl-1,8-naphthalimide (1) was used as reference compound. The rate coefficients of the reversible CT → TICT conversion were determined in different solvents at different temperatures, and were interpreted applying a kinetic barrier consisting of three terms, the inherent barrier of the reaction, and the contributions of the solvent viscosity and solvent polarity. The potential energy surfaces in the S0 and S1 states were calculated, along the coordinate of the turning motion which was conclusive concerning the direction of the twisting. The theoretical calculations confirmed a more efficient charge transfer of the dark TICT state compared to the CT state.
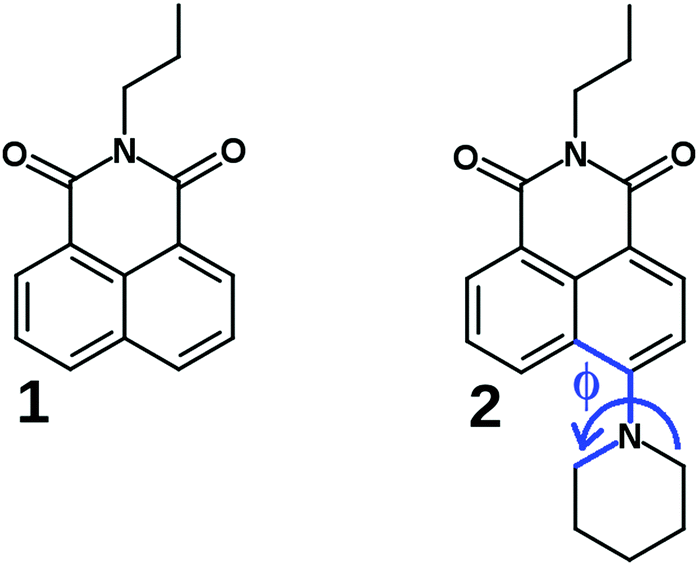 | ||
| Fig. 1 The investigated compounds 1 and 2, Φ is the fixed dihedral angle in the computational TICT study. | ||
Experimental section
General
1 and 2 were prepared as described elsewhere.27,28 Acetonitrile (MeCN), propionitrile (EtCN), butyronitrile (PrCN), valeronitrile (BuCN), caprylonitrile (HepCN), ethylene glycol (EG), methanol (MeOH) and ethanol (EtOH) solvents were purchased from Sigma Aldrich. MeCN was HPLC grade, MeOH and EtOH were spectroscopy grade and they were used without further purification. The other nitriles and the ethylene glycol were used after column chromatography purification using a mixed stationary phase (aluminium oxide ‘Alumina B’ and activated carbon) to remove the luminescent impurities.Spectroscopic experiments
Absorption spectra were recorded using an Agilent 8453 diode array spectrometer. The steady state fluorescence spectra were measured on an Edinburgh Instruments FLS920 instrument, the recorded spectra were corrected with the characteristic of the light source and the detector. Time-resolved fluorescence experiments were performed using the frequency-doubled output of a Ti:sapphire laser system (Chameleon Ultra, Coherent) tuned to 820 nm and 700 nm which results in 410 nm and 350 nm excitation wavelengths for 2 and 1, respectively. A pulse picker was employed to reduce the repetition rate from 80 to 8 MHz. The fluorescence was detected using a monochromator (Newport CS260-02) coupled to a PMT (Hamamatsu). The overall instrument response function (IRF) was ∼20–25 ps (fwhm). A thermostated sample holder was used for the temperature dependent experiments in EG and a liquid nitrogen cryostat was used for the measurements at 77 K in frozen solvent glass (EtOH![[thin space (1/6-em)]](https://www.rsc.org/images/entities/char_2009.gif) :MeOH, 4:1). All the experiments were performed at a concentration of 10 μM in 1 × 1 cm quartz cuvettes.
:MeOH, 4:1). All the experiments were performed at a concentration of 10 μM in 1 × 1 cm quartz cuvettes.
Methods
Dipole moment change
The dipole moment changes were determined from the absorption and fluorescence spectral data obtained in alkyl nitrils, using the Lippert–Mataga equation,29,30 | (1) |
 and
and 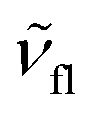 are the wavenumbers of absorption and fluorescence maxima, μg and μe are the dipole moments in the ground and excited states – μg was calculated at the DFT level (for details see Computational section) – ε0 is the vacuum permittivity, h is the Planck constant, c is the velocity of light, a0 is the radius of the Onsager cavity. a0 was also determined by quantum chemical calculations, it was taken as the sphere equivalent radius of the volume inside a contour of 0.001 electrons per Bohr3 density plus 0.5 Angström (this is the recommended radius for self consistent reaction field (SCRF) calculations).31C in eqn (1) is a fitted constant, Δf is the orientation polarizability,
 | (2) |
Quantum yield determination
The fluorescence quantum yields of NIs were determined using quinine sulfate (in 0.1 M H2SO4) as reference, applying the formula32 | (3) |
The quantum yield of quinine sulfate, Φref is 0.5333 the subsequent fractionals in eqn (3) are the ratios of the integrated fluorescence intensities, the refractive indices and the absorbances, the latter at the excitation wavelength.
Theoretical calculations
Theoretical calculations were performed to investigate the TICT process and to calculate the Onsager radius of NIs using the Gaussian09 program package.31 The minimal-energy geometries were created in three steps. Firstly, we carried out a conformational analysis using the Merck molecular force field (MMFF94) with the Marvin Beans program package.34 Secondly, the geometries with up to 8 kJ mol−1 from the lowest energy conformer were optimized using PM6-D3H4 (parametrized model 6 with dispersion correction) implemented in MOPAC2016.35,36 Thereafter, the minimal energy conformer was optimized at the density functianol theory (DFT) level employing the PBE0 functional with the 6-311++G** basis set, Onsager radius and ground state dipole moments were calculated in vacuum.37,38The geometries of 2 were optimized at fixed dihedral angles (Φ) (Fig. 1) for the investigation of the TICT process in vacuum using the 6-31++G** basis set with the same functional. The excited state energies were calculated the same way at the time-dependent DFT (TD-DFT) level of theory.
Results and discussions
Solvatochromism in absorption and fluorescence spectra
Compound 1 has a vibrational fine structure in its absorption as well as in its emission spectra. Besides, the absorption and emission spectra are nearly mirror images, which indicates that the geometry of the vibrationally relaxed S1 state, from where the emission occurs, is close to the ground state structure. The Stokes shift of 1 is small (3540 cm−1), its value is similar as for the parent 1,8-naphthalimide.39The excited state properties of N-propyl-1,8-naphthalimide are strongly modified by the piperidinyl substitution. As can be seen in Fig. 2, the longest wavelength absorption band of 1, appearing at 331 nm shifts strongly to the red, to 405 nm in the spectrum of 2, indicating that the lowest energy excited state is stabilized due to a strong coupling of the electronic structures of the piperidinyl and 1,8-naphthalimide moieties. The electron donating piperidine substituent increases the difference between the S0 and S1 state energy levels: the fluorescence band located at 375 nm in the spectrum of 1 shifts to 535 nm in the spectrum of 2. The corresponding Stokes shifts are 3540 cm−1 for 1 and 6000 cm−1 for compound 2.
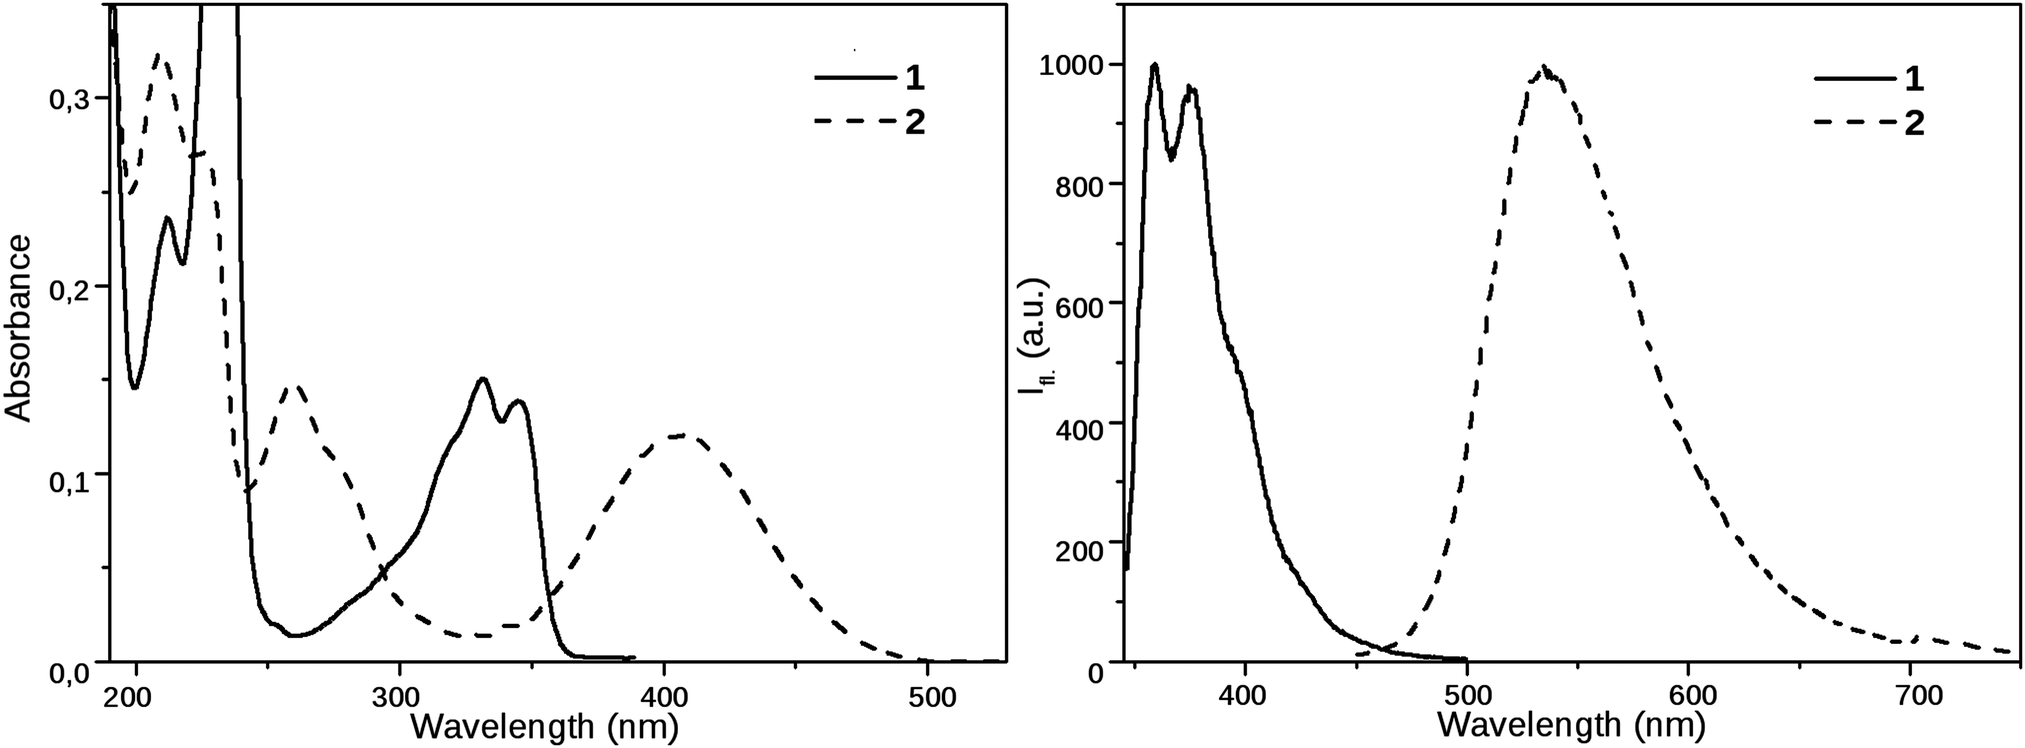 | ||
| Fig. 2 Steady state absorption and emission spectra of 1 and 2 in MeCN (emission spectra were recorded using excitation at 330 nm and 405 nm, respectively). | ||
The solvatochromic behavior of the compounds was investigated in a homologous series of nitriles, minimizing the effect of the solvent specific interactions on the results. The spectral data of 1 and 2 in the nitrile solvents, and the dipole moment changes obtained from the Lippert–Mataga equation – eqn (1) – are collected in Table 1, the Lippert–Mataga plot is shown in Fig. 3 These results demonstrate that 1 is not a charge transfer dye, whereas the radiative excited state of 2 has a moderate charge transfer character. The fluorescence quantum yield of 2 grows with the decrease of the polarity, suggesting that in addition to its moderately polar emissive CT state, 2 has a more polar, but dark state and the deactivation of the CT state via this dark state is more efficient in solvents of higher polarity.
| Solvents | a 0 (Å) | μ g (D) | Δμ (D) | ||||||
|---|---|---|---|---|---|---|---|---|---|
| MeCN | EtCN | PrCN | BuCN | HepCN | |||||
| 1 | λ abs/λem (nm) | 331/375 | 332/375 | 332/379 | 332/374 | 332/374 | 4.65 | 3.91 | 5.35 |
| Fl. quant. yield | 0.023 | 0.017 | 0.013 | 0.012 | 0.015 | ||||
| 2 | λ abs/λem (nm) | 405/535 | 405/532 | 405/529 | 404/525 | 404/524 | 5.74 | 7.52 | 10.4 |
| Fl. quant. yield | 0.043 | 0.069 | 0.11 | 0.17 | 0.32 | ||||
 | ||
| Fig. 3 Lippert–Mataga plot of 1 and 2 in the homologous series of nitriles. | ||
Effect of viscosity on fluorescence spectrum
An indication for the TICT character of this dark state was provided by the fluorescence spectra of 2 in EG at different temperatures. As can be seen in Fig. 4, the fluorescence intensity strongly decreased at higher temperatures, i.e. at lower viscosities, but the shape of the spectra did not change. This can arise from a deactivation channel via a dark TICT species, and the twist of the piperidine moiety is favored at low viscosities. The fluorescence spectrum of 1 in EG (not shown here) was much less sensitive to the temperature.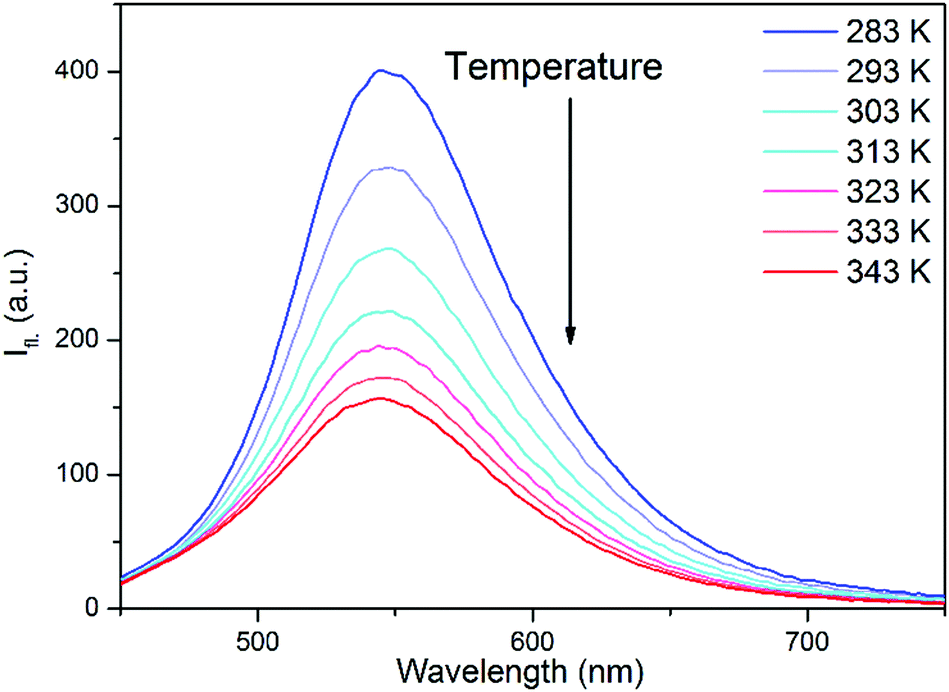 | ||
| Fig. 4 Fluorescence spectra of 2 in EG at different temperatures. Excitation wavelength is 410 nm. | ||
Fluorescence decay dynamics as functions of polarity and viscosity
A further insight into the excited state processes in the two NIs were performed by time resolved fluorescence experiments. The effect of polarity on the excited state dynamics was investigated in the same series of nitriles as applied in the steady-state measurements. In addition, in case of 2, the TICT character of the non-radiative decay was studied by measuring the fluorescence decay curves in ethylene glycol (EG), at different temperatures between 10 and 70 °C, where the viscosity decreases from 34.8 to 4.0 cP, promoting the twist of the piperidine moiety. We note that the raise of temperature also has – a minor – opposite effect on the formation of the TICT state, as the polarity of EG decreases and that variation hinders the charge transfer process.The piperidine substituted derivative 2 showed a biexponential decay in the nitrile solvents (Table 2), as well as in EG (Table 3), whereas the reference compound 1 showed biexponential decays in the nitriles and monoexponential decays in EG. In the case of 2, the decay curves were recorded at five different wavelengths (500, 520, 540, 570, 600 nm) in all the solvents applied. The curves could be well fitted by the same time constants and relative amplitudes, which means that only a single radiative excited species had been detected.
| MeCN | EtCN | PrCN | BuCN | HepCN | ||||||
|---|---|---|---|---|---|---|---|---|---|---|
| A (%) | τ (ns) | A (%) | τ (ns) | A (%) | τ (ns) | A (%) | τ (ns) | A (%) | τ (ns) | |
| 1 | 99.0 | 0.151 | 99.6 | 0.093 | 99.7 | 0.083 | 99.5 | 0.092 | 99.5 | 0.097 |
| 1.0 | 1.073 | 0.4 | 1.357 | 0.3 | 1.404 | 0.5 | 1.441 | 0.5 | 1.455 | |
| 2 | 97.2 | 1.261 | 82.0 | 2.387 | 82.1 | 3.477 | 52.4 | 3.272 | 100.0 | 6.260 |
| 2.8 | 8.371 | 18.0 | 3.475 | 17.9 | 4.727 | 47.6 | 4.411 | |||
| Temperature (K) | Viscosity40 (cP) | Dielectric constant41 (—) | 1 | 2 | ||
|---|---|---|---|---|---|---|
| A (%) | τ (ns) | A (%) | τ (ns) | |||
| 283 | 34.8 | 43.5 | 100.0 | 1.329 | 0.8 | 6.508 |
| 99.2 | 0.143 | |||||
| 293 | 22.0 | 41.3 | 100.0 | 1.218 | 1.1 | 6.477 |
| 98.9 | 0.107 | |||||
| 303 | 14.5 | 39.3 | 100.0 | 1.057 | 0.8 | 6.446 |
| 99.2 | 0.083 | |||||
| 313 | 10.0 | 37.3 | 100.0 | 0.944 | 0.8 | 6.355 |
| 99.2 | 0.071 | |||||
| 323 | 7.2 | 35.4 | 100.0 | 0.844 | 0.7 | 6.315 |
| 99.3 | 0.060 | |||||
| 333 | 5.3 | 33.6 | 100.0 | 0.750 | 0.8 | 6.260 |
| 99.2 | 0.056 | |||||
| 343 | 4.0 | 31.9 | 100.0 | 0.680 | 0.9 | 6.233 |
| 99.1 | 0.052 | |||||
As a further demonstration that a single radiative species had been formed via excitation, time-resolved fluorescence spectra of 2 were acquired from decay traces measured at different emission wavelengths. As can be seen in Fig. 5, the shapes and positions of the fluorescence bands obtained at different delay times were identical, only their relative intensities were different.
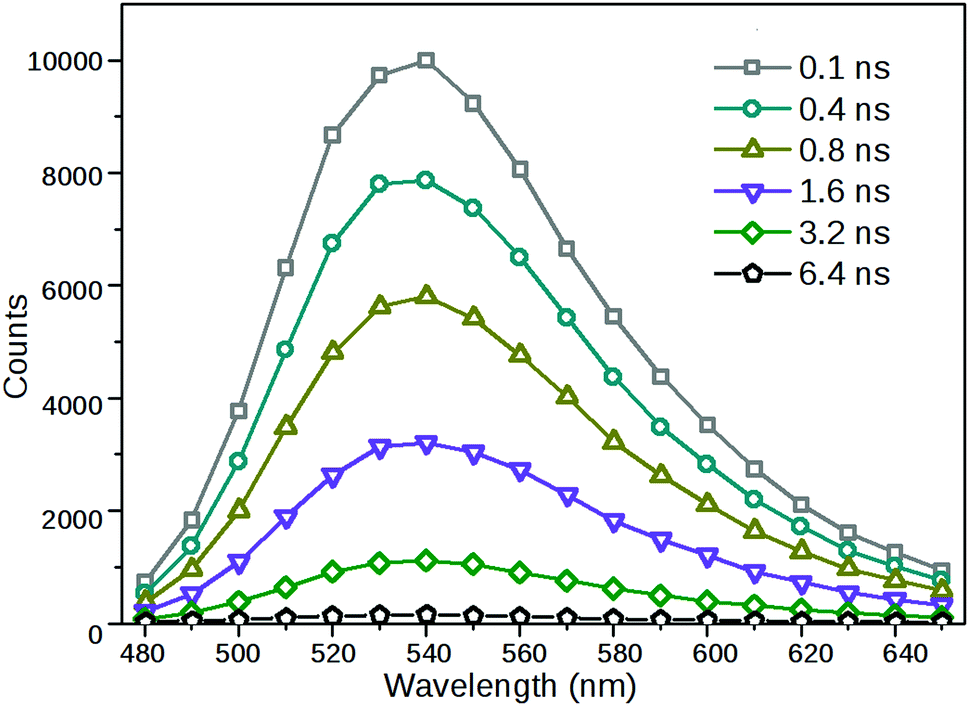 | ||
| Fig. 5 Time-resolved fluorescence spectra of 2 in MeCN. Excitation wavelength is 410 nm. | ||
The fitted lifetime data in the nitriles show that the decay kinetics of 2 is affected more strongly by the solvent polarity than the kinetics of 1 (Table 2 and Fig. 6). The relative weights of the slow components in the decays increase with decreasing solvent polarity which is a further signal that the non-radiative state of 2 has a much stronger charge transfer character than the radiative one. Besides, the measurements in EG at different temperatures show that the excited state kinetics of 2 is influenced by the solvent viscosity. The fast component accelerates at higher temperatures, i.e. at lower viscosities, supporting the hypothesis that the non-radiative state is a TICT state (Fig. 7).
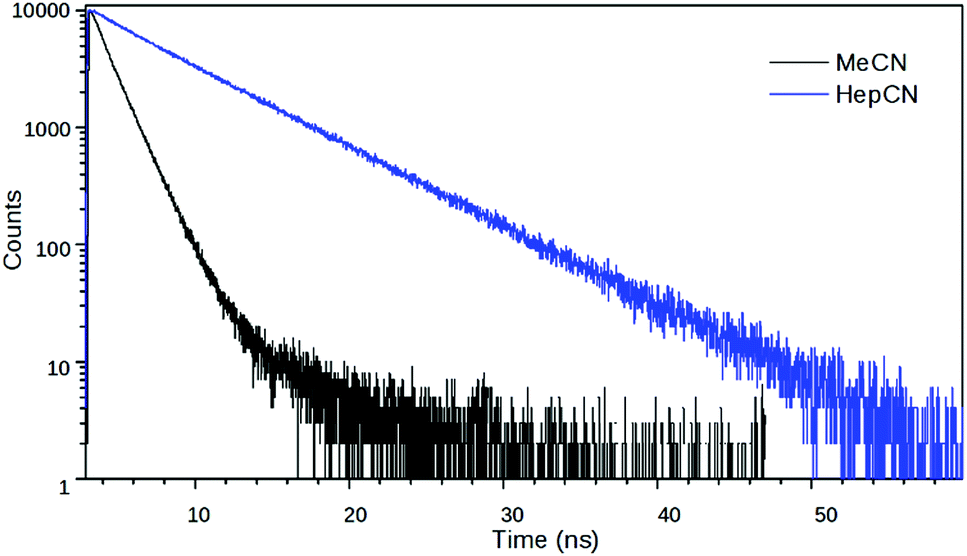 | ||
| Fig. 6 Fluorescence decay curves of 2 in MeCN and HepCN at 540 nm. | ||
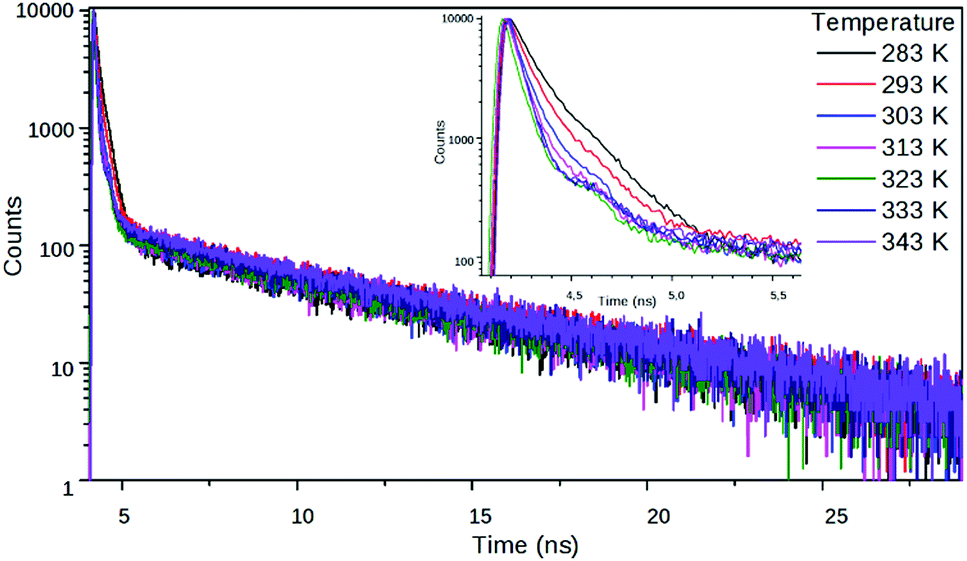 | ||
| Fig. 7 Fluorescence decay curves of 2 in EG at different temperatures at 540 nm. | ||
Kinetic analysis
Our experimental observations on the piperidino derivative 2 are consistent with the kinetic model shown in Scheme 1.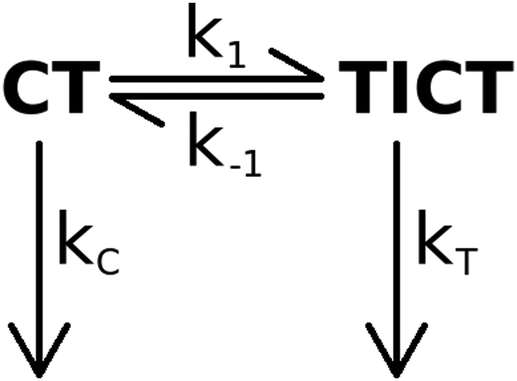 | ||
| Scheme 1 The proposed kinetic scheme for the excited state processes of 2. | ||
The rates can be determined using the first order differential equation system
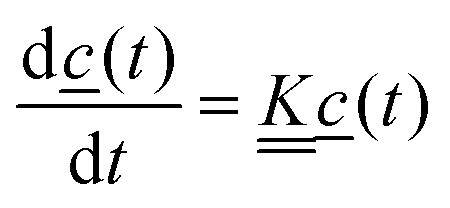 | (4) |
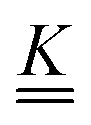 is a matrix of the rate coefficients,
with
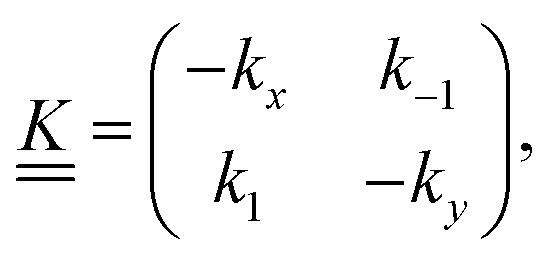
| kx = kC + k1 | (5) |
| ky = kT + k−1, | (6) |
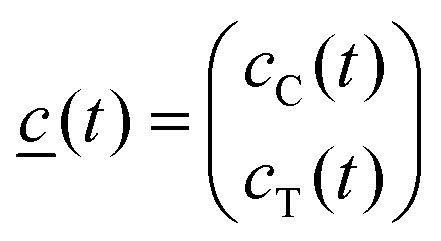
![[c with combining low line]](https://www.rsc.org/images/entities/i_char_0063_0332.gif) (t) is the vector of the concentrations as functions of time,
(t) is the vector of the concentrations as functions of time,the indices C and T refer to the excited state species CT and TICT, respectively.
Integrating eqn (4) with respect to the time we get,
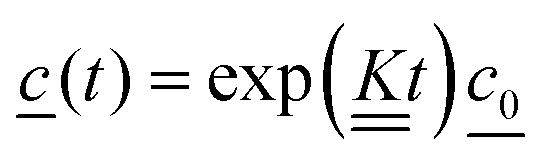 | (7) |
 is the concentration vector at t = 0.
The fluorescence lifetimes, τ1 and τ2 are the negative reciprocals of the eigenvalues of the  matrix, λ1 and λ2,
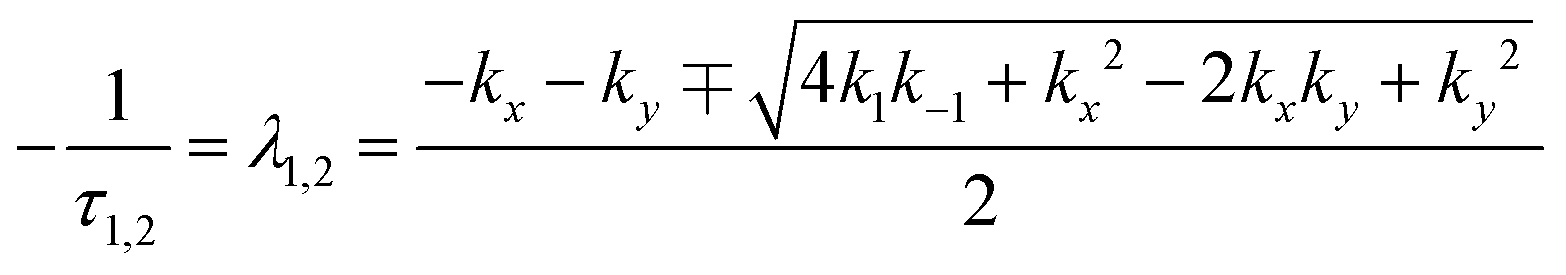 | (8) |
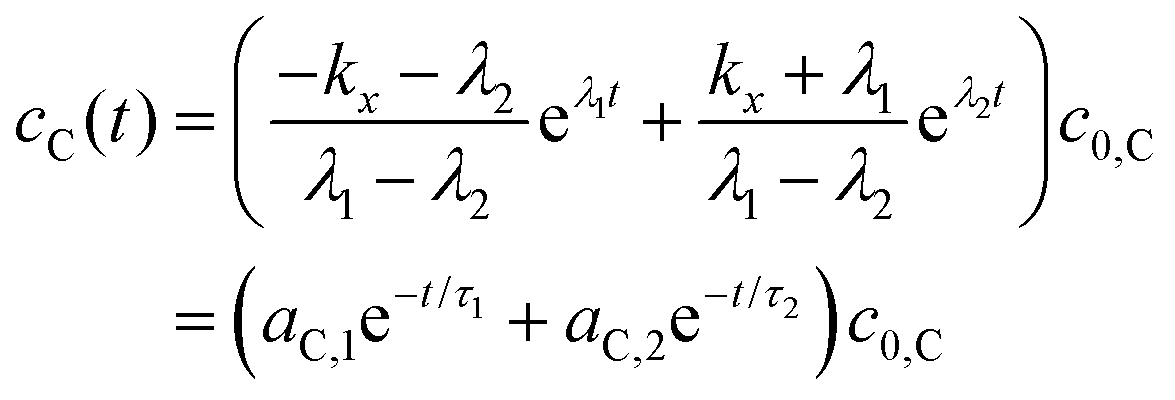 | (9) |
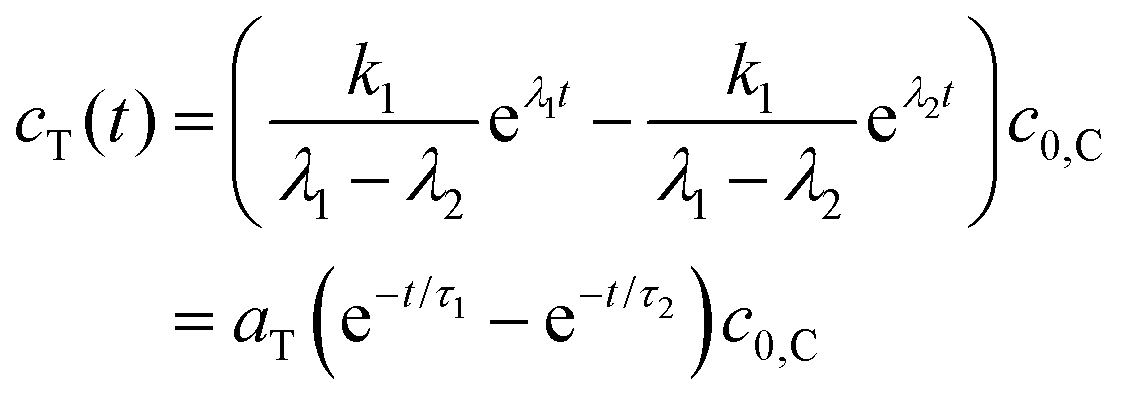 | (10) |
The TICT species is non-fluorescent in the present case. The time constants τ1 and τ2 in eqn (9) are provided by the fitting of the decay curves to biexponential functions, the ratio of ac,1 and ac,2 can be obtained as the ratio of the relative amplitudes of the two decay components (pairs of A values in Tables 2 and 3),
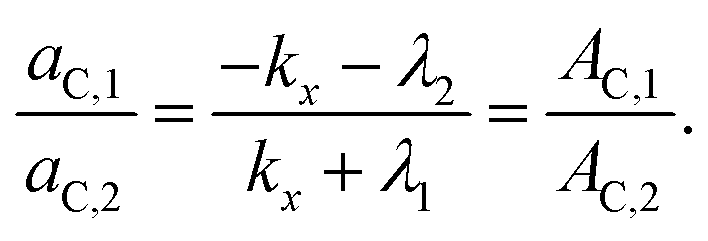 | (11) |
Of the four rate coefficients in Scheme 1, kC can be determined directly, measuring the fluorescence decay of the CT species in a frozen solvent glass.
k x can be calculated by eqn (11), from the time constants τ1(=−1/λ1), τ2(=−1/λ2) and amplitudes of the biexponential decay curves. Using that
| λ1 + λ2 = −kx − ky, | (12) |
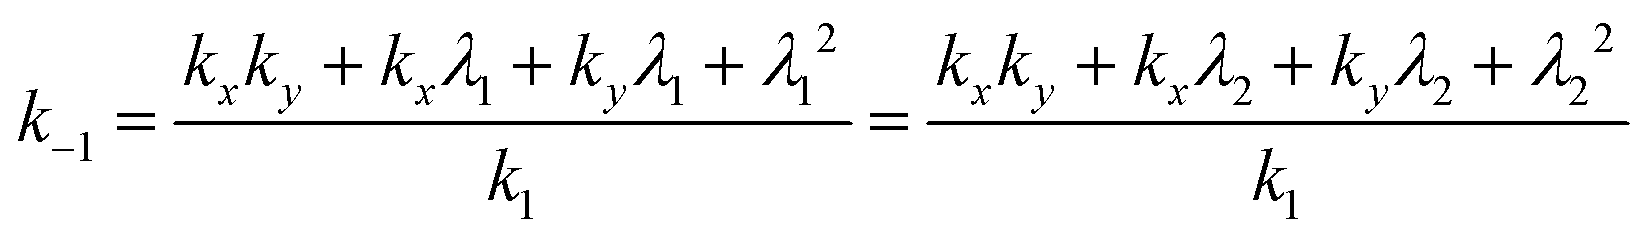 | (13) |
Finally kT can be calculated from eqn (6).
In a 4:1 EtOH:MeOH solvent mixture, 2 had a biexponential decay – with time constants (relative amplitudes) of 7.79 ns (1.4) and 0.188 ns (98.6) – whereas it had a monoexponential decay with a time constant of 9.68 ns at 77 K in frozen solvent glass where the turning of the piperidine unit is hampered so the TICT state cannot form (Fig. 8). The reciprocal of the latter lifetime was accepted as the value of kC. Subsequently, k1, k−1 and kT were calculated from the time constants and amplitudes, following the method described above.
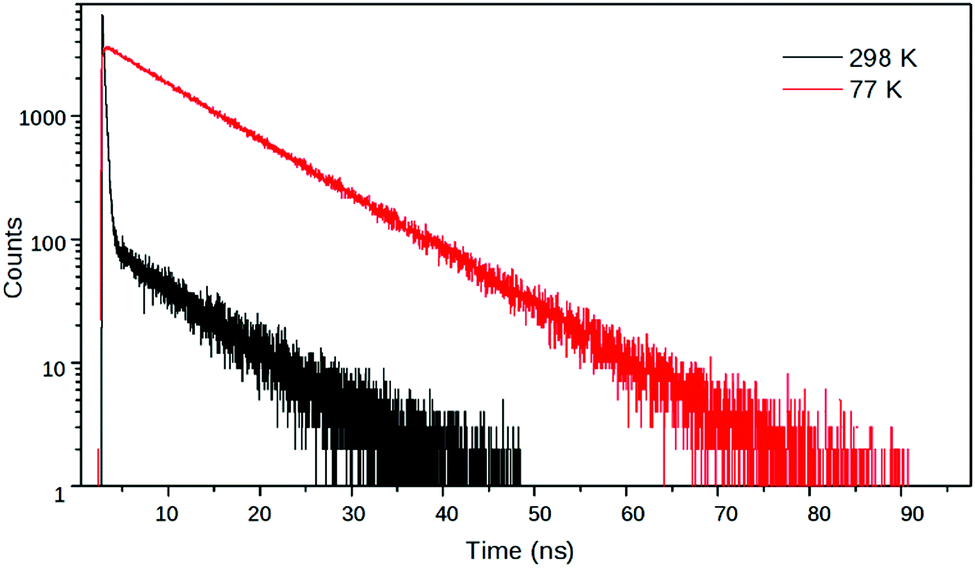 | ||
| Fig. 8 Fluorescence decay curves of 2 at λem = 540 nm in EtOH:MeOH (4:1) at room temperature and at 77 K in frozen solvent glass. | ||
As can be seen in Tables 4 and 5, k1 decreases with the decreasing solvent polarity and with increasing viscosity as is expected for a TICT state formation. Moreover, the kT rate coefficient shows only a minor sensitivity to the solvent polarity and is insensitive to the solvent viscosity.
| Temperature (K) | k 1 (ns−1) | k −1 (ns−1) | k T (ns−1) |
|---|---|---|---|
| 283 | 6.8 | 0.053 | 0.15 |
| 293 | 9.2 | 0.10 | 0.15 |
| 303 | 12 | 0.091 | 0.16 |
| 313 | 14 | 0.11 | 0.16 |
| 323 | 16 | 0.12 | 0.16 |
| 333 | 18 | 0.14 | 0.16 |
| 343 | 19 | 0.16 | 0.16 |
| Solvents | |||||
|---|---|---|---|---|---|
| MeCN | EtCN | PrCN | BuCN | ||
| 2 | k 1 (ns−1) | 0.671 | 0.292 | 0.171 | 0.165 |
| k −1 (ns−1) | 0.018 | 0.009 | 0.005 | 0.009 | |
| k T (ns−1) | 0.120 | 0.303 | 0.220 | 0.255 | |
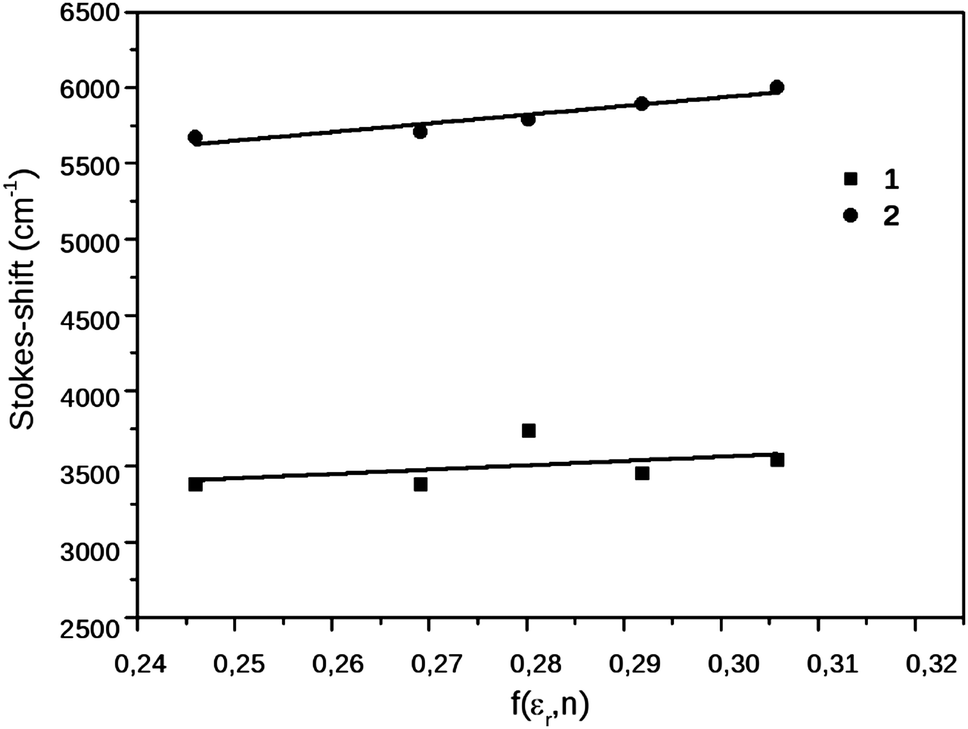
The simple Arrhenius plot of the k1–s, the rate coefficients of the CT → TICT process obtained in EG, shown in Fig. 9, is non-linear, suggesting that the effect of the viscosity should be taken in account. The ratio of k1/k−1, which can be considered the equilibrium constant of the excited state reaction, did not change significantly, which can be because the dielectric constant of EG changed only from 44 to 32.
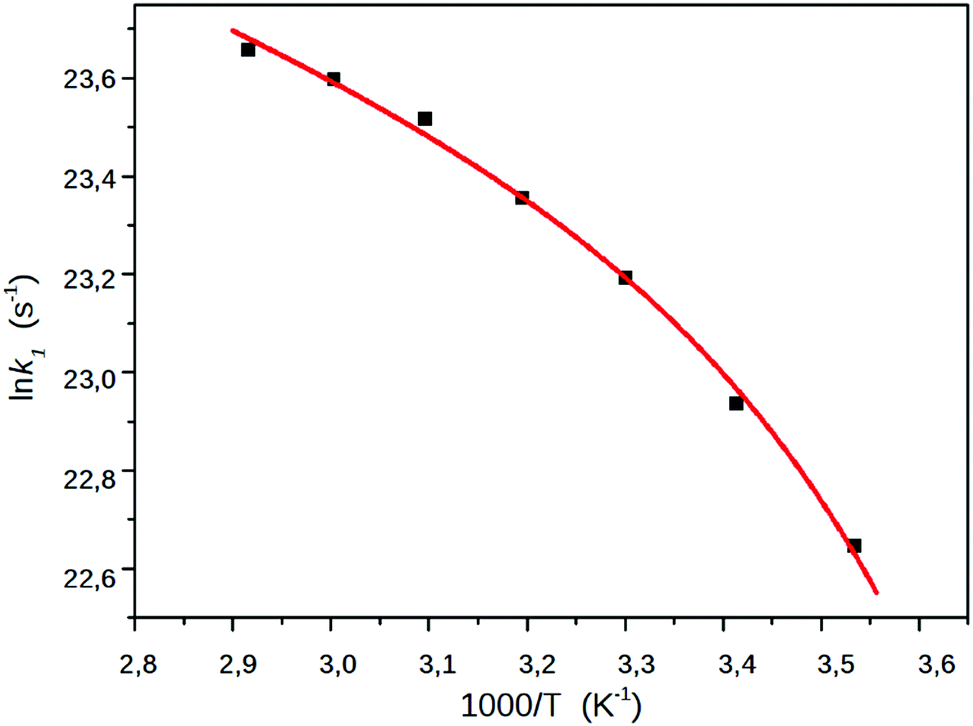 | ||
| Fig. 9 The Arrhenius plot of k1, the rate coefficient of the CT → TICT process in EG. The squares denote the experimentally determined k1 values, the red line represents a least square fitting to eqn (19). | ||
We can rule out that the non-linearity of the Arrhenius plot is related to solvent relaxation processes since the longitudinal relaxation time constant of EG at room temperature is around 10 ps,43,44 whereas the k1 rate coefficient at 293 K (9.2 ns−1) corresponds to a CT → TICT conversion slower by one order of magnitude. The effects of the viscosity and polarity on the reaction rate were taken into account by taking the activation energy as the sum of three contributions,45
| Ea ≈ E0 + Evisc + Epol | (14) |
The term Evisc was assumed as the energy of a disk rotating in a viscous fluid,46
 | (15) |
The third term in eqn (14) was considered as the solvation energy excess of 2 at the transition state (TS) in the CT-TICT reaction,
| Epol(T) = Esolv,TS(T) − Esolv,CT(T) | (16) |
The solvation energies were estimated using the Onsager-model, according which the energy of a solute with a dipole, μ, interacts with the Onsager reaction field, R, in a spherical cavity,47
 | (17) |
 | (18) |
The dipole moments of the CT and the TS species were calculated at the TD-DFT level (Fig. 10, 45° and −5°, respectively). The value of Epol was calculated with these dipole moments at the lowest and highest temperatures applied in the experiments (283 and 343 K) and only a difference of ∼0.2 kJ mol−1 was obtained. Therefore, the temperature dependence of this term was neglected and the Arrhenius equation was written in the
 | (19) |
 | ||
| Fig. 10 Theoretical results of 2 calculated at DFT/TD-DFT level along the dihedral angle – Φ – in vacuum, (a) potential curve (the proposed reaction path is denoted with green arrows), (b) dipole moments, (c) the boat → chair transformation of the piperidine unit. | ||
As can be seen in Fig. 9, a nice fitting can be achieved by introducing the viscosity dependence in the kinetic barrier with the use of the expression (19). The values of the parameters of the function shown in the graph are lnA = 26.07, E0 + Epol = 6.64 kJ mol−1 and b = 0.0415 kJ (cP mol)−1.
Quantum chemical calculations
The theoretical calculations were performed at the DFT and the TD-DFT levels to explore the mechanism of the TICT formation of 2 further. The S1 state optimization starting from the ground state structure resulted in a similar structure with only a minor change of the dihedral angle (from 46.1° to 43.7°) and with an increase of the dipole moment from 7.6 D to 12.2 D. The latter value is close to the experimental dipole moment of N-butyl-4-butylamino-1,8-naphthalimide in excited state.16 This structure represents the CT state of 2, the existence of which was proved experimentally by the solvatochromism of this naphthalimide derivative, shown in nitriles of different polarities.The potential curves were calculated in vacuum, along the dihedral angle between the piperidinyl moiety and the naphthalimide ring system at the DFT/TD-DFT level. Φ was changed by 10° in each step. The TICT state – the minimum on the S1 surface – was identified at a Φ of −88° with a dipole moment of 17.7 D (see Fig. 10a and b). Its dark state property was confirmed by the TD-DFT calculation which resulted in a zero oscillator strength for the corresponding S1 → S0 vertical transition. In contrast, the CT state proved emissive also by the calculations, an oscillator strength of 0.224 was obtained for the vertical S1 → S0 deexcitation from the relaxed CT state.
As can be seen in Fig. 10a, the energy falls monotonously in the direction of the larger Φ angles (for the direction of the rotation see Fig. 1), which may suggest a barrierless process. A comparison of the optimized structures with fixed dihedral angles, however, reveals that there is a chair → boat conformational change of the piperidinyl unit at Φ = 55° (Fig. 10c). Probably, this arises from the repulsion of the H atoms at the bond between the piperidinyl and 1,8-naphthalimide moieties. A similar excited state folding motion of the piperidinyl group was investigated in detail experimentally in the case of some piperidinyl electron donor–other acceptor systems by Verhoeven et al. and barriers between 29 and 33 kJ mol−1 were obtained.48 In the direction of smaller Φ angles a barrier of 19.5 kJ mol−1 was obtained and the chair conformation of the piperidine ring was retained, suggesting that the turning is more probable in this direction. The dipole moment (see Fig. 10b) did not change significantly on the S1 surface until Φ reached −35° then it increased rapidly to its maximum in the TICT state where three bonds around the piperidine N atom are coplanar.
Natural bond orbital analysis were performed on the stationary points of the S1 surface (corresponding to the CT and the TICT structures) to investigate the changes in the electronic structures. In the CT state, the orbitals of the piperidine nitrogen which form the bond with the piperidine carbons, are in sp2.16 and sp2.17 hybridization states and the orbital forming the bond with the naphthalimide carbon is in sp1.78 hybridization state. In the TICT state, the bonding orbitals are purely in sp2 hybridization state (sp1.98, sp2.02 and sp2.00, respectively) as a result of the planar structure. The lone pairs are in p (>99%) hybridization state in both cases.
It is instructive to inspect the shapes of the frontier molecular orbitals (MOs) (Fig. 11). The highest occupied MO (HOMO) of the CT state is located on the nitrogen and on the aromatic naphthalimide unit in similar amounts, the LUMO primarily on the aromatic system. In the TICT state the HOMO is purely on the piperidinyl unit, the LUMO is localized mainly on the aromatic system. This result clearly demonstrates that the charge transfer is more pronounced in the TICT state which has a higher dipole moment since the excited states correspond to a completely (>97% in both cases) HOMO → LUMO excitations.
 | ||
| Fig. 11 The calculated molecular orbitals of the stationary points on the S1 surface at TD-DFT level. | ||
Conclusions
In this paper, an experimental proof was presented for the formation of the TICT state in a 1,8-naphthalimide based push–pull system. The fluorescence decay data were analyzed using a two state system kinetic scheme. The viscosity and polarity dependent rate constants support the hypothesis that the TICT state formation is the main quenching process of the radiative excited state, CT, of 4-piperidinyl-1,8-naphthalimide. The monoexponential fluorescence decay in frozen solvent glass is a further evidence. A modified Arrhenius equation was employed on the excited state kinetic data in ethylene glycol which resulted in a nice fitting and in this way, we could extract the intrinsic activation energy of the TICT state formation.The theoretical calculations show that the TICT species has a much stronger charge transfer character compared to the former CT state. Moreover, the results suggest that the turning is more likely in the direction of smaller Φ dihedral angles because there is a higher barrier of a conformational change in the other direction. Probably it is because of the repulsion of the H atoms at the bond between the piperidinyl and 1,8-naphthalimide moieties. The calculations confirm that the TICT state is dark and has a higher dipole moment compared the CT state. We hope that our results will help the development of novel 1,8-naphthalimide based molecular switches/probes and the investigation of their TICT states.
Conflicts of interest
There are no conflicts to declare.Acknowledgements
Financial support for this research was provided by Hungarian NKFIH (grant K 108752), LASERLAB-EUROPE (grant agreement no. 654148, European Union's Horizon 2020 research and innovation programme), European Union MSCA-ITN-2015-ETN Action program, ISPIC, under grant no. 675743 and Netherlands Organisation for Scientific Research in the framework of the Fund New Chemical Innovation (2015) TA under grant no. 731.015.206. The computing time granted on the Hungarian HPC Infrastructure at NIIF Institute, Hungary, is gratefully acknowledged.References
- A. P. de Silva, H. Q. N. Gunaratne, T. Gunnlaugsson, A. J. M. Huxley, C. P. McCoy, J. T. Rademacher and T. E. Rice, Chem. Rev., 1997, 97, 1515–1566 CrossRef CAS PubMed.
- R. A. Bissell, A. P. de Silva, H. Q. N. Gunarane, P. L. M. Lynch, G. E. M. Maguire, C. P. McCoy and K. R. A. S. Sandanayake, Top. Curr. Chem., 1993, 168, 223–264 CrossRef CAS.
- G. R. C. Hamilton, S. K. Sahoo, S. Kamila, N. Singh, N. Kaur, B. W. Hyland and J. F. Callan, Chem. Soc. Rev., 2015, 44, 4415–4432 RSC.
- A. P. de Silva, H. Q. N. Gunaratne and C. P. McCoy, Nature, 1993, 364, 42–44 CrossRef.
- R. M. Duke, E. B. Veale, F. M. Pfeffer, P. E. Kruger. and T. Gunnlaugsson, Chem. Soc. Rev., 2010, 39, 3936–3953 RSC.
- D. Wang, X. Zhang, C. He and C. Duan, Org. Biomol. Chem., 2010, 8, 2923–2925 CAS.
- J. B. Czirok, M. Bojtár, D. Hessz, P. Baranyai, L. Drahos and M. Kubinyi, I. Bitter, Sens. Actuators, B, 2013, 182, 280–287 CrossRef CAS.
- G. S. Loving and B. Imperiali, J. Am. Chem. Soc., 2008, 130, 13630–13638 CrossRef CAS PubMed.
- G. S. Loving, M. Sainlos and B. Imperiali, Trends Biotechnol., 2009, 28, 73–83 CrossRef PubMed.
- V. Wintgens, P. Valat, J. Kossanyi, L. Biczok, A. Demeter and T. Bérces, J. Chem. Soc., Faraday Trans., 1994, 90, 411–421 RSC.
- V. Wintgens, P. Valat, J. Kossanyi, A. Demeter, L. Biczok and T. Bérces, New J. Chem., 1996, 20, 1149–1158 CAS.
- E. Martín, J. L. G. Coronado, J. J. Camacho and A. Pardo, J. Photochem. Photobiol., A, 2005, 175, 1–7 CrossRef.
- L. Biczók, P. Valat and V. Wintgens, Phys. Chem. Chem. Phys., 1999, 1, 4759–4766 RSC.
- S. Saha and A. Samanta, J. Phys. Chem. A, 2002, 106, 4763–4771 CrossRef CAS.
- A. Pardo, J. M. L. Poyato, E. Martin, J. J. Camacho, D. Reyman, M. F. Brana and J. M. Castellano, J. Photochem. Photobiol., A, 1989, 46, 323–328 CrossRef CAS.
- A. P. de Silva, H. Q. N. Gunaratne, J. L. Habib-Jiwan, C. P. McCoy, T. E. Rice and J. P. Soumillion, Angew. Chem., Int. Ed., 1995, 34, 1728–1731 CrossRef.
- X. T. Jia, Y. Yang, Y. F. Xu and X. H. Qian, Pure Appl. Chem., 2014, 86, 1237–1246 CrossRef CAS.
- S. Zheng, P. L. M. Lynch, T. E. Rice, T. S. Moody, H. Q. N. Gunaratne and A. P. de Silva, Photochem. Photobiol. Sci., 2012, 11, 1675–1681 CAS.
- P. A. Panchenko, A. N. Arkhipova, O. A. Fedorova, Y. V. Fedorov, M. A. Zakharko, D. E. Arkhipova and G. Jonusauskas, Phys. Chem. Chem. Phys., 2017, 19, 1244–1256 RSC.
- Y. Luo, Y. Wang, S. Chen, N. Wang, Y. Qi, X. Zhang, M. Yang, Y. Huang, M. Li, J. Yu, D. Luo and Z. Lu, Small, 2017, 13, e1604113 CrossRef PubMed.
- F. Y. Y. Wang, W. Zhu, Y. Huang, M.-H. Yang, H. Ai and Z.-Y. Lu, RSC Adv., 2014, 4, 36849–36853 RSC.
- T. Liu, X. Liu, D. R. Spring, X. Qian, J. Cui and Z. Xu, Sci. Rep., 2014, 4, e5418 CrossRef PubMed.
- Y. Sun, X. H. Liang, J. Fan and Q. Han, J. Lumin., 2013, 141, 93–98 CrossRef CAS.
- Y. Qian, M.-M. Cai, L.-H. Xie, G.-Q. Yang, S.-K. Wu and W. Huang, ChemPhysChem, 2011, 12, 397–404 CrossRef CAS PubMed.
- Y. Qian, M.-M. Cai, X.-H. Zhou, Z.-Q. Gao, X.-P. Wang, Y.-Z. Zhao, X.-H. Yan, W. Wei, L.-H. Xie and W. Huang, J. Phys. Chem. C, 2012, 116, 12187–12195 CAS.
- J.-W. Li, Y. Qian, L.-H. Xie, Y.-P. Yi, W.-W. Li and W. Huang, J. Phys. Chem. C, 2015, 119, 2133–2141 CAS.
- M. A. Landey-Alvarez, A. Ochoa-Teran, G. Pina-Luis, M. Martinez-Quiroz, M. Aguilar-Martiínez, J. Elias-Garcia, V. Miranda-Soto, J.-Z. Ramirez, L. Machi-Lara, V. L. Galvan and M. Ordonez, Supramol. Chem., 2016, 28, 892–906 CrossRef CAS.
- A. T. Peters and M. J. Bide, Dyes Pigm., 1985, 6, 349–375 CrossRef CAS.
- E. Lippert, Z. Elektrochem., 1957, 61, 962–975 CAS.
- N. Mataga, Y. Kaifu and M. Koizumi, Bull. Chem. Soc. Jpn., 1956, 29, 465–470 CrossRef CAS.
- M. J. Frisch, G. W. Trucks, H. B. Schlegel, G. E. Scuseria, M. A. Robb, J. R. Cheeseman, G. Scalmani, V. Barone, B. Mennucci, G. A. Petersson, H. Nakatsuji, M. Caricato, X. Li, H. P. Hratchian, A. F. Izmaylov, J. Bloino, G. Zheng, J. L. Sonnenberg, M. Hada, M. Ehara, K. Toyota, R. Fukuda, J. Hasegawa, M. Ishida, T. Nakajima, Y. Honda, O. Kitao, H. Nakai, T. Vreven, J. A. Montgomery, Jr., J. E. Peralta, F. Ogliaro, M. Bearpark, J. J. Heyd, E. Brothers, K. N. Kudin, V. N. Staroverov, R. Kobayashi, J. Normand, K. Raghavachari, A. Rendell, J. C. Burant, S. S. Iyengar, J. Tomasi, M. Cossi, N. Rega, J. M. Millam, M. Klene, J. E. Knox, J. B. Cross, V. Bakken, C. Adamo, J. Jaramillo, R. Gomperts, R. E. Stratmann, O. Yazyev, A. J. Austin, R. Cammi, C. Pomelli, J. W. Ochterski, R. L. Martin, K. Morokuma, V. G. Zakrzewski, G. A. Voth, P. Salvador, J. J. Dannenberg, S. Dapprich, A. D. Daniels, Ö. Farkas, J. B. Foresman, J. V. Ortiz, J. Cioslowski and D. J. Fox, Gaussian 09, Revision C, Gaussian, Inc., Wallingford CT, 2009 Search PubMed.
- J. B. Birks, J. Res. Natl. Bur. Stand., Sect. A, 1976, 80, 389–399 CrossRef.
- M. J. Adams, J. G. Highfield and G. F. Kirkbright, Anal. Chem., 1977, 49, 1850–1852 CrossRef CAS.
- MarvinSketch 16.4.25, ChemAxon, 2016, http://chemaxon.com Search PubMed.
- J. J. P. Stewart, MOPAC2016, Stewart Computational Chemistry, Colorado Springs, CO, USA, 2016, http://OpenMOPAC.net Search PubMed.
- J. Řezáč and P. Hobza, J. Chem. Theory Comput., 2012, 8, 141–151 CrossRef PubMed.
- J. P. Perdew, K. Burke and M. Ernzerhof, Phys. Rev. Lett., 1996, 77, 3865–3868 CrossRef CAS PubMed.
- C. Adamo and V. Barone, J. Chem. Phys., 1999, 110, 6158–6169 CrossRef CAS.
- A. Pardo, J. M. L. Poyato and E. Martin, J. Photochem., 1987, 36, 323–329 CrossRef CAS.
- A. K. Coker, Ludwig's Applied Process Design for Chemical and Petrochemical Plants, Elsevier, 4th edn, 2015 Search PubMed.
- D. R. Lide, Handbook of chemistry and physics, 84th edn, CRC Press, 2003 Search PubMed.
- R. C. Evans, P. Douglas and H. D. Burrow, Applied Photochemistry, Springer, 2013 Search PubMed.
- M. Hecht and W. R. Fawcett, J. Phys. Chem., 1996, 100, 14248–14255 CrossRef CAS.
- A. Declémy, C. Rulliére and P. Kottis, Laser Chem., 1990, 10, 413–429 CrossRef.
- Z. R. Grabowski, K. Rotkiewicz and W. Rettig, Chem. Rev., 2003, 103, 3899–4031 CrossRef PubMed.
- L. T. Watson and C. Y. Wang, Phys. Fluids, 1979, 22, 2267–2269 CrossRef.
- R. O. Watts, Mol. Phys., 1974, 28, 1069–1083 CrossRef CAS.
- B. Bleisteiner, T. Marian, S. Schneider, A. M. Brouwer and J. W. Verhoeven, Phys. Chem. Chem. Phys., 2001, 3, 5383–5392 RSC.
| This journal is © the Owner Societies 2018 |