
 Open Access Article
 This Open Access Article is licensed under a
 Creative Commons Attribution 3.0 Unported Licence
Examination of inequivalent wetting on the crystal habit surfaces of RS-ibuprofen using grid-based molecular modelling
I.
Rosbottom
 *a,
J. H.
Pickering
a,
B.
Etbon
b,
R. B.
Hammond
a and
K. J.
Roberts
a
*a,
J. H.
Pickering
a,
B.
Etbon
b,
R. B.
Hammond
a and
K. J.
Roberts
a
aCentre for the Digital Design of Drug Products, School of Chemical and Process Engineering, University of Leeds, LS2 9JT, UK
bEPSRC Centre for Doctoral Training in Complex Particulate Products and Processes, School of Chemical and Process Engineering, University of Leeds, LS2 9JT, UK. E-mail: i.rosbottom@leeds.ac.uk
First published on 17th April 2018
Abstract
Synthonic engineering tools, including grid-based searching molecular modelling, are applied to investigate the wetting interactions of the solute and four crystallisation solvents (ethanol, ethyl acetate, acetonitrile and toluene) with the {100}, {001} and {011} forms of RS-ibuprofen. The grid-based methods, in particular the construction of a crystal slab parallel to a given plane in a coordinate system with one axis perpendicular to the surface, are defined in detail. The interaction strengths and nature (dispersive, hydrogen bonding (H-bonding) or coulombic forces) are related to the crystal growth rates and morphologies. The solute is found to interact strongest with the capping {011}, then the side {001} and weakest with the top {100} habit surfaces. The solute interactions with the {100} and {001} surfaces are found to be almost solely dominated by dispersive force contributions, whilst the same with the {011} surfaces are found to have a greater contribution from H-bonding and coulombic forces. The increased surface rugosity, at the molecular level of the {011} surfaces, results in a favourable docking site in a surface ‘valley’, not present in the {100} and {001} surfaces. The H-bonding solvents ethanol, acetonitrile and ethyl acetate are found to strongly interact with the {011} surfaces and weakly with the {001} surfaces, with the {011} interactions having a much greater contribution from H-bonding and coulombic forces. The interaction energies of the apolar and aprotic solvent toluene, with the {011} and {001} surfaces, are found to be very close. Toluene is found having slightly stronger interactions with the {001} than the {011} surfaces, which are all dominated by dispersive interactions. The ratio of the average energy of the top 100 solvent interactions with the {001} surface divided by the average energy of the top 100 interactions with the {011} surface is compared to the ratio of the experimentally measured growth rates of the same forms. In general, the interaction energy ratio is found to have an inverse ratio with the growth rates, implying that the solvents which are calculated to interact strongly with a particular surface are impeding the growth of that surface and reducing the growth rate, in turn impacting upon the final morphology of the material.
1. Introduction
It has been frequently observed that not only can the different surfaces of organic molecular crystals grow at different rates, but that these face-specific growth rates can vary depending on the solvent from which the material is crystallised, thus impacting upon the solvent dependent crystal morphology.1–5 For example, in the case of needle-shaped crystals where the faces forming the ‘tip’ of the needle (capping faces) grow very much faster than the rest. Such undesired morphologies can usually cause problems for the downstream unit processes associated with pharmaceutical product manufacture, such as filtration, compression and granulation.6 Since the experimental screening of crystalline morphologies from a variety of solvents can be expensive, time consuming and environmentally unfriendly, predictive computational techniques can be exploited to guide the solvent selection for crystallisation, such that an optimal crystal morphology for downstream processing can be produced.Bennema and van der Eerden, upon examination of the interfacial forces associated with crystallisation from solution, derived a molar enthalpy (ΔH(T)diss) associated with the making and breaking of the intermolecular forces (Φi) over all the molecules of i associated with the crystallisation process,7–9 expressed as:
 | (1) |
(1) Equivalent wetting – it is assumed that solid–fluid interactions at the crystal/solution interface are equivalent to the solid–fluid interactions in the bulk solution (Φδfi = θsf), where sf refers to solid–fluid interaction in the bulk liquid phase. Hence, this assumes that the solvent impacts on the growth of each surface (hkl) equally.
(2) Surface/bulk structure equivalence – it is assumed that the molecular structure of the crystal surface is a perfect termination of the bulk structure and that no surface relaxation of the molecular structure takes place, therefore Φδδi = θss, where the superscript ss refers to the intermolecular interactions in the bulk crystal structure.
(3) The proportionality relationship – it is assumed that the three bond energies involved in crystallisation Φδfi, Φffi and Φδδi are in the same ratio for any crystal surface (hkl) i.e. the structural and surface chemistry is not anisotropic.
The bulk and surface physical properties of a molecular crystal can be predicted, using Synthonic Engineering tools,10 through a calculation of the bulk (intrinsic synthons) and surface terminated (extrinsic synthons) intermolecular interactions and,11–14 often achieved by using a suitable interatomic potential.15,16 Similarly, applying the three assumptions previously mentioned, the surface properties (including crystal morphology) can be predicted through attachment energy calculations.12,14,17–21
The attachment energy theory has been effectively used to predict the crystal morphology of crystals formed in a vacuum or at low driving forces from solution.17 However, the enhanced supersaturations that are often employed in solution crystallisation and variations in crystalline surface chemistries, can result in different crystalline surfaces growing according to different growth mechanisms, which can strongly impact upon the resultant ‘as grown’ crystal morphology.1,22,23
Though there has been some evidence for some surface reconstruction of conformationally flexible molecules,24 the surface to bulk equivalence assumption has been effectively used to model the crystal morphology of organic materials.12,14,19,25–27 However, molecular modelling techniques have been developed to calculate bulk solution and interfacial intermolecular interactions of a crystal in contact with a solution,28,29 hence attempting to address the equivalent wetting and proportionality assumptions.
Molecular dynamics (MD) simulations can be effective in predicting the de-solvation of a crystal surface, de-solvation of the solute from the bulk solution and the docking and integration of the solute into the crystal surface.30–32 However, the challenges of running physically realistic MD simulations and their high computational costs, makes it difficult to apply MD to a wide range of systems. MD simulations typically require multiple equilibration steps prior to sampling, and in the sampling can take hours or days to capture statistically significant data which usually requires expert analysis of the atomistic trajectories. However, it is important to consider that these simulations can provide detailed molecular behaviour at the crystal solution interface, which can impact upon not only crystal growth kinetics, but also secondary nucleation.
Hence, more computationally efficient methods have been applied to calculating the solvent-dependent morphologies of organic materials.29,33–35 In particular, the development of grid-based searching methods at the single molecule and crystal surface level has been effective in the modelling of crystalline properties, such as solving structures from powder X-ray diffraction data,36 solvent-dependent crystal morphologies,5,29 impurity segregation37,38 and excipient interactions with active pharmaceutical ingredient crystals.39 By comparison, although the grid based search methods use a more approximate approach of the solution–surface interactions, these simulations require only a molecular structures of the host and probe species, whereby the simulation often takes minutes on a laptop computer, and the outputted data requires no further processing. Hence, in this respect grid based search methods compliment MD simulations, providing a means of quickly assessing solvent wettability and potentially guiding the modeller regarding which solvents to run more complex simulations on.
Though these computationally efficient simulation methods have shown some success in predicting the solvent dependent morphologies of stable and facetted materials, it has proved difficult to develop a robust technique for predicting the solvent-dependent behaviour of needle-like crystals. A significant factor in this reflects the unstable nature of the growth of these materials along the needle-axis.40,41
RS-ibuprofen is a non-steroidal anti-inflammatory drug that is widely used in the treatment of pain, fever and inflammation. It has a well characterised needle-like crystal morphology42 and surface chemistry,26 though its crystal morphology and surface specific crystal growth rates can be significantly influenced by solvent selection.1 This overall issue is addressed in this paper, which examines the interactions of ethanol (EtOH), ethyl acetate (EtOAc), acetonitrile (ACN) and toluene (Tol) with the morphologically important surfaces of RS-ibuprofen using the grid-based systematic search method. This analysis is coupled with the calculations of the solute interactions with the crystal surface and linked to its overall crystal morphology and growth rates when crystallised from these four solvents.
2. Computational modelling methodology
It should be noted that subsets of the faces in a morphology are related by symmetry into forms,43 all the faces within a form will have the same surface chemistry. The significant forms for RS-ibuprofen are {100} = {(100), (−100)}, {011} = {(011), (01−1), (0−11), (0−1−1)} and {001} = {(001), (00−1)}.2.1. Creation of surface terminated slabs from crystal structure
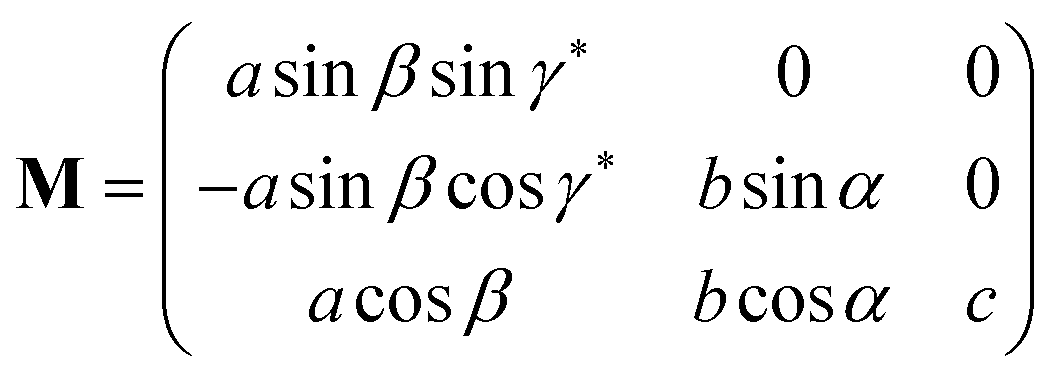
The basis vectors for a direct-space unit cell may be subjected to a change in length and/or orientation using the linear transformation indicated by eqn (2)| (a′, b′, c′) = (a, b, c)P | (2) |
Similarly the basis vectors for a reciprocal-space unit cell may be subjected to a change in length and/or orientation using the linear transformation indicated by eqn (3)
| (a*′, b*′, c*′)T = Q(a*, b*, c*)T | (3) |
Now for a given crystal lattice the matrices P and Q are related as matrix and inverse matrix hence eqn (4).
| P = Q−1 | (4) |
 | (5) |
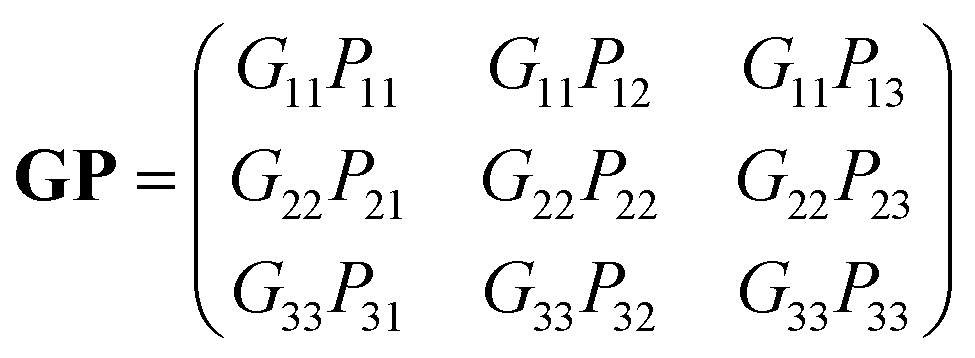
| G′ = PTGP | (6) |
| G′ = (Q−1)TGQ−1 | (7) |
 | (8) |
 | (9) |
 | (10) |
 | (11) |
 . If the original direct space lattice has mutually orthogonal unit cell edges then the metric tensor, G, has the form given by eqn (12). Then the product of the matrices G and P is a matrix of the form given by eqn (13). For the angle α′ in the transformed direct lattice to be equal to 90° then eqn (14) must be satisfied.
 | (12) |
 | (13) |
G23′ = b′c′![[thin space (1/6-em)]](https://www.rsc.org/images/entities/char_2009.gif) cosα′ = (PT)2j(GP)i3 = P12G11P13 + P22G22P23 + P32G33P33 = 0 cosα′ = (PT)2j(GP)i3 = P12G11P13 + P22G22P23 + P32G33P33 = 0 | (14) |
2.2. Stable surface termination selection
The lattice energy, along with the slice and attachment energies, was calculated in HABIT98 using a method outlined in previous publications.19,26 The most stable surface termination was determined by shifting the surface termination by 0.1 d-spacing (dhkl) through one full d-spacing, and the termination with the lowest absolute value of attachment energy was assumed to be the most stable surface termination.2.3. SystSearch of the morphologically important surfaces
SystSearch, short for systematic surface search, is a software package developed at the University of Leeds,44 for calculating the rigid body interaction energies between probe molecules and crystal surfaces. The interaction energies are found by locating the probe at points in a grid on and above the surface. At each grid point the probe is rotated through a grid of points in a rotational space of Euler angles. Finally, at each point in the six dimensional combined spatial-rotational grid, the interaction energy between the surface and the probe is calculated. The calculations of the interaction energies were carried out using a rigid body method, with no surface relaxation, using the Dreiding II16 atomic force field, and electrostatic potential energies based on partial charges calculated using the Gasteiger method.45,46 The Dreiding forcefield contains separate functions for calculating the van der Waals (dispersive), hydrogen bonding (H-bonding) and coulombic interactions, hence the contribution of each type of interaction to the intermolecular interaction can be quantified.The spatial part of the grid will generally cover one rectilinear area (projection of unit cell on a plane). However, the slab is built of multiple unit cells, which surround the central unit cell where the grid is positioned above. Construction and search of just a single cell could result in unphysical edge effects, since the structure continues into multiple unit cells in reality. Therefore, when the probe searches the outer edges of the unit cell, the interactions with the molecules in the surrounding unit cells are also calculated to ensure that the search calculates all possible interactions with the fully periodic surface.
Internally SystSearch operated by following the following four stages.
(1) All the atoms in the crystal molecules and the probe must be given a type, with respect to the chosen inter-atomic potential. They must also be given a partial charge using the Gasteiger algorithm.
(2) A slab, representing a crystal face, must be constructed using the methods described in Sections 2.1 and 2.2. The thickness and termination of the slab can be defined by the user in terms of fractions of d-spacing.
(3) The probe will have been input in an unknown coordinate system, not related to the crystal or slab systems, and as a result the probes coordinates must be unified with those of the slab. Also the coordinates must be unified in a manner such that if the same probe molecule is input in two different coordinate systems, it will yield the same results. To achieve this, the following two steps are used. The centre of coordinates is calculated and the atoms in the probe shifted to new coordinates based at the centre of geometry. Second the inertia tensor of the probe is calculated, then the eigenvectors and eigenvalues of the tensor are found. The atoms coordinate are now transformed to the coordinated based on the eigenvectors taken in descending order of the size of the eigenvalues.
(4) The probe is now translated to each spatial point, at each of which it is rotated into each point in the rotational grid. At each point in the spatial-rotational grid the interaction energy is found by summing the interatomic energies of each atom of the probe with every atom of the molecules in the slab. The summation is shown in equation N.
The summation of the interaction energy Eint for an interatomic potential V is given by the following equation.
 | (15) |
In which Nprobe is the number of atoms in the probe, Nmols is the number of molecules in the slab, and Natoms is the number of atoms in the jth molecule of the slab and V is the interatomic potential used to calculated the intermolecular interaction strength.
An example of the functional form of the interatomic potential published by Mayo and co-workers16 is shown in eqn (16). The vdW, hydrogen bonding and electrostatic interactions between atom i in the origin molecule and atom j in all of the other surrounding molecules is calculated as follows:
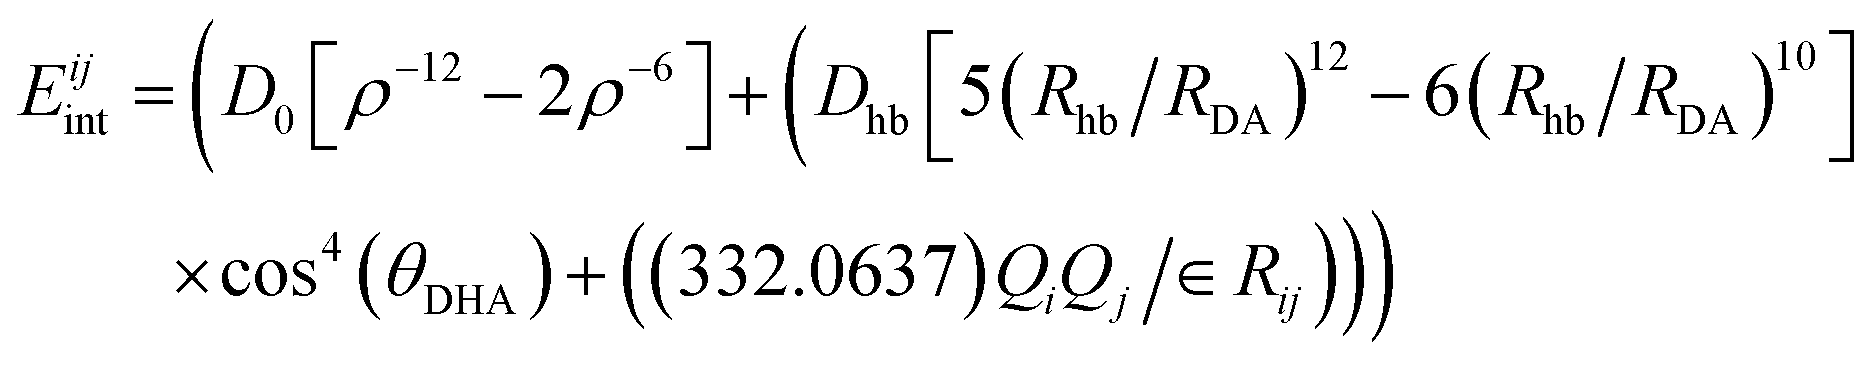 | (16) |
A user defined minimum interaction energy cut off (for this study it was set to −2 kcal mol−1) can be applied to filter weak or strongly repulsive interactions which would be considered either unphysical or unlikely to greatly influence the surface–solution interaction. The coloured cubes represent positions on the grid that have returned at least one probe-surface interaction energy greater (more negative) than −2 kcal mol−1, whilst white tetrahedrons represent positions on the grid that have returned only interaction energies which are weaker (more positive) than −2 kcal mol−1. For each surface examined the SystSearch was applied using the default parameters, and then the grid was optimised such that no strong interactions were missed by the grid being too far away or too close to the surface. The grid was deemed to be in an acceptable position when the grid row closest and furthest away from the surface contained only white tetrahedrons. This ensures that the grid has searched close enough to the surface such that any interactions closer to the surface than the grid are likely to be unphysical repulsions, and that any interactions further away from the grid are likely to be weak and uninfluential on the surface behaviour. The grid position was optimised by adjusting the grid size in the x-direction and the grid x-offset.
3. Results and discussion
Fig. 1 shows example morphologies of RS-ibuprofen from EtOH, EtOAc, ACN and Tol. The needle like morphology is caused by the faces in {011} form having a much higher growth rate in solution, when compared to the same from prediction26 or from the vapour phase.42 As a result the {011} faces will be referred to as the capping faces.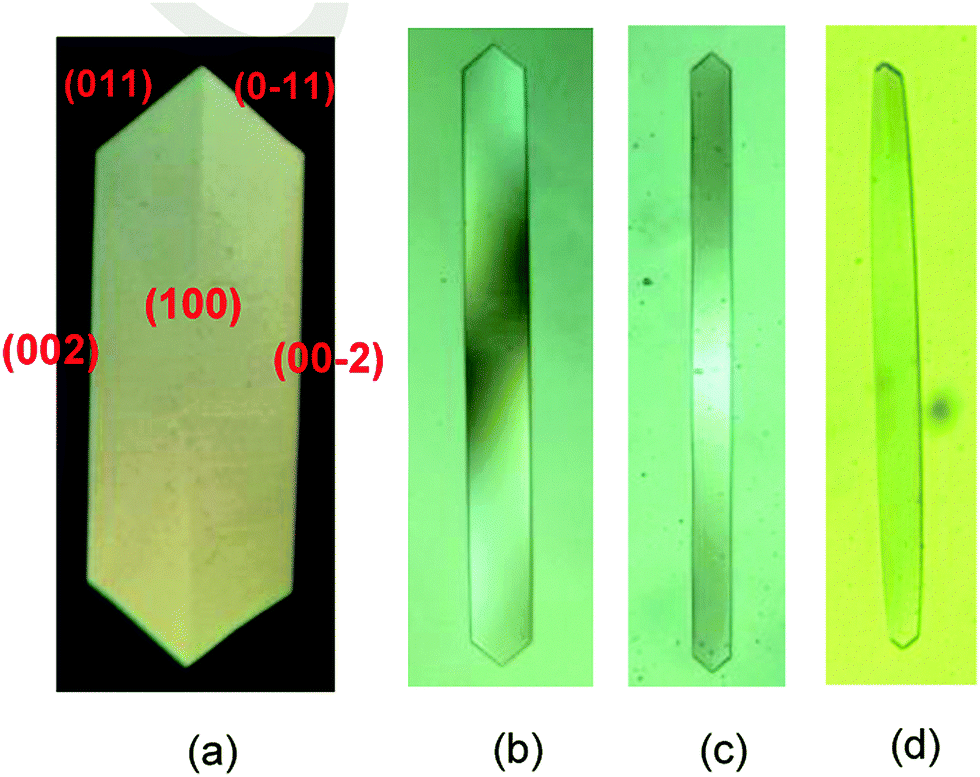 | ||
| Fig. 1 Typical crystal morphologies of RS-ibuprofen crystallised from (a) EtOH; (b) EtOAc; (c) ACN and (d) Tol from Nguyen et al.1 | ||
A previous study elucidated the anisotropic surface chemistry of the major faces of RS-ibuprofen,26 identifying that the growth along the long axis of the needle ({011} surfaces) were found to be dominated by H-bonding interactions, whilst the growth of the side {001} faces was found to be dominated by dispersive interactions. The {100} form was predicted to have very weak interactions and hence to grow very slowly. A recent publication has suggested that in solution there may be a switch of the dominant flat face from the {100} to the {001} due to stronger solvent adsorption at that face.47 However, we feel that the general similar shape of the crystals observed is consistent with the {100} remaining the dominant top face in all solvents tested.
3.1. Optimisation of slice termination and grid position
Fig. 2 shows a comparison of a search of the RS-ibuprofen {011} surface with an EtOH probe, performed with the default grid parameters ((a) and (b)) and performed with the optimised grid parameters ((c) and (d)). | ||
| Fig. 2 (a) Grid search of the most stable slice termination of the (011) surface of RS-ibuprofen with an EtOH probe using the default parameters looking down the 〈100〉 direction; (b) grid search of the most stable slice termination of the (011) surface of RS-ibuprofen with an EtOH probe using the default parameters looking down the 〈011〉 direction; (c) grid search of the most stable slice termination of the (011) surface of RS-ibuprofen with an EtOH probe using the optimised parameters looking down the 〈100〉 direction; (d) grid search of the most stable slice termination of the (011) surface of RS-ibuprofen with an EtOH probe using the optimised parameters looking down the 〈011〉 direction. | ||
Fig. 2(a) and (b) has coloured cubes on the grid row that is closest to the surface, which implies that some strong interactions could have been missed that are even closer to the surface. Hence, using the optimised parameters shown in Fig. 2(b) and (c), there are no coloured cubes in top or bottom rows of the grid, which suggests that all of the possible strong interactions between the probe and the surface have been identified. This process was repeated for all of the crystal surfaces and the probes investigated.
3.2. Strength of probe interaction with crystal surfaces
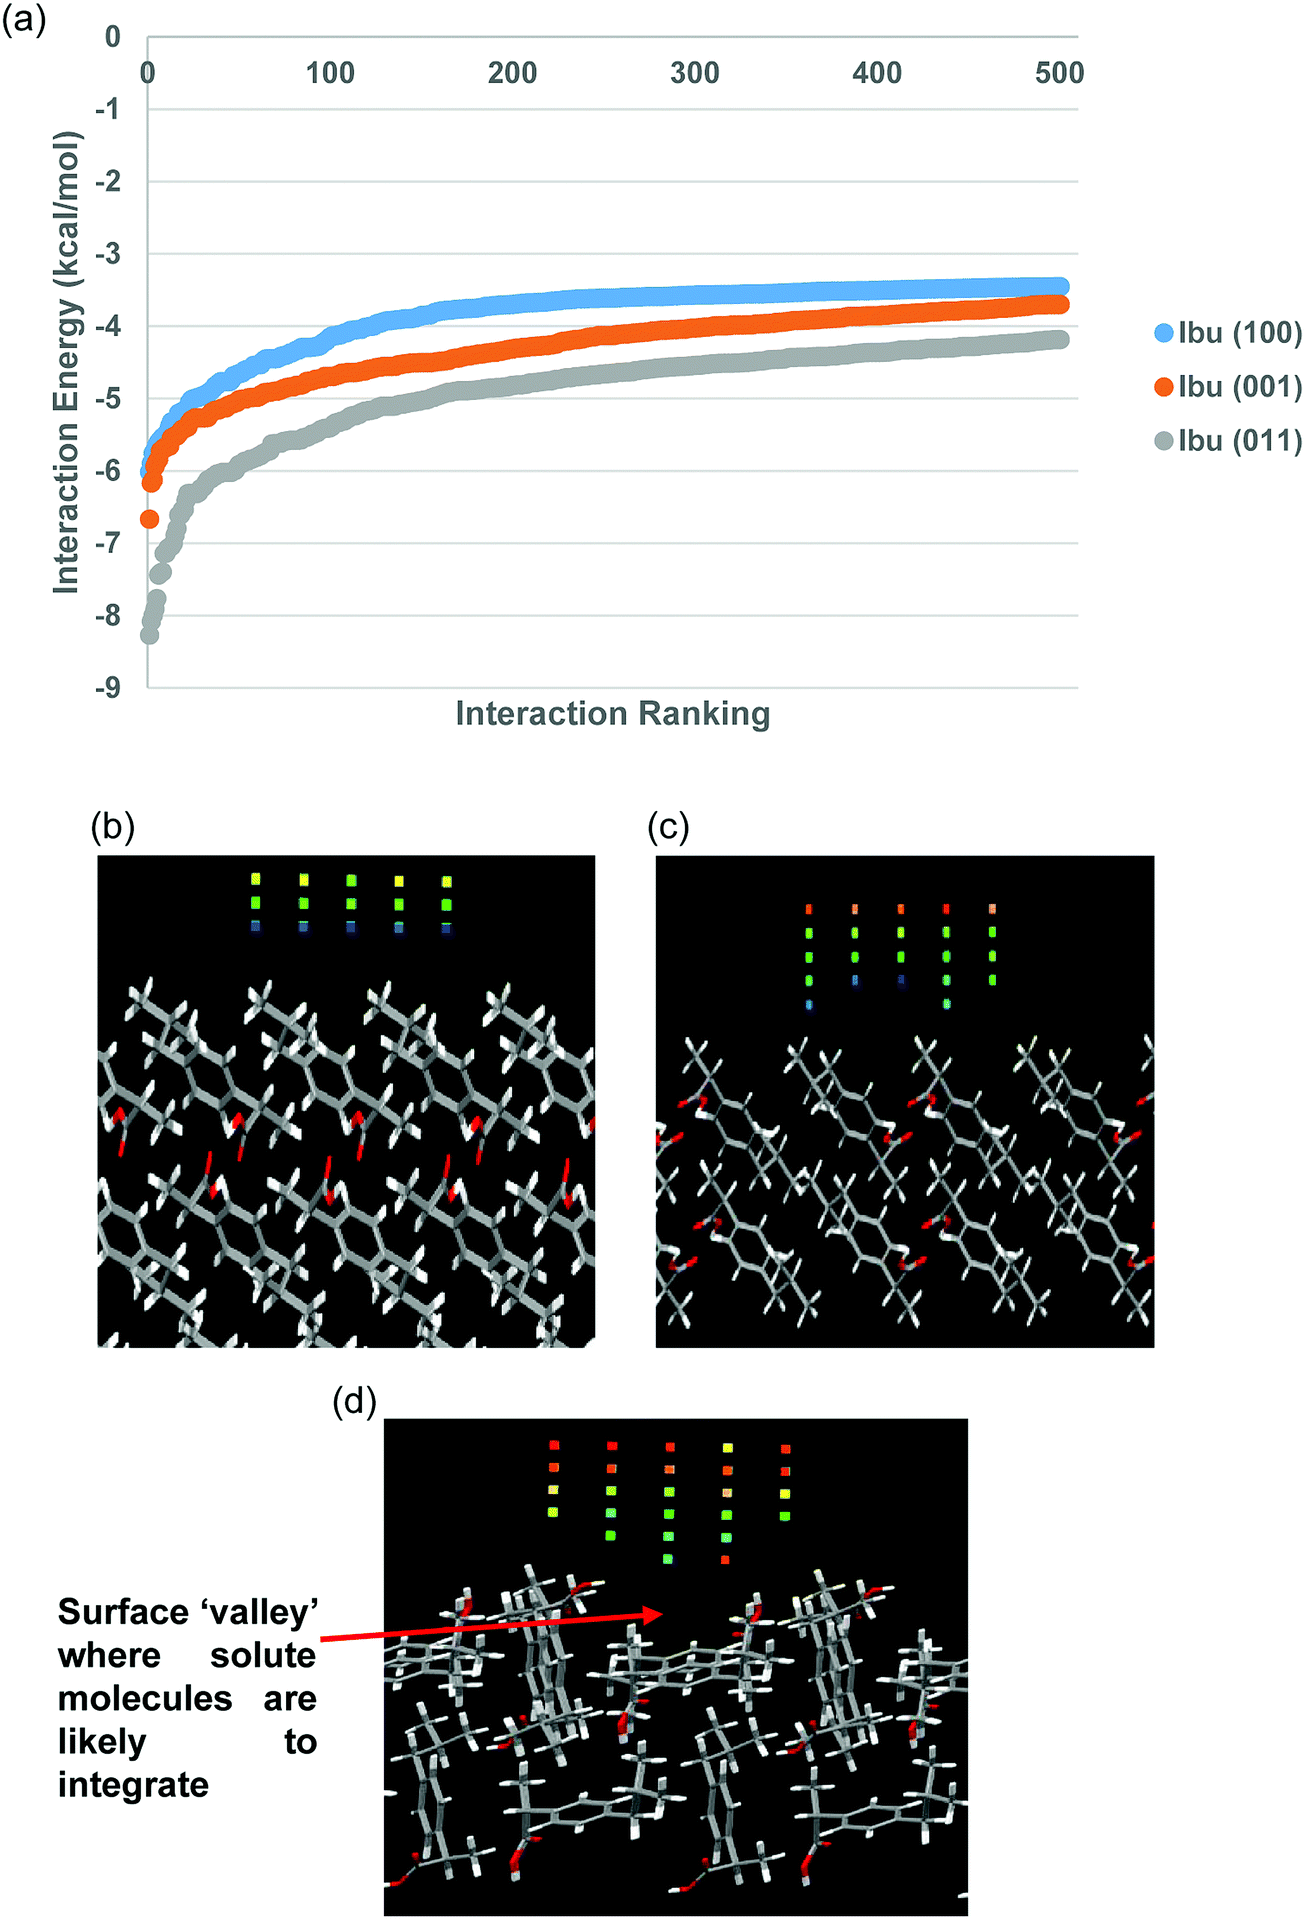 | ||
| Fig. 3 (a) Top 500 interactions found from the SystSearch of the {100}, {001} and {011} surfaces with an ibuprofen molecule as the probe. Grid of coloured cubes indicating the points on the grid where the interactions were found to pass the −2 kcal mol−1 energy cut off are shown for (b) the {100} form; (c) the {001} form and (d) the {011} form. | ||
Fig. 3(a) shows that all three curves displayed a similar general shape, with a sharp upturn of interaction strength at the top end of the curve (furthest left) before flattening out as the interactions become weaker. The curves begin to converge to more similar energies as the interaction energies become lower, suggesting that it is non-specific interaction types being found for the lower energy interactions with the crystal surfaces.
The general trend of the three lines correlates approximately to the growth rates of the three forms, where the {011} surfaces were found to have the strongest interaction energies, whilst the {100} surfaces were found to have the weakest interaction energies. The difference in energy between the curves is greatest at the highest energy ranges (furthest left), with the {011} form in particular showing a greater amount of high energy sites. These high energy interaction sites probably play a strong role in drawing molecules from the solution to the crystal surface, where they can integrate, causing the surface to grow.
Fig. 3(b) and (c) show that the {100} and {001} surfaces are predicted to be relatively smooth on the molecular level, in comparison to the {011} form (Fig. 3(d)) which shows a considerably higher level of rugosity at the molecular scale. The {100} surfaces showed the least amount of high energy cubes, followed by the {001} and then the {011} surfaces were found to have the highest amount of high energy cubes. Many of the higher interaction energy sites for the {011} surfaces were found in the surface ‘valley’, marked with the red arrow on Fig. 3(d), suggesting that this could be a likely surface docking site for incoming solute molecules.
Considering a simple Kossel crystal model, the molecular smoothness of the {100} and {001} surfaces indicates that a solute molecule encountering these surfaces would be able to only form intermolecular interactions in one dimension, similar to the ‘F’ faces from the Hartmann-Perdok model.20 This would suggest that the dynamic equilibrium between a solute molecule that is in contact with the surface and solution would need a high driving force to make it favoured for the molecule to stay in contact with the surface, since it is likely to be loosely bound. In contrast, the surface ‘valley’ found on the {011} surfaces could be thought of as similar to the ‘S’ faces from the Hartman-Perdok model, would allow a solute molecule encountering this surface to form intermolecular forces in two dimensions, shifting the equilibrium towards the solute remaining in contact with the surface, rather than moving back into the bulk solution. This surface rugosity is likely to have a significant effect on the crystal growth rates from solution.
The degree of re-orientation that a molecule must undergo in the surface integration step is likely to influence how quickly that a surface grows. If the time taken for re-orientation is significantly greater than the time taken for solute molecules to diffuse to the surface, the solute molecules already at the surface could hinder the integration of further solute molecules, hence hindering growth of the surface in a so-called ‘self-poisoning’ effect.48,49 The orientation of the solute molecules from the strongest interaction found from the SystSearch for the {100}, {001} and {011} forms is shown in Fig. 4.
 | ||
| Fig. 4 Molecular orientation of the strongest interactions found from the SystSearch of an ibuprofen solute molecule at the (a) {100} surfaces; (b) {001} surfaces and (c) {011} surfaces. | ||
Fig. 4(a) and (b) show that the most favoured orientations found at the {100} and {001} surfaces were not found to be in orientations that would be thought to be labile for the continuation of the crystalline lattice. Fig. 4(c) shows that the COOH group of the solute is interacting with the COOH group exposed at the surface of the {011} form, which could be seen as the first step in becoming fully integrated into the crystalline lattice. These results would suggest that the higher re-orientation energy of the solute for the {100} and {001} surfaces would result in these forms being more likely to be self-poisoned and the solute re-orientation energy barrier to impede crystal growth.
 | ||
| Fig. 5 Top 500 interactions at the {100}, {001} and {011} forms of ibuprofen for (a) EtOH; (b) Tol; (c) EtOAc and (d) ACN. | ||
Fig. 5 indicates that the SystSearch calculates that all the solvents wet the {100} face much less than the {011} and {001} surfaces. The three more polar solvents (EtOH, EtOAc and ACN) all interact more strongly with the {011} surfaces than the {001} surfaces. In comparison, the essentially apolar solvent Tol was found to have quite similar interaction energies with both the {001} and {011} surface, however it interacts slightly more strongly with the {001} surfaces. For all four solvents, the weaker the interaction strength the more the curves for the {001} and {011} surfaces converge, again suggesting that the difference in the wetting of the different surfaces by a particular solvent is captured in the strongest interactions found from the SystSearch.
3.3. Nature of interactions with the crystal surfaces
 | ||
| Fig. 6 % contribution from dispersive (blue), H-bonds (orange) and coulombic to the top 500 interactions of an ibuprofen probe with the ibuprofen (a) {001} form and (b) {011} form. | ||
Fig. 6(a) shows that the dispersive contribution dominates the top 500 interactions of ibuprofen with the {001} form, with the H-bonding and coulombic contributions being close to zero. In contrast, the H-bonding contribution to the interactions of ibuprofen with the {011} form is much more significant. This is consistent with the previous studies that suggested that the growth of the {011} form is dominated by H-bonds, whilst the growth of the {001} form is dominated by dispersive interactions.26
Fig. 7 shows that the hydrogen bonding solvents EtOH, ACN and EtOAc had a significant H-bonding contribution to the interactions with the {011} surfaces, whereas the same solvents interactions with the {001} surfaces had little or no H-bonding contribution. The interactions of Tol with all surfaces was found to be dominated by dispersive forces, due to the lack of polar atoms in toluene.
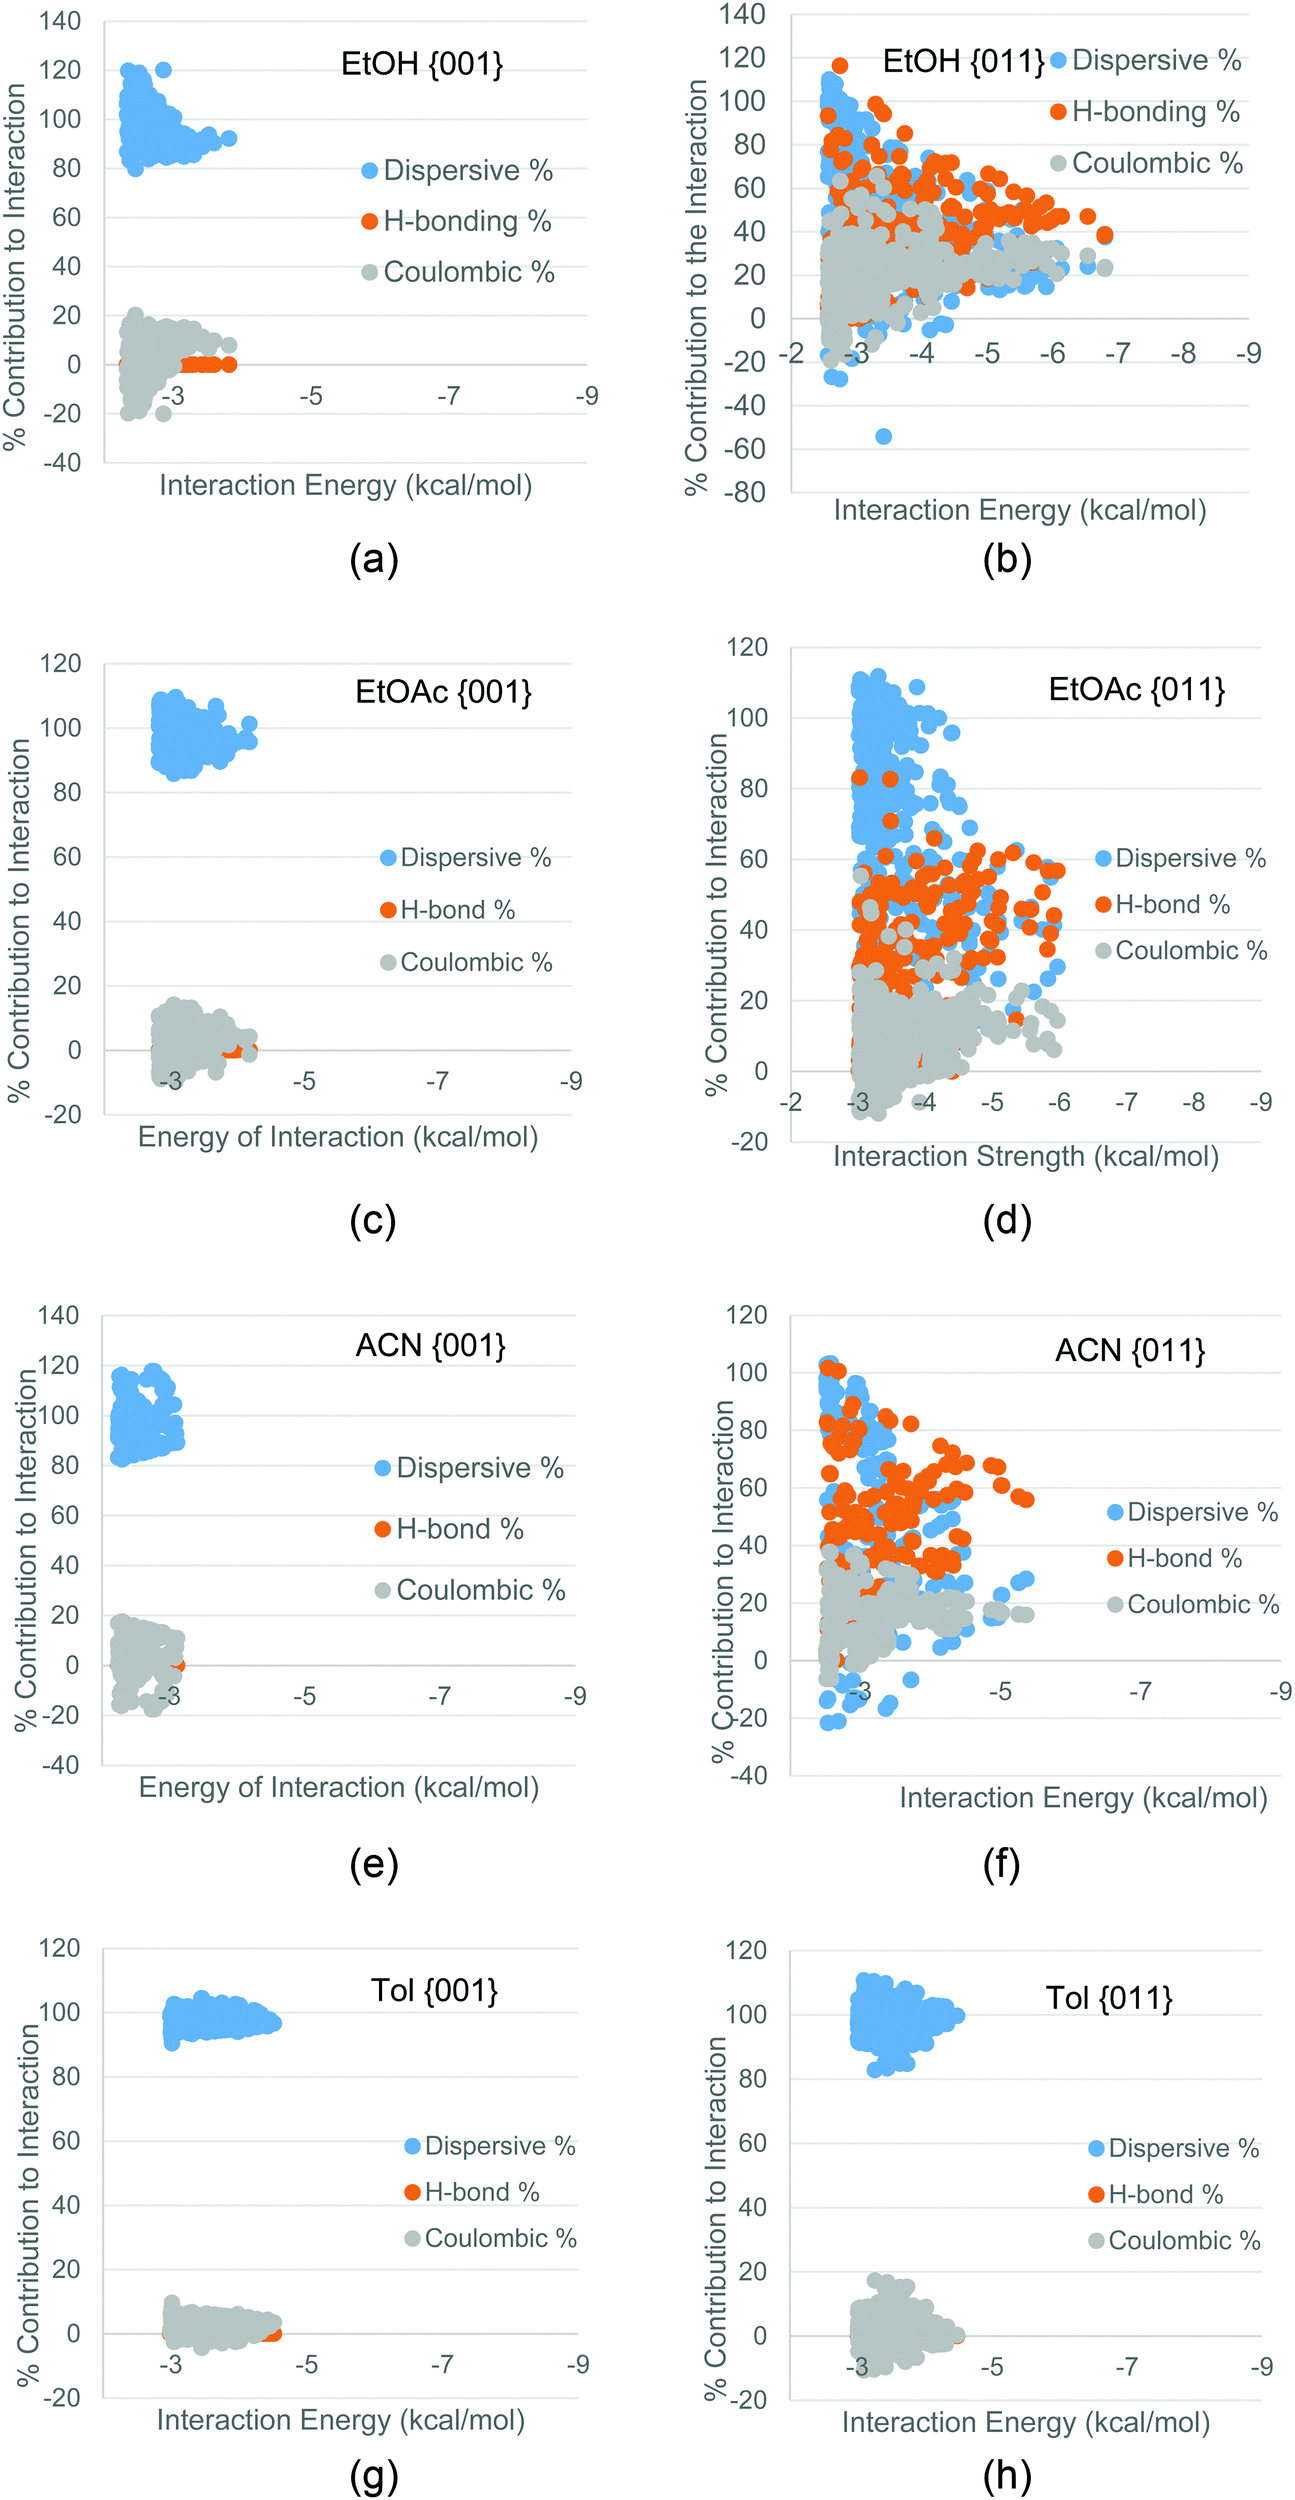 | ||
| Fig. 7 Dispersive, H-bonding and coulombic contributions to the interaction of (a) EtOH with the {001} surface; (b) EtOH with the {011} surface; (c) EtOAc with the {001} surface; (d) EtOAc with the {011}; (e) ACN with the {001} surface; (f) ACN with the {011} surface; (g) toluene with the {001} surface; (h) toluene with the {011} surface. | ||
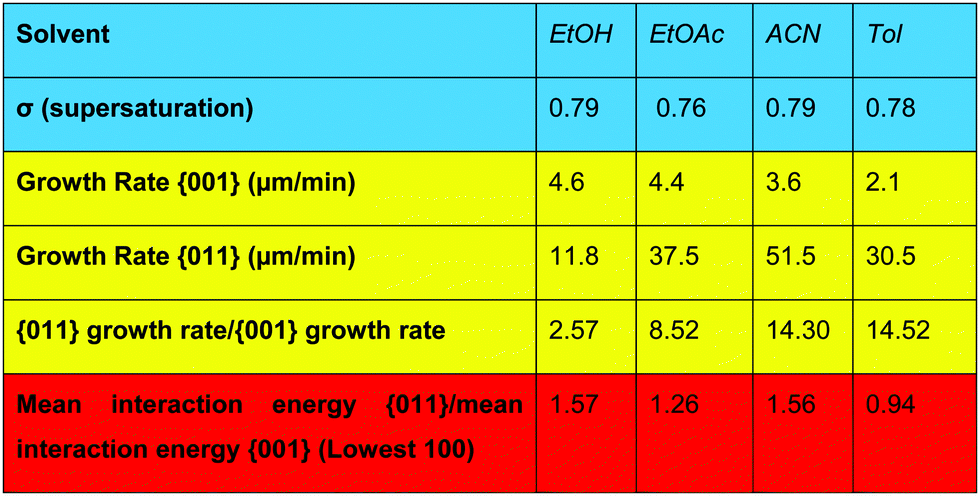
The energetics and the nature of the interactions calculated for both the solute and the solvents suggest that EtOAc and EtOH would be most likely to inhibit the growth of the capping {011} surfaces, whilst Tol would be least likely to inhibit the growth of the fast growing {011} surfaces and may even inhibit the growth rate of the side {001} surfaces. A previous study by Nguyen et al.1 measured the growth rates of these two faces as a function of supersaturation, and Table 1 shows a comparison of the growth rates of these two faces in these three solvents at comparable supersaturations (σ).
|
Table 1 shows that the ratio of the growth rates of the {011} and {001} surfaces increases from EtOH to Tol, and that the higher this value the more needle-like the crystal morphology is. Since Section 3.2 suggested that it was the strongest interactions with each surface that showed the biggest differences in interaction energies between the surfaces, the average value of the top 100 interaction energies from the SystSearch was calculated and found to have a general inverse relationship with the ratio of the growth rate of the {011}/{001} forms, with ACN being the outlier.
Looking at the growth rates in more detail, the lower value of the ratio of the growth rate of the {011} form/{001} form, compared to the other solvents, is caused by the significantly reduced growth rate of the {011} form, combined with a mild increase in the growth rate of the {001} form. Table 1 shows that the ratio between the calculated interaction of EtOH with the {011}/{001} is highest, resultant from strong interactions with the {011} form and much weaker interactions being found with the {001} form. As a caveat to this Table 1 also shows that the growth rate of the {011} form in EtOH was found to be the lowest in comparison to the other solvents, whilst the growth rate of the {001} form was found to be the highest. Table 2 shows that the EtOH interactions with the {011} form were approximately 70% dominated by polar H-bond or coulombic interactions, whilst the interactions of EtOH with the {001} surface had the lowest dispersive contribution, albeit these interactions were found to be over 90% dispersive dominated. Section 3.2 identified that the growth of the {011} form is dominated by polar interactions, whilst the growth of the {001} form is dominated by apolar interactions, hence the nature of the interactions of EtOH with these two forms appears to be reflected in the relative growth rates of the two forms, whereby EtOH can block the formation of polar solute–solute interactions at the {011} surface but fails to block the formation of apolar solute–solute interactions at the {001} surface.

|
In comparison, Tol tends to form the most needle-like morphology of RS-ibuprofen. Here, Tol was the only solvent studied calculated to have a stronger interaction with the {001} surfaces in comparison to the {011} surfaces, albeit the energies are close in value. The high value of the ratio of the growth rate of the {011} form/{001} form is mostly caused by the low growth rate of the {001} form than the fast growth rate of the {011} form, since the growth rate of the (011) face is less in Tol than in ACN and EtOAc. Table 2 shows that none of the solvents can form strong polar interactions with the side faces, therefore with Tol being dominated by dispersive interactions it appears that it behaves somewhat the opposite of EtOH by blocking the formation of the dispersive solute–solute interactions at the {001} surface and failing to block the formation of the H-bonding and coulombic solute–solute interactions at the {011} surface.
ACN does not follow the trend, such that it was calculated to interact strongly with the capping face but very weakly with the side face, and as such would be expected to give a less needle-like morphology that is closer to what is observed from ethanolic solutions. Comparing ACN to EtOH, it can be observed that ACN can only act as a H-bonding acceptor, whilst EtOH can act as both a H-bonding acceptor and donor, hence EtOH could be expected to have a greater propensity to wet the {011} form than ACN. Building upon this, ACN being a very small molecule could mean that it is likely to have a higher molecular mobility than EtOH or EtOAc, resulting it ACN being very labile at the crystal surfaces and therefore de-solvating more quickly at the surfaces. Future studies of the dynamic behaviour of these solvents at the crystal surfaces and in the bulk solution of RS-ibuprofen could uncover some of intimate details of wetting and de-solvation.
4. Conclusions
The grid-based molecular modelling calculations of the solute and solvent interactions with the {001} and {011} forms of RS-ibuprofen have been used to rationalise the crystal morphologies of RS-ibuprofen from EtOH, ACN, EtOAc and Tol, by analysing the strength and nature of these interactions, along with the surface rugosities.This study suggests that the often observed needling of the ibuprofen crystals along the b-axis is due to the strong H-bonding interactions that the solute can form with the {011} surfaces, along with the surface ‘valleys’ acting as an energetically favourable docking site, whilst the {100} and {001} surfaces are smoother on the molecular level and consequently show weaker dispersive interactions with the solute molecule.
Analysis of the strongest interactions of the probe molecules with the crystal surfaces revealed that a strong interaction of EtOH with the {011} surfaces and much weaker interaction with the {001} surfaces, results in a lower growth rate of the {011} surfaces and higher growth rate of the {001}, compared to the other solvents. This trend is followed for EtOAc and Tol, as the ratio of the growth rate of the {011}/{001} increases, the ratio of the interaction energy of the {011}/{001} falls for these solvents. Indeed, the significant H-bonding interactions formed by EtOH with the {011} face probably inhibits the interaction of the strong H-bonding with the solute molecule that governs the growth rate of this form. Similarly, the strong dispersive interactions formed by Tol with the {001} surfaces probably inhibits the dispersive interactions formed by the solute molecule with this surface, hence the {001} form was observed to grow slowest in Tol.
This study reveals how the surface rugosity, along with the solute/surface and solvent/surface interaction strength and nature can influence the individual crystal surface growth rates of RS-ibuprofen, and hence the degree of needle-like morphology produced from solution. These calculations can provide a guide for solvent selection for crystallisation when the product crystal morphology is important for downstream processing.
List of symbols
| Δ(H)Tdiss | Molar enthalpy associated with the making and breaking of intermolecular forces |
| Φ δf i | Energy of solid–fluid interactions |
| Φ ff i | Energy of fluid–fluid interactions |
| Φ δδ i | Energy of solid–solid interactions |
| E int | Energy of interaction between the probe molecule and crystalline slab |
List of terms
| Intrinsic synthons | Intermolecular interactions fully satisfied within the bulk of the crystal structure |
| Extrinsic synthons | Intermolecular interactions which are broken upon termination of a crystal surface |
Conflicts of interest
There are no conflicts to declare.Acknowledgements
The authors would like to acknowledge the financial support from the EPSRC Follow-On fund grant ‘HABIT – Crystal morphology from crystallographic and growth environment factors’, EP/I028293/1, the Pfizer supported Synthonic Engineering and the Pfizer, Boeringer-Ingellheim, Novartis, and Syngenta supported Synthonic Engineering 2 grants for the development of the VisualHabit and Systsearch software. We would like to acknowledge the ongoing collaboration with the Cambridge Crystallographic Data Centre in the development of these software within the CCDC framework. We also gratefully acknowledge the support of the Advanced Manufacturing Supply Chain Initiative through the funding of the ‘Advanced Digital Design of Pharmaceutical Therapeutics’ (Grant No. 14060) project in terms of supporting pharmaceutical manufacturing and modelling research. One of us (B. E.) would like to acknowledge the EPSRC Centre for Doctoral Training in Complex Particulate Products & Processes (Grant no. EP/L015285/01) for the support of a PhD studentship. We would like to acknowledge Vasuki Ramachandran, Thai Thu Hien Nguyen and Majeed Soufian for their efforts in the development of the SystSearch techniques and work on ibuprofen modelling and crystallisation.References
- T. T. H. Nguyen, R. B. Hammond, K. J. Roberts, I. Marziano and G. Nichols, CrystEngComm, 2014, 16, 4568–4586 RSC
.
- D. Winn and M. F. Doherty, AIChE J., 1998, 44, 2501–2514 CrossRef CAS
- D. Winn and M. F. Doherty, AIChE J., 2000, 46, 1348–1367 CrossRef CAS
- R. A. Sullivan and R. J. Davey, CrystEngComm, 2015, 17, 1015–1023 RSC
- I. Rosbottom, C. Y. Ma, T. D. Turner, R. A. O’Connell, J. Loughrey, G. Sadiq, R. J. Davey and K. J. Roberts, Cryst. Growth Des., 2017, 17, 4151–4161 CAS
- C. S. MacLeod and F. L. Muller, Org. Process Res. Dev., 2012, 16, 425–434 CrossRef CAS
- P. Bennema and J. P. van der Eerden, J. Cryst. Grow., 1977, 42, 201–213 CrossRef CAS
- K. J. Roberts, R. Docherty, P. Bennema and L. Jetten, J. Phys. D: Appl. Phys., 1993, 26, B7–B21 CrossRef CAS
-
P. Bennema and J. P. van der Eerden, in Morphology of Crystals, ed. I. Sunagawa, 1987 Search PubMed
-
K. J. Roberts, R. B. Hammond, V. Ramachandran and R. Docherty, in Computational Approaches in Pharmaceutical Solid State Chemistry, ed. Y. A. Abramov, Wiley, New Jersey, USA, 2016 Search PubMed
- Z. Berkovitch-Yellin, J. Van Mil, L. Addadi, M. Idelson, M. Lahav and L. Leiserowitz, J. Am. Chem. Soc., 1985, 107, 3111–3122 CrossRef CAS
- R. Docherty and K. J. Roberts, J. Cryst. Growth, 1988, 88, 159–168 CrossRef CAS
- G. Clydesdale, R. Docherty and K. J. Roberts, Comput. Phys. Commun., 1991, 64, 311–328 CrossRef CAS
- R. Docherty, G. Clydesdale, K. J. Roberts and P. Bennema, J. Phys. D: Appl. Phys., 1991, 24, 89–99 CrossRef CAS
- F. A. Momany, L. M. Carruthers, R. F. McGuire and H. A. Scheraga, J. Phys. Chem., 1974, 78, 1595–1620 CrossRef CAS
- S. L. Mayo, B. D. Olafson and W. A. Goddard, J. Phys. Chem., 1990, 94, 8897–8909 CrossRef CAS
- P. Hartman and P. Bennema, J. Cryst. Growth, 1980, 49, 145–156 CrossRef CAS
- G. Clydesdale, K. J. Roberts and R. Docherty, J. Cryst. Growth, 1994, 135, 331–340 CrossRef CAS
- I. Rosbottom, K. J. Roberts and R. Docherty, CrystEngComm, 2015, 17, 5768–5788 RSC
- P. Hartman and W. G. Perdok, Acta Crystallogr., 1955, 8, 49–52 CrossRef
- Z. Berkovitch-Yellin, J. Am. Chem. Soc., 1985, 107, 8239–8253 CrossRef CAS
- D. Toroz, I. Rosbottom, T. D. Turner, D. M. C. Corzo, R. B. Hammond, X. Lai and K. J. Roberts, Faraday Discuss., 2015, 179, 79–114 RSC
- D. M. Camacho, K. J. Roberts, F. Muller, D. Thomas, I. More and K. Lewtas, Cryst. Growth Des., 2017, 17, 563–575 CAS
- G. P. Hastie, J. Johnstone, E. M. Walker and K. J. Roberts, J. Chem. Soc., Perkin Trans. 2, 1996, 2049–2050, 10.1039/p29960002049,
- A. A. Moldovan, I. Rosbottom, V. Ramachandran, C.
M. Pask, O. Olomukhoro and K. J. Roberts, J. Pharm. Sci., 2017, 106, 882–891 CrossRef CAS PubMed
- T. T. H. Nguyen, I. Rosbottom, I. Marziano, R. B. Hammond and K. J. Roberts, Cryst. Growth Des., 2017, 17, 3088–3099 CAS
-
I. Rosbottom and K. J. Roberts, in Engineering Crystallography: From Molecule toCrystal to Functional Form, ed. K. J. Roberts, R. Docherty and R. Tamura, Springer, Netherlands, Dordrecht, 2017, pp. 109–131 DOI:10.1007/978-94-024-1117-1_7
- R. B. Hammond, K. Pencheva and K. J. Roberts, Cryst. Growth Des., 2006, 6, 1324–1334 CAS
- R. B. Hammond, K. Pencheva, V. Ramachandran and K. J. Roberts, Cryst. Growth Des., 2007, 7, 1571–1574 CAS
- J. Chen and B. L. Trout, Cryst. Growth Des., 2010, 10, 4379–4388 CAS
- E. M. Walker, K. J. Roberts and S. J. Maginn, Langmuir, 1998, 14, 5620–5630 CrossRef CAS
- Z. Z. Liang, J. F. Chen, Y. Ma, W. Wang, X. L. Han, C. Y. Xue and H. Zhao, CrystEngComm, 2014, 16, 5997–6002 RSC
- J. Li, C. J. Tilbury, M. N. Joswiak, B. Peters and M. F. Doherty, Cryst. Growth Des., 2016, 16, 3313–3322 CAS
- M. A. Lovette and M. F. Doherty, Cryst. Growth Des., 2013, 13, 3341–3352 CAS
- C. J. Tilbury, D. A. Green, W. J. Marshall and M. F. Doherty, Cryst. Growth Des., 2016, 16, 2590–2604 CAS
- R. B. Hammond, C. Ma, K. J. Roberts, P. Y. Ghi and R. K. Harris, J. Phys. Chem. B, 2003, 107, 11820–11826 CrossRef CAS
- G. Clydesdale, R. B. Hammond and K. J. Roberts, J. Phys. Chem. B, 2003, 107, 4826–4833 CrossRef CAS
- P. Mougin, G. Clydesdale, R. B. Hammond and K. J. Roberts, J. Phys. Chem. B, 2003, 107, 13262–13272 CrossRef CAS
- V. Ramachandran, D. Murnane, R. B. Hammond, J. Pickering, K. J. Roberts, M. Soufian, B. Forbes, S. Jaffari, G. P. Martin, E. Collins and K. Pencheva, Mol. Pharmaceutics, 2014, 12, 18–33 CrossRef PubMed
- P. McArdle, Y. Hu, A. Lyons and R. Dark, CrystEngComm, 2010, 12, 3119–3125 RSC
- N. Walshe, M. Crushell, J. Karpinska, A. Erxleben and P. McArdle, Cryst. Growth Des., 2015, 15, 3235–3248 CAS
- J. Bunyan, N. Shankland and D. Sheen, Solvent effects on the morphology of ibuprofen, AIChE Symposium Series, 1991, pp. 44–54 Search PubMed.
-
C. Giacovazzo, H. L. Monaco, G. Artioli, D. Viterbo, M. Milanesio, G. Gilli, P. Gilli, G. Zanotti, G. Ferraris and M. Catti, Fundamentals of Crystallography: 15 (International Union of Crystallography Texts on Crystallography), Oxford University Press, Oxford, UK, 3rd edn, 2011 Search PubMed
-
J. Pickering, R. B. Hammond, V. Ramachandran, M. Soufian and K. J. Roberts, in Engineering Crystallography: From Molecule toCrystal to Functional Form, ed. K. J. Roberts, R. Docherty and R. Tamura, Springer Netherlands, Dordrecht, 2017, pp. 155–176 DOI:10.1007/978-94-024-1117-1_10
- J. Gasteiger and M. Marsili, Tetrahedron, 1980, 36, 3219–3228 CrossRef CAS
- J. Gasteiger and M. Marsili, Tetrahedron Lett., 1978, 3181–3184 CrossRef CAS
- M. Zhang, Z. Liang, F. Wu, J.-F. Chen, C. Xue and H. Zhao, J. Cryst. Grow., 2017, 467, 47–53 CrossRef CAS
-
G. Ungar, E. G. R. Putra, D. S. M. de Silva, M. A. Shcherbina and A. J. Waddon, in Interphases and Mesophases in Polymer Crystallization I, ed. G. Allegra, Springer-Verlag Berlin, Berlin, 2005, vol. 180, pp. 45–87 Search PubMed
- I. Weissbuch, L. Leiserowitz and M. Lahav, Cryst. Growth Des., 2006, 6, 625–628 CAS
| This journal is © the Owner Societies 2018 |