
 Open Access Article
 This Open Access Article is licensed under a
 Creative Commons Attribution 3.0 Unported Licence
Osmotic contribution to the flow-driven tube formation of copper–phosphate and copper–silicate chemical gardens
Evelin
Rauscher
a,
Gábor
Schuszter
 a,
Bíborka
Bohner
a,
Ágota
Tóth
a and
Dezső
Horváth
*b
a,
Bíborka
Bohner
a,
Ágota
Tóth
a and
Dezső
Horváth
*b
aDepartment of Physical Chemistry and Materials Science, University of Szeged, Rerrich Béla tér 1., Szeged, H-6720, Hungary. E-mail: atoth@chem.u-szeged.hu; Fax: +36-62-546-482; Tel: +36-62-544-614
bDepartment of Applied and Environmental Chemistry, University of Szeged, Rerrich Béla tér 1., Szeged, H-6720, Hungary
First published on 23rd January 2018
Abstract
We have produced hollow copper-containing precipitate tubes using a flow-injection technique, and characterized their linear and volume growth. It is shown that the ratio of the volume increase rate to that of pumping is constant independent of the chemical composition. It is also found that osmosis significantly contributes to the tube growth, since the inward flux of chemical species dominates during the precipitate pattern formation. The asymmetric hydrodynamic field coupled with the inherent concentration and pH gradients results in different particle morphology on the two sides of the precipitate membrane. While the tubes have a smooth outer surface, the inner walls are covered with nanoflowers for copper phosphate and with nanoballs for copper silicate.
1 Introduction
Delicate structures in nature arise from elementary reactions in an imposing way. In a simple system where transition metal salt crystals are placed in sodium silicate solution, complex precipitate structures in the form of colourful plant-like objects grow.1 Despite their simplicity, chemical gardens are the results of an intricate interplay between transport processes and precipitation. Such self-assembling systems have been the focus of numerous studies lately that emphasize the importance of transport processes due to gradients in concentration, pH, and pressure. Hydrodynamics is considered to play a key role in the tube growth due to the presence of osmotic and buoyant forces,2,3 however, the relative contribution of such effects is not yet known.In the tube growth experiments performed in the traditional way (i.e. singular salt crystal placed in the appropriate solution), multiple, irregular hollow tubes evolve.4,5 Therefore, the resource and thus the driving force are consumed at a greater rate hindering the growth of long tubes.6 For better reproducibility, a flow-injection technique has been introduced, in which metal salt crystals are replaced with their solutions. Steinbock and co-workers have shown that below a threshold concentration, hydrodynamic plumes form in the iron(II)–sulfide system, which at higher concentrations turn into hollow tubes with distinct length and diameter.7 Concerning the dynamics of tube formation, three growth regimes have been distinguished within the oscillatory tube growth mechanism: popping, jetting, and budding.8 To achieve a better control of the tube growth, the flow-injection technique has been coupled with buoyancy-driven bubble-guidance. Such a method results in the formation of hollow, strictly regulated, straight precipitate tubes.9–12 Consequently, several decimeter long tubes with a quasi constant radius can be achieved in a reproducible way.
Since those precipitate tubes develop in a 3D fashion, their interior part cannot be investigated during the formation. Therefore, as an alternative, some growth experiments have been performed in horizontal confined geometries allowing the follow up of both the interior and exterior surfaces of the evolving membranes.13 Additionally, a zoo of different patterns, like spirals, flowers, worms, and filaments, has been found when any of the following pairs of reactants were used: cations of calcium, cobalt, copper, and nickel with silicate or carbonate anions. In the similar calcium–carbonate system, the existence of a critical concentration of reactants has been shown, above which the amount of precipitate drops due to membrane formation.14,15 Even more insight was achieved when straight membranes were produced and investigated in real time in microfluidic channels eliminating the buoyancy-driven mixing of the injected solutions.16
Besides the complex hydrodynamics of the tube growth systems, precipitation performed under far-from-equilibrium conditions shows promising possibilities. For example, precipitate growth out of a seed can lead to the formation of biomorphs in a solution with a mixture of carbonate and silicate ions in the presence of barium ions.17 It was also shown that either polymorph or crystallite type selection may be achieved by applying a simple flow-injection technique even without the usage of any additives, which draws the attention of materials science.18–20 Furthermore, the selection of appropriate conditions (type of reactants, concentration, flow rate, etc.) can result in self-sustainable precipitate tubes that are stable against time even after drying. This gives the opportunity for producing composite tubes with ingredients being, e.g., catalytically relevant. In addition, the intrinsic far-from-equilibrium synthesis conditions may result in such membrane structures that are not available otherwise. Overall, small-scaled self-assembled reactors with tailored gradient composition can be produced and engineered if the mechanism of the growth is understood.
In this context, throughout our previous studies applying the flow-injection technique, we have developed complex precipitate patterns growing vertically or horizontally in the copper–phosphate system.21 In this work, we focus on the regime where hollow precipitate tubes form and quantitatively describe their growing properties emphasizing the role of osmosis. The microstructure of the synthesized copper phosphate is also characterized and compared to that of copper silicate produced under similar conditions.
2 Experimental
To perform the injection experiments, a glass reaction vessel with 20 cm long slides and a 5 cm × 5 cm base area is first filled with 250 mL of the appropriate outer electrolyte solution (either sodium phosphate or sodium silicate). Then, the copper sulfate solution was pumped in from below by a peristaltic pump (Gilson) equipped with a Tygon tube (din = 0.13 mm) ending in a needle (din = 0.51 mm). The needle slightly penetrated into the outer electrolyte thus giving a well-defined base point for the tubes to grow. Throughout the different experiments, the reactant concentrations, the outer electrolyte, and the applied volumetric flow rate in the range of 0.4–1.6 mL h−1 were varied. The growth of precipitate tubes was monitored with a digital camera (Canon MV 901) via recording color images. Images with gray scale intensity were collected and tube characteristics such as diameter and length were determined using in-house image processing software. The growing of the light tube against the dark background was monitored by locating the point of inflection in the gray scale along the direction of growth, from which the linear growth rate is determined. (The latter term is taken in a similar fashion to chromatography to clearly distinguish it from the volume growth rate.) Each experiment was repeated four times to ensure good reproducibility. Solid samples were then collected and dried to investigate the microstructure of the inner and outer surfaces of the precipitate tubes by using a scanning electron microscope (Hitachi S4700, operating at 8–13 kV accelerating voltage).To avoid the presence of any additional ions while adjusting pH, the different protonation states were maintained by using solutions of trisodium phosphate, disodium hydrogen phosphate, and sodium dihydrogen phosphate. Solutions were prepared from analytical grade solid reagents: Na3PO4·12H2O (Molar, Sigma), Na2HPO4·12H2O (Reanal), NaH2PO4·2H2O (Fluka), and CuSO4·5H2O (Sharlau) using deionized water as solvent. Technical-grade sodium silicate, in aqueous solution, was purchased from VWR. All chemicals were used as received.
Since buoyancy obviously plays an important role when chemical garden tubes evolve, the density of each solution was repeatedly measured using an Anton Paar DMA 500 Compact Digital Density Meter with 10−4 g cm−3 precision.
3 Results and discussion
3.1 Copper phosphate tubes
The mechanical properties of the evolving tubes (e.g. stiffness, permeability, surface charges, etc.) vary with the nature of the reactants. Besides the reactant concentrations and the injection rate, pH is a crucial parameter of the tube growth due to the varying protonation state of phosphate ions. In order to adjust acidic or alkaline conditions without introducing further ions to the system, three different sodium phosphate solutions with total phosphate concentration c = 0.3 M were used. In the experiments with constant w = 0.71 mL h−1 flow rate, permeable precipitate tubes form when copper sulfate flows into trisodium phosphate solution with pH = 12.64. If the solution of disodium hydrogen phosphate (pH = 9.08) is used instead, only short tubes grow upwards, while no precipitation is observed when the pH is decreased to 4.19 using sodium dihydrogen phosphate solution. Therefore, all results presented hereafter for phosphate tubes correspond to trisodium phosphate as the outer electrolyte.When copper sulfate solution is pumped into such phosphate solution, three distinct growing types of blue copper phosphate precipitate can be identified depending on the concentrations (and thus the density distribution) of the reactants. According to the constructed phase diagram shown in Fig. 1, only short tubes are produced with low copper and high phosphate concentrations (green squares on the left side of Fig. 1). In this region of the phase diagram, the outer electrolyte has greater density than the injected one, which prompts an enhanced upward flow due to the presence of buoyant forces (see the negative Δρ values in Table 1) that overcome the strength of the membrane. Therefore, despite the constant injection rate, precipitate vesicles form periodically at the tip of the tubes, which then pop off and rise to the surface. This tube growth mechanism is called popping.8
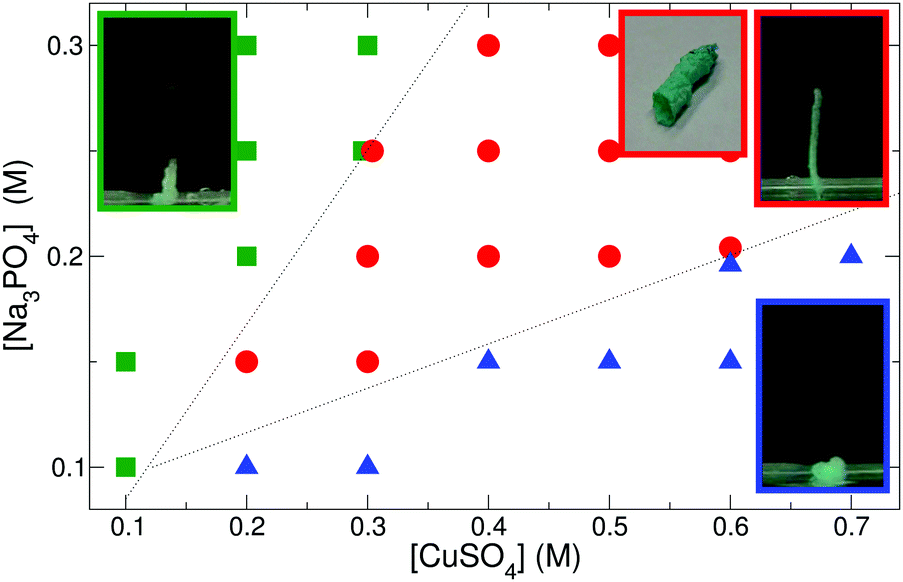 | ||
Fig. 1 Copper phosphate growth regimes with flow rate w = 0.71 mL h−1. The region of tube formation ( ) is bounded by dotted lines to aid the eye. The popping growth regime ( ) is bounded by dotted lines to aid the eye. The popping growth regime ( ) is found above the upper dotted line, while horizontal spreading ( ) is found above the upper dotted line, while horizontal spreading ( ) is located below the lower dotted line. The insets show images of the precipitate structure associated with each region and of a dried hollow tube. ) is located below the lower dotted line. The insets show images of the precipitate structure associated with each region and of a dried hollow tube. | ||
| Δρ (g cm−3) | [CuSO4] (M) | |||||||
|---|---|---|---|---|---|---|---|---|
| Δρ = ρ(CuSO4) − ρ(Na3PO4) | 0.1 | 0.2 | 0.3 | 0.4 | 0.5 | 0.6 | 0.7 | |
| [Na3PO4] (M) | 0.10 | — | −0.025 | −0.0093 | 0.0064 | 0.0225 | 0.0372 | 0.0524 |
| 0.15 | — | −0.015 | 0.0007 | 0.0164 | 0.0325 | 0.0472 | 0.0624 | |
| 0.20 | — | −0.006 | 0.0097 | 0.0254 | 0.0415 | 0.0562 | 0.0714 | |
| 0.25 | −0.0126 | 0.0033 | 0.0190 | 0.0347 | 0.0508 | 0.0655 | — | |
| 0.30 | −0.0036 | 0.0123 | 0.0280 | — | — | — | — | |
In the opposite case, i.e. with low phosphate and increasing copper concentrations (blue triangles in the lower right part of Fig. 1), the inflowing copper sulfate is denser, hence it tends to advance under the phosphate solution. Precipitation follows this fluid flow, therefore the pattern spreads on the bottom of the dish. At these concentrations, acidic copper sulfate is in stoichiometric excess, thus phosphate ions are protonated to a larger extent in the solution. Those ions favor the formation of separate crystals instead of resulting in amorphous membranes.
Wedged between those two regions lays the concentration range (for a given flow rate) where hollow tubes grow at a steady rate (see the red circles in Fig. 1). In this zone, the higher reactant concentration ensures that the evolving membrane is sufficiently strong to sustain the interior pressure arising due to the combination of injection and buoyancy. Therefore, the membrane breaks up only at its tip and a contiguous precipitate tube forms.
While keeping the reactant concentration and pH unchanged, the tube growth can also be affected by varying the rate of inner electrolyte supply. The experimental results presented in Fig. 1 correspond to a fixed injection rate (w = 0.71 mL h−1) applied for 10–15 min. Such a slow flow leads to the development of 5 cm-long tubes, while a greater flow overcomes the mechanical stability of the membrane. As a consequence, they become tilted or even break regularly resulting in only 2–3 cm long, stable tubes. Therefore, the tube length clearly depends on the flow rate as well.
One may expect that the growing speed of the tubes is also a function of the injection rate. However, inspection of the linear growth rate for tubes with constant reactant concentration demonstrates that it is independent of the injection rates for tubes (see Table 2). Hence the linear growth rate is found to be 30.6 ± 1.8 cm h−1 while the injection rate is multiplied more than three times (raised from 0.4 to 1.3 mL h−1). It is worth noting that for precise measurements, in the case of tilted tubes, the data set is always corrected with the appropriate tilt angle. Furthermore, it is crucial to point out that this vertical tube growth occurs at conditions where the inflowing copper solution has greater density than the phosphate one (see the corresponding positive Δρ values in red in Table 1). Buoyancy counteracts the upward growth, therefore an additional contribution to the tube growth mechanism must be active in the precipitate formation. The volume increase rate of a single tube can be defined as the product of linear growth rate and tube cross section. The latter can be obtained from the measured tube diameter assuming a circular geometry. The volume increase rate of the tubular precipitate is found to be proportional to the flow rate for any reactant concentration applied (see Fig. 2). At a given time, the volume of a tube is found to be ca. twice that of the copper sulfate solution pumped in, suggesting that the wall of the freshly formed tube is permeable to the electrolyte and/or water molecules, and hence a significant amount of the outer electrolyte is engulfed by the closure of the membrane. Linear regression on volume increase rate with respect to pumping rate provides an average slope of 1.89 ± 0.05 taking into account all the measurements with the various reactant concentration pairs. This reveals the presence of inward osmotic flow through the wall with membrane-like properties, since in our earlier work we have shown that the region of steady tube growth dominantly falls in the range where the osmotic pressure of copper sulfate solution is greater than that of sodium phosphate.21 With the formation of stiff and rigid walls, tubes would grow with a volume increase rate similar to that of pumping. Therefore, the ratio would be closely equal to one indicating little contribution from other processes taking place in the growth.
| w (mL h−1) | v l (cm h−1) |
|---|---|
| 0.40 | 28.7 ± 0.9 |
| 0.72 | 30.6 ± 1.2 |
| 0.96 | 33.5 ± 0.6 |
| 1.19 | 31.5 ± 2.4 |
| 1.43 | 29.0 ± 2.5 |
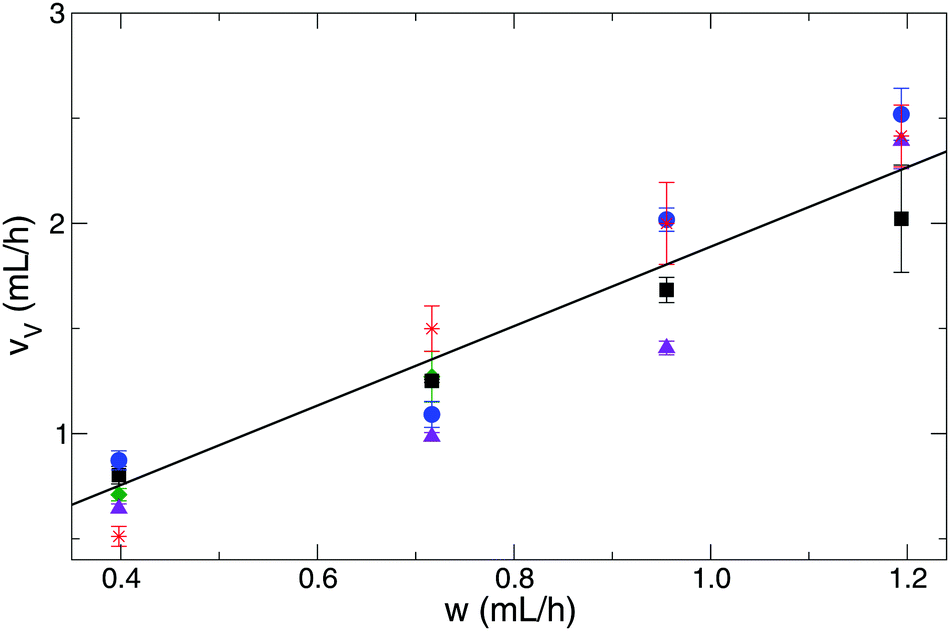 | ||
Fig. 2 Changes in the volume increase rates at various concentrations:  : [PO43−] = 0.15 M, [Cu2+] = 0.20 M, ■: [PO43−] = 0.20 M, [Cu2+] = 0.50 M, : [PO43−] = 0.15 M, [Cu2+] = 0.20 M, ■: [PO43−] = 0.20 M, [Cu2+] = 0.50 M,  : [PO43−] = 0.30 M, [Cu2+] = 0.40 M, : [PO43−] = 0.30 M, [Cu2+] = 0.40 M,  : [PO43−] = 0.30 M, [Cu2+] = 0.50 M, and : [PO43−] = 0.30 M, [Cu2+] = 0.50 M, and  : [PO43−] = 0.20 M, [Cu2+] = 0.40 M. : [PO43−] = 0.20 M, [Cu2+] = 0.40 M. | ||
3.2 Comparison with copper silicate tubes
In order to compare the tube formation of copper phosphate with that of copper silicate, the concentration of sodium silicate solution was set to maintain a similar density difference for a fixed concentration of copper sulfate solution (0.5 M). Under these conditions, the injected copper solution is denser by 0.0173 g cm−3 than the outer electrolyte, which is comparable to the density difference of the corresponding copper–phosphate system (0.0225 g cm−3).The linear growth rate of copper silicate tubes was determined to be vl = 50.4 ± 5.4 cm h−1 and it was found to be independent of the flow rate, similar to that of copper phosphate (vl = 30.6 ± 1.8 cm h−1), although it is greater for silicate. Consequently, phosphate tubes evolve with larger diameter than the silicate ones. However, the volume increase rates are found to be equal within experimental errors for a set pumping speed. The ratios of volume increase rate with respect to that of pumping also match well: 2.0 ± 0.2 and 2.1 ± 0.2 for silicate and phosphate, respectively, for this particular concentration. Since the tube radius is constant, the volume growth rate can be expressed as vV = R2πvl. Taking into account that the volume increase rate is the same for the two systems, we deduce that the linear growth rate is inversely proportional to the square of the tube radius, i.e., vl,Si/vl,P = (RP/RSi)2. Hence, the surface increase rate rA will be inversely proportional to the tube radius as rA,Si/rA,P = RP/RSi = 1.29 ± 0.08. Both phosphate and silicate tubes form semi-permeable membrane walls at their tips that allow osmosis to contribute to the sufficiently slow flow. These relations suggest that the walls of the formed copper phosphate tubes are more porous than those of copper silicate, since the same amount of outer liquid is enclosed in the hollow precipitate structure yet their surface area is smaller.
3.3 Microstructure
By now, it has been proved that flow conditions maintaining spatial gradients of different properties (e.g. pH, concentration, density, etc.) can lead to different product properties compared to those under well-stirred conditions.18–20 Therefore, both phosphate and silicate precipitates obtained in the tube growth experiments are compared to references (batch conditions).In the reference case, amorphous precipitates form, as depicted by the SEM images. With the spatially separated reactants of the flow-injection technique, the precipitate forming in the mixing zone possesses different face structures due to the presence of concentration gradients. In the case of phosphate, the surface of the outer wall is smooth (see Fig. 3A and C) while the inner wall has complex morphology corresponding to a greater surface area.
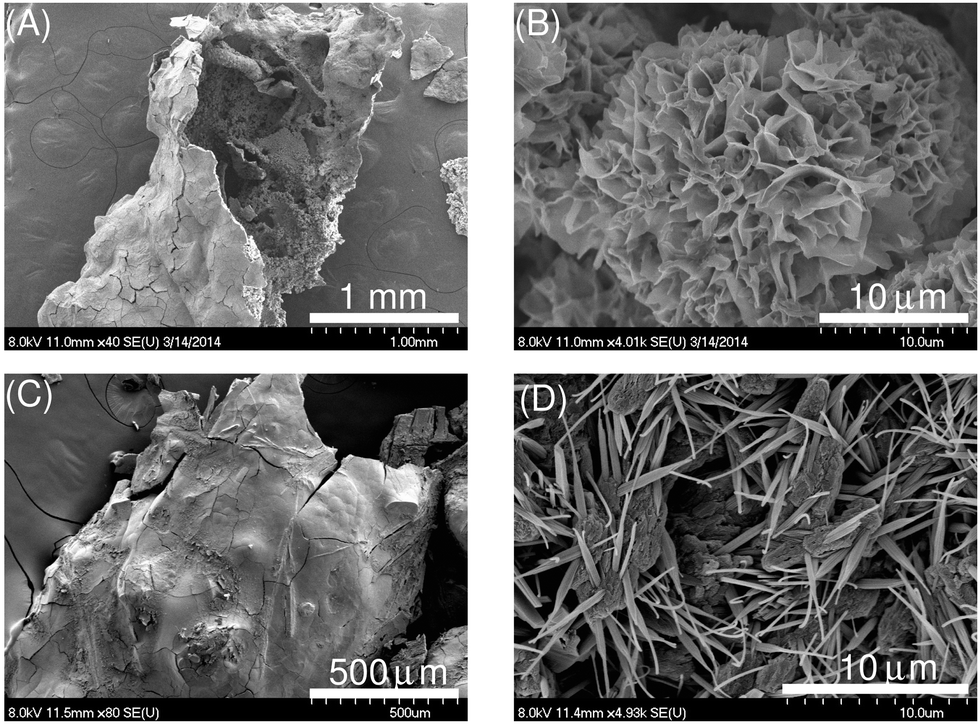 | ||
| Fig. 3 SEM images of outer (A and C) and inner surfaces (B and D) of copper phosphate tubes with [Cu2+] = 0.5 M and [PO43−] = 0.3 M. Nanoflowers evolve at w = 0.71 mL h−1 (B), while needle-shaped crystals grow at w = 1.12 mL h−1 (D). | ||
It can be seen in Fig. 3B for one set of concentrations that flower-shaped particles are formed with 20 μm size at a lower flow rate. Keeping the concentration unchanged but increasing the injection rate leads to a morphology change as 7–9 μm long needle-shaped crystals grow on the inner faces of the tubes (Fig. 3D). The flower structure is robust as it also covers the inner wall of the tubes obtained under different conditions. For example, when 0.4 M copper solution is flown into 0.2 M phosphate solution, those flowers evolve with an increased size of 25 μm. Although the structure mentioned is not in the nanometer range, the term nanoflower has been assigned to similar flower petal-shaped, micrometer-sized particles having nanoscale features.23 They can also develop in a phosphate-buffered copper sulfate solution containing bovine serum albumin22 or in cellulose stearoyl esters.23 Besides the organic and inorganic ones, protein–inorganic hybrid nanoflowers can also be synthesized.24 The enlarged surface area of copper phosphate has been shown to enhance catalytic activity, as demonstrated in the dehydration reaction of fructose to 5-hydroxymethylfurfural.25
Copper silicate tubes also exhibit a smoother outer surface (cf.Fig. 3A, C and 4A), however, unlike copper phosphate, their inner surface has amorphous character and is covered with compact spherical structures, as shown in Fig. 4B–D. Here again, the size of those spheroids contributing to the fine interior structure significantly depends on the flow rate. At w = 0.39 mL h−1, spheres with d ≈ 1 μm are formed, while at w = 1.41 mL h−1, the average diameter of the particles increases to 15 μm.
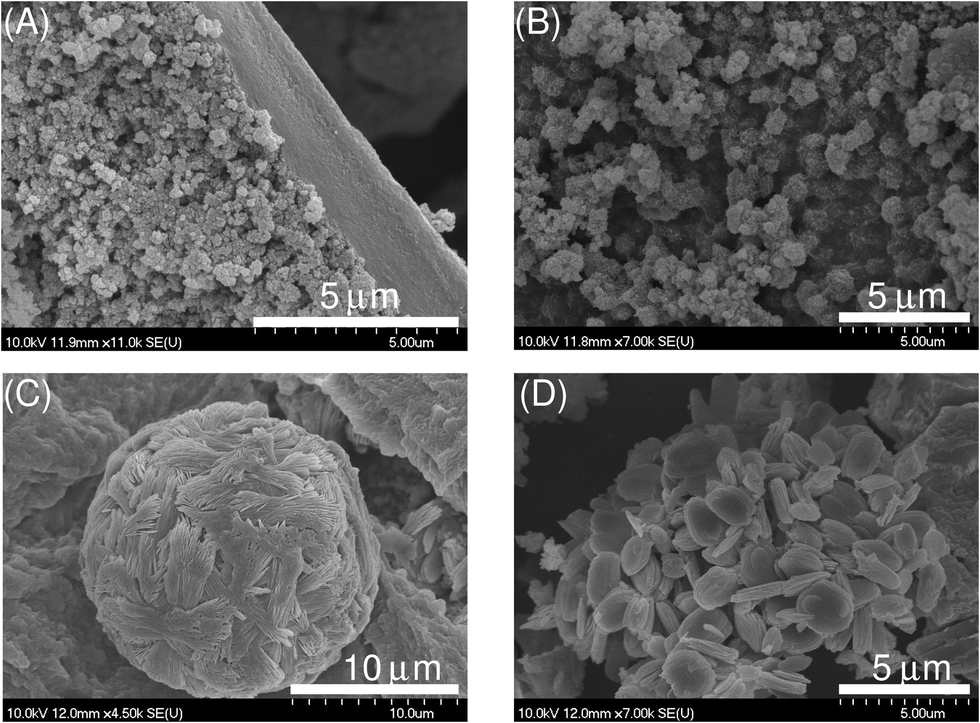 | ||
| Fig. 4 SEM images of the cross section with the right side being the outer surface (A) and inner surfaces (B–D) of copper silicate tubes with a chemical composition of [Cu2+] = 0.5 M and [SiO32−] = 1.0 M and flow rate w = 0.39 mL h−1 (B) and w = 1.41 mL h−1 (A, C and D). | ||
4 Conclusions
In this paper, we have characterized and compared hollow 3D precipitate patterns evolved in the flow-driven copper–phosphate and copper–silicate systems. When a copper solution with larger density is injected into sodium phosphate or silicate solutions, the rising tube has a volume growth rate greater than the pumping rate, which reveals a significant enclosure of the outer electrolyte into the structure. This is attributed to the membrane-like properties of the freshly formed wall that allow osmotic flow inward, the contribution of which is more pronounced in the case of phosphate indicating a less rigid structure than that for the silicates.Due to the presence of concentration gradients across the wall, the inner and outer surfaces have distinctly different microstructures. The outer electrolyte solution is significantly basic, therefore copper hydroxide together with basic copper phosphate or silicate form, which favor an amorphous structure. Hence, both the phosphate and silicate tubes have a smooth amorphous outer surface, while the inner wall structure of the phosphate has significantly greater surface area covered with nanoflowers unlike the silicate tubes or the phosphate precipitate formed in a well-stirred batch system. The flow-injection technique hence represents a tool in synthesizing hollow precipitate structures with delicate inner surfaces without the application of various additives.
Conflicts of interest
There are no conflicts to declare.Acknowledgements
This work was supported by the National Research, Development and Innovation Office (K119795 and PD121010) and GINOP-2.3.2-15-2016-00013.References
- J. R. Glauber, Furni Novi Philosophici, Amsterdam, 1646 Search PubMed.
- L. M. Barge, S. S. S. Cardoso, J. H. E. Cartwright, G. J. T. Cooper, L. Cronin, A. De Wit, I. J. Doloboff, B. Escribano, R. E. Goldstein, F. Haudin, D. E. H. Jones, A. L. Mackay, J. Maselko, J. J. Pagano, J. Pantaleone, M. J. Russell, C. I. Sainz-Diaz, O. Steinbock, D. A. Stone, Y. Tanimoto and N. L. Thomas, Chem. Rev., 2015, 115, 8652–8703 CrossRef CAS PubMed.
- E. Nakouzi and O. Steinbock, Sci. Adv., 2016, 2, e1601144 Search PubMed.
- J. H. E. Cartwright, J. M. Garcia-Ruiz, M. L. Novella and F. Otálora, J. Colloid Interface Sci., 2002, 256, 351–359 CrossRef CAS.
- D. A. Stone and R. E. Goldstein, Proc. Natl. Acad. Sci. U. S. A., 2004, 101, 11537 CrossRef CAS PubMed.
- V. Kaminker, J. Maselko and J. Pantaleone, J. Chem. Phys., 2014, 140(244901), 1–7 Search PubMed.
- B. C. Batista, P. Cruz and O. Steinbock, Langmuir, 2014, 30, 9123 CrossRef CAS PubMed.
- S. Thouvenel-Romans and O. Steinbock, J. Am. Chem. Soc., 2003, 125, 4338–4341 CrossRef CAS PubMed.
- S. Thouvenel-Romans, J. J. Pagano and O. Steinbock, Phys. Chem. Chem. Phys., 2005, 7, 2610–2615 RSC.
- L. Roszol and O. Steinbock, Phys. Chem. Chem. Phys., 2011, 13, 20100–20103 RSC.
- M. R. Bentley, B. C. Batista and O. Steinbock, J. Phys. Chem. A, 2016, 120, 4294–4301 CrossRef CAS PubMed.
- B. C. Batista and O. Steinbock, J. Phys. Chem. C, 2015, 119, 27045–27052 CAS.
- F. Haudin, V. Brasiliense, J. H. E. Cartwright, F. Brau and A. De Wit, Phys. Chem. Chem. Phys., 2015, 17, 12804–12811 RSC.
- G. Schuszter, F. Brau and A. De Wit, Environ. Sci. Technol. Lett., 2016, 3(4), 156–159 CrossRef CAS.
- G. Schuszter, F. Brau and A. De Wit, Phys. Chem. Chem. Phys., 2016, 18, 25592–25600 RSC.
- Q. Wang, M. R. Bentley and O. Steinbock, J. Phys. Chem. C, 2017, 121, 14120–14127 CAS.
- E. Nakouzi, P. Knoll, K. B. Hendrix and O. Steinbock, Phys. Chem. Chem. Phys., 2016, 119, 23044–23052 RSC.
- B. Bohner, G. Schuszter, O. Berkesi, D. Horváth and Á. Tóth, Chem. Commun., 2014, 50, 4289–4291 RSC.
- B. Bohner, G. Schuszter, D. Horváth and Á. Tóth, Chem. Phys. Lett., 2015, 631–632, 114–117 CrossRef CAS.
- E. Tóth-Szeles, G. Schuszter, Á. Tóth, Z. Kónya and D. Horváth, CrystEngComm, 2016, 18, 2057–2064 RSC.
- A. Tóth, D. Horváth, R. Smith, J. R. McMahan and J. Maselko, J. Phys. Chem. C, 2007, 111, 14762–14767 Search PubMed.
- J. Ge, J. Lei and R. N. Zare, Nat. Nanotechnol., 2012, 7, 428–432 CrossRef CAS PubMed.
- K. Zhang, A. Geissler, X. Chen, S. Rosenfeldt, Y. Yang, S. Fröster and F. Müller-Plathe, ACS Macro Lett., 2015, 4, 214–219 CrossRef CAS.
- P. Koley, M. Sakurai and M. Aono, ACS Appl. Mater. Interfaces, 2016, 8, 2380–2392 CAS.
- P. Khemthong, P. Daorattanachai, N. Laosiripojana and K. Faungnawakij, Catal. Commun., 2012, 29, 96–100 CrossRef CAS.
| This journal is © the Owner Societies 2018 |