 Open Access Article
Creative Commons Attribution 3.0 Unported Licence
Liquid electrolyte informatics using an exhaustive search with linear regression†
Keitaro
Sodeyama
 *abc,
Yasuhiko
Igarashi
 abd,
Tomofumi
Nakayama
 d,
Yoshitaka
Tateyama
 ace and
Masato
Okada
 ad
ad
aCenter for Materials Research by Information Integration (cMI2), Research and Services Division of Materials Data and Integrated System (MaDIS), National Institute for Materials Science (NIMS), 1-2-1 Sengen, Tsukuba, Ibaraki, 305-0047, Japan. E-mail: SODEYAMA.Keitaro@nims.go.jp
bPRESTO, Japan Science and Technology Agency (JST), 4-1-8 Honcho, Kawaguchi, Saitama 333-0012, Japan
cElements Strategy Initiative for Catalysts & Batteries (ESICB), Kyoto University, Nishikyo-ku, Kyoto 615-8510, Japan
dGraduate School of Frontier Sciences, The University of Tokyo, 5-1-5, Kashiwanoha, Kashiwa, Chiba 277-8561, Japan
eCenter for Green Research on Energy and Environmental Materials (GREEN), and International Center for Materials Nanoarchitectonics, National Institute for Materials Science, 1-1 Namiki, Tsukuba, Ibaraki 305-0044, Japan
First published on 14th June 2018
Abstract
Exploring new liquid electrolyte materials is a fundamental target for developing new high-performance lithium-ion batteries. In contrast to solid materials, disordered liquid solution properties have been less studied by data-driven information techniques. Here, we examined the estimation accuracy and efficiency of three information techniques, multiple linear regression (MLR), least absolute shrinkage and selection operator (LASSO), and exhaustive search with linear regression (ES-LiR), by using coordination energy and melting point as test liquid properties. We then confirmed that ES-LiR gives the most accurate estimation among the techniques. We also found that ES-LiR can provide the relationship between the “prediction accuracy” and “calculation cost” of the properties via a weight diagram of descriptors. This technique makes it possible to choose the balance of the “accuracy” and “cost” when the search of a huge amount of new materials was carried out.
1. Introduction
Computational material design with a data-driven information technique has become popular for materials research recently.1 The materials for next-generation lithium-ion batteries (LIBs) are the representative targets. Future LIBs require a higher voltage, a higher capacity, and a longer cycle life and need to be safer.2,3 For such properties, a variety of new “electrode” materials have been reported.4–6 However, new “electrolyte” materials, typically consisting of liquid solvents and Li-salts, have not appeared since 1991 for commercial use. This is because the search for liquid materials is more difficult compared to that for solid materials due to the disordered structure of liquid. Exploring new liquid materials with desirable properties is a challenging issue.7–9In order to discover new liquid electrolytes with desirable properties, virtual screening with a data-driven information technique is one possible option. In this screening, a database of the features of materials called descriptors is first constructed with data from first-principles calculations or molecular dynamics simulations and/or experiments. Next, we determine the estimation rule (fitting equation) to predict the target properties based on the selected descriptors in the database by using the information techniques. Finally, we handle a huge number of candidate materials under the rule. Several applications of virtual screening to explore new LIB materials have been reported, though most of them are limited to solid materials research.10–13 Only a few applications have been reported for the liquid materials.14–16
To extract the estimation rule for predicting the target properties, we have to select descriptors using data-driven techniques. It is called the variable selection problem. In general, multiple linear regression (MLR),17 in which all the descriptors are used for the estimation, is the most standard treatment for the estimation of the properties of materials. However, irrelevant and redundant descriptors from data do not contribute to the accuracy of a predictive model or may in fact decrease the accuracy of the model. Thus, we have to remove these descriptors. Moreover, fewer descriptors are desirable because it reduces the complexity of the model, and a simpler model is simpler to understand and explain.
When there are N explanatory variables, the simplest variable selection method is a search for all combinations of the variables which requires 2N − 1 = NC1+ NC2 +⋯+ NCN times of estimations.18 We called this naive method the exhaustive search (ES) method.19–21 Although the ES method comes at the expense of computational complexity of at least O(2N), we can use the ES method within the compass of N = 30, and the ES method can select the best descriptors for predicting the target properties. In this study, we apply the ES method for linear regression and propose a set of descriptor combinations that can produce better estimations. For comparison, we also apply least absolute shrinkage and selection operator (LASSO)22 using an L1-norm regularization term as a standard approximate method for the sparse variable selection, for which the computational complexity is O(N3).
In the search for LIB liquid electrolytes, the evaluation of the properties of ion transport and electrochemical stability is indispensable. For the transport, solvation to and desolvation from Li-ions at the electrolyte/electrode interface plays a crucial role, and thus the coordination energy of the solvent to Li-ions is an important measure. In order to keep the liquid state for the fast Li-ion transport, the melting point of the electrolyte is also a fundamental property. For the electrochemical stability, the quantities such as ionization potential and electron affinity are significant. Here, however, we focus on the quantities related to the Li-ion transport as the first target.
In this study, we investigated the estimation accuracy of the MLR, LASSO, and ES-LiR techniques in the search for liquid electrolyte materials. We estimated the coordination energies and melting points as the required properties of the LIB liquid electrolytes and discussed the extracted descriptors by LASSO and ES with linear regression (ES-LiR). The strategy of the ES-LiR method will be useful and applicable in the search for liquid electrolytes with other desired properties.
2. Computational details
2.1. Database
To predict novel LIB liquid electrolytes with desired properties by the information techniques, we constructed a database of known liquid electrolytes. We selected 103 solvent molecules which were commercialized as battery grade materials from KISHIDA Chemical Co., Ltd.23 We adopted the values of melting point, boiling point, flash point, density of solvent, and molecular weight from the catalogue data. Representative solvent molecules are shown in Scheme 1 and the complete list is shown in Scheme S1 of the ESI.†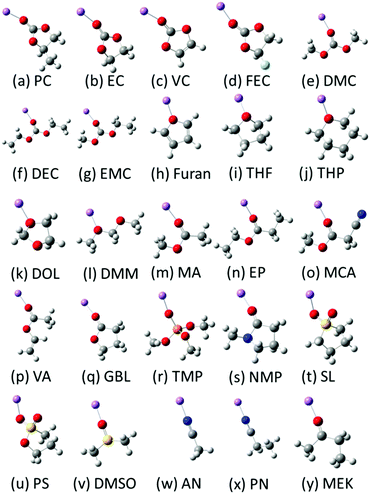 | ||
| Scheme 1 Representative 25 solvent molecules for the database (Li, purple; O, red; N, blue; C, grey; F, light blue; S, yellow; P, orange; H, white). Whole molecules are shown in Scheme S1 in the ESI.† The solvent names are referred to in Table 1. | ||
2.2. Cluster model calculations
To make the database of the electrolytes more substantial, we added the following values obtained by density functional theory (DFT) calculations of the molecular systems using the Gaussian 09 code:24 the coordination energy between a Li-ion and a solvent molecule, the Mulliken charge of the atom (typically oxygen atom) that is coordinated to a Li-ion, the distance between a Li-ion and the coordinated atom (typically Li–O distance) (R(Li–O)), the HOMO energy, the LUMO energy, and the dipole moment values of the 103 solvent molecules. The calculated data of the representative solvent molecules are shown in Table 1, and the complete data are listed in Table S1 in the ESI.† The coordination energies (Ecoord) are evaluated by the difference between the “total energy of a Li–solvent complex” and “the total energies of a solvent molecule and that of a Li-ion” (Ecoord = E(Li–solvent) − {E(solvent) + E(Li-ion)}). We adopted the B3LYP functional25 with cc-pVDZ basis sets.26 The Mulliken charges and the dipole moments are obtained from the DFT calculations of pure solvent molecules without Li-ions. Geometry optimizations of the Li–solvent complexes and the pure solvent molecules were also carried out. In this study, totally 10 descriptors (explanation variables) were adopted for the database. There are several missing data in the catalogue. We omitted them for the prediction. When the data have no specific value but a range of values, we averaged them.| Abbreviation | Solvent name | Chemical formula | E coord (kcal mol−1) | HOMO (eV) | LUMO (eV) | Dipole moment (Debye) | Mulliken charge | R(Li–O) (Å) |
|---|---|---|---|---|---|---|---|---|
| PC | Propylene carbonate | C4H6O3 | −57.4 | −7.93 | 0.946 | 5.255 | −0.243 | 1.747 |
| EC | Ethylene carbonate | C3H4O3 | −55.9 | −8.017 | 0.919 | 5.07 | −0.24 | 1.752 |
| VC | Vinylene carbonate | C3H2O3 | −51.7 | −6.973 | −0.137 | 4.365 | −0.231 | 1.76 |
| FEC | Fluoroethylene carbonate | C3H3O3F | −51.2 | −8.468 | 0.493 | 4.487 | −0.222 | 1.763 |
| DMC | Dimethyl carbonate | C3H6O3 | −50.0 | −7.774 | 1.115 | 0.342 | −0.306 | 1.747 |
| DEC | Diethyl carbonate | C5H10O3 | −52.6 | −7.654 | 1.217 | 0.613 | −0.308 | 1.74 |
| EMC | Ethyl methyl carbonate | C4H8O3 | −51.3 | −7.713 | 1.168 | 0.514 | −0.307 | 1.744 |
| DAC | Diallyl carbonate | C7H14O3 | −31.7 | −7.419 | −0.238 | 0.494 | −0.306 | 1.74 |
| Furan | Furan | C4H4O | −48.7 | −6.265 | 0.296 | 0.511 | −0.17 | 1.866 |
| THF | Tetrahydrofuran | C4H8O | −47.2 | −6.832 | 1.38 | 1.434 | −0.323 | 1.808 |
| THP | Tetrahydropyran | C5H10O | −43.2 | −6.711 | 1.537 | 1.301 | −0.324 | 1.804 |
| DOL | 1,3-Dioxolane | C3H6O2 | −64.4 | −6.955 | 1.493 | 1.324 | −0.315 | 1.818 |
| DMM | Dimethoxy methane | C3H8O2 | −52.0 | −6.846 | 1.459 | 2.165 | −0.298 | 1.905 |
| MA | Methyl acetate | C3H6O2 | −53.5 | −7.371 | 0.339 | 1.733 | −0.265 | 1.755 |
| EP | Ethyl propionate | C5H10O2 | −58.6 | −7.31 | 0.414 | 1.763 | −0.269 | 1.787 |
| GBL | g-Butyrolactone | C4H6O2 | −54.7 | −7.269 | 0.254 | 4.296 | −0.237 | 1.758 |
| TMP | Trimethyl phosphate | C3H9O4P | −56.8 | −7.765 | 1.112 | 3.356 | −0.467 | 1.74 |
| NMP | N-Methyl-2-pyrrolidone | C5H9ON | −65.1 | −6.421 | 0.842 | 3.609 | −0.299 | 1.724 |
| ES | Ethylene sulfite | C2H4O3S | −63.9 | −7.725 | −0.823 | 3.123 | −0.423 | 1.758 |
| SL | Sulfolane | C4H8O2S | −63.7 | −7.383 | 0.826 | 5.087 | −0.459 | 2.014 |
| PS | 1,3-Propane sultone | C3H6O3S | −57.3 | −7.917 | 0.549 | 5.468 | −0.426 | 2.034 |
| DMSO | Dimethyl sulfoxide | C2H6OS | −67.8 | −6.01 | 0.963 | 3.821 | −0.542 | 1.718 |
| AN | Acetonitrile | C2H3N | −47.0 | −8.933 | 0.898 | 3.743 | −0.181 | 1.92 |
| PN | Propionitrile | C3H5N | −48.4 | −8.802 | 0.587 | 3.826 | −0.185 | 1.914 |
| MEK | Methyl ethyl ketone | C4H8O | −53.0 | −6.601 | −0.386 | 2.771 | −0.225 | 1.759 |
2.3. Data-driven information techniques
We applied the data-driven information techniques of MLR, LASSO, and ES-LiR to the electrolyte materials search. MLR is a typical supervised machine learning technique to predict certain values of the properties. The method tries to represent the relationship between the set of the given values of the properties, called explanation variables, and the target values for the prediction, called dependent variable, by constructing a model of the linear equation. We set a target value and an i-th explanation variable as z and xi (i = 1,…, 10), respectively. We then assume that the relationship between them is linear and derive it from minimizing eqn (1), | (1) |
As descriptors xi, we adopted the following sets of features, x1 = boiling point, x2 = density, x3 = dipole moment, x4 = flash point, x5 = HOMO, x6 = LUMO, x7 = melting point, x8 = molecular weight, x9 = Mulliken charge, and x10 = distance between the Li-ion and the coordinated oxygen atom for the prediction of the coordination energies. In the case of the melting point prediction, x7 is redefined to the coordination energy and the other descriptors are the same as in the former case.
LASSO is also the supervised machine learning method. The linear equation of the fitting is the same as that of the MLR method, while LASSO involves a penalty term as expressed in the second term of eqn (2).
 | (2) |
To determine a suitable value of the penalty parameter, λ, we use cross validation (CV), which approximately extract the prediction error from the limited data. For the CV, the given data from the database are divided to training data and validating data to evaluate the prediction accuracy. After the iteration of this training and validating process with different dividing positions, the CV error is obtained with less variability. We carried out the 10-fold (10 times iterations) cross validation and choose an optimal based on when the CV error was at its minimum. In this study, the CV error of LASSO is derived from the coefficients in eqn (2), which are affected by the optimal penalty parameter.
We then consider the proposed sparse estimation technique, ES-LiR. Assuming that the coefficients are sparse, namely, the coefficients have a small number of non-zero elements, we estimate which coefficient of the explanatory variable is non-zero. To be more precise, let us consider that the number of explanatory variables is N. In ES-LiR, in contrast to LASSO, whether each coefficient is zero or not is determined by exhaustively evaluating all combinations of N explanatory variables, 2N − 1. To evaluate each combination, each value of the non-zero coefficient is determined by the least squares method and we calculate the CVE for each combination. Finally, we obtain optimal non-zero elements. This approach requires a longer calculation time compared with MLR and LASSO. In this study, the size of the data is not large and we can easily apply the ES-LiR method for the estimation.
We formulate exhaustive search for the linear regression problem (ES-LiR) by using an indicator variable that represents a combination of non-zero explanatory variables. The indicator is defined as an N-dimensional binary vector,
| c = (c1, c2,…, cN) ∈ {0,1}N | (3) |
where p is the number of samples. This formulation makes the essence of the problem more explicit, and the best c for modeling and predicting a target variable, z, is searched by minimizing the CVE in ES-LiR.
It is easy to imagine that the ES method becomes intractable for a large size. To reduce the computational load, it is effective to use sampling methods, such as the Markov chain Monte Carlo (MCMC) method and the replica exchange Monte Carlo (REMC) method. In our previous study,21 to deal with the difficulty, we proposed the approximate exhaustive search (AES) method for linear regression, using the above sampling method.
3. Results and discussion
3.1. Coordination energy prediction
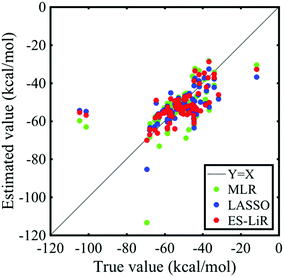
The correlation between the calculated coordination energies and estimated ones by MLR, LASSO, and ES-LiR is shown in Fig. 1, and their predicted values are shown in Table 2. In these data, the estimated values have a good correlation with the true values (DFT calculated data). For the samples with the lowest coordination energies of around −100 kcal mol−1 (true value), the estimation accuracy is not high. The solvents are 12-crown 4-ether and 18-crown 6-ether as shown in Tables S1 and S2 (ESI†). They coordinate to Li-ions by four or more oxygen atoms of the solvent. Thus, the coordination manner is different from the other solvents, and it can be affected to the low estimation accuracy of the coordination energy.| Solvents | True value | MLR | LASSO | ES-LiR |
|---|---|---|---|---|
| PC | −57.4 | −50.7 | −55.5 | −57.1 |
| EC | −55.9 | −55.5 | −55.6 | −57.6 |
| VC | −51.7 | −54.1 | −53.1 | −53.0 |
| FEC | −51.2 | −49.3 | −53.3 | −55.8 |
| DMC | −50.0 | −55.0 | −53.6 | −53.9 |
| DEC | −52.6 | −51.0 | −52.7 | −53.8 |
| EMC | −51.3 | −52.3 | −54.9 | −54.8 |
| Furan | −31.7 | −48.0 | −48.4 | −46.1 |
| THF | −48.7 | −51.3 | −53.4 | −52.5 |
| THP | −47.2 | −50.1 | −52.0 | −51.9 |
| DOL | −43.2 | −47.0 | −53.6 | −53.6 |
| DMM | −64.4 | −49.7 | −50.6 | −49.2 |
| MA | −52.0 | −50.3 | −51.5 | −51.8 |
| EP | −53.5 | −51.5 | −51.6 | −51.5 |
| MCA | −58.6 | −50.8 | −52.1 | −54.6 |
| VA | −54.7 | −52.0 | −51.0 | −49.6 |
| GBL | −56.8 | −52.5 | −54.5 | −55.5 |
| TMP | −65.1 | −59.7 | −62.8 | −64.8 |
| NMP | −63.9 | −58.7 | −57.3 | −57.7 |
| SL | −63.7 | −56.8 | −61.4 | −66.3 |
| PS | −57.3 | −60.3 | −59.5 | −61.1 |
| DMSO | −67.8 | −68.2 | −64.7 | −67.2 |
| AN | −47.0 | −46.5 | −45.6 | −46.6 |
| PN | −48.4 | −45.3 | −46.4 | −47.2 |
| MEK | −53.0 | −51.9 | −49.3 | −49.4 |
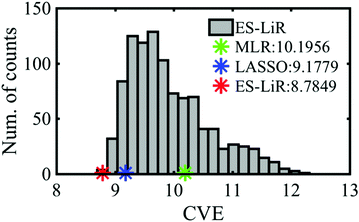
The CV errors of the MLR, LASSO and ES-LiR methods were calculated to be 10.2, 9.18, and 8.78 kcal mol−1, respectively (Table 3). This suggests that the prediction accuracy of ES-LiR is the best among the three methods. The accuracy is mainly affected by the quality of the descriptor choice and the selection of the data-driven technique. Regarding the choice of descriptors, we can generate the descriptors from first-principles calculation results to improve the prediction accuracy, though too many descriptors may cause over-fitting in some information techniques and decrease the accuracy, especially the MLR case. The ES-LiR method can consider the whole combination patterns of the descriptors, and the over-fitting is easily detected by the result of the less prediction accuracy of the combinations. This indicates that we are not suffered from the selection of the information techniques. Remaining treatment for improving the prediction accuracy is by increasing the amount of descriptors.
| Data-driven technique | Combination of descriptors | CV error (kcal mol−1) |
|---|---|---|
| x 1 = boiling point, x2 = density, x3 = dipole moment, x4 = flash point, x5 = HOMO, x6 = LUMO, x7 = melting point, x8 = molecular weight, x9 = Mulliken charge, and x10 = R(Li–O). | ||
| MLR | x 1 – x10 | 10.2 |
| LASSO | x 4, x8, x9, x10 | 9.18 |
| ES-LiR | x 4, x9, x10 | 8.78 |
Fig. 2 shows the histogram of the CV errors of descriptor combinations calculated by the ES-LiR method. The histogram can extract not only the optimal solution but all the solutions, which enable us to map the solutions of various machine learning and data-driven methods and scientists’ hypotheses. Then, we can evaluate these methods and hypotheses.21 As shown in Fig. 2, the CV errors of MLR and LASSO and the best value of ES-LiR are depicted. This suggests that LASSO, which has been widely used in recent studies, is not a best prediction method and the extracted descriptors are not a best combination (Table 3) from the combinations of the small CVE data.
The ES-LiR method not only minimizes the CVE but also derives the CVE in all combinations, so you can see the whole picture of them. Using the whole pictures, the ES-LiR method can be used to construct the weight diagram, which shows the top 25 best combinations of the descriptors, as shown in Fig. 3. The weight diagram reveals the stability of the important descriptors for the estimation, even if the error is at the same level as the other methods. Each colour represents the fitted coefficient of each descriptor, which shows the importance for the coordination energy prediction. The white-blocks of the map correspond to the descriptors which are not adopted for the prediction. From this data, the Mulliken charge is the significant descriptor for the coordination energy prediction and flash point, and R(Li–O) can also contribute to it. The coordination energy is highly affected by the Coulomb interaction between the Li cation and the oxygen atom that has a negative electron charge. Thus, the extraction of the Mulliken charge as a good descriptor fits our chemical intuition, even if the Mulliken charge values are sometimes quantitatively not stable with the basis functions. The R(Li–O) is also a trivial descriptor for the estimation of the solvation energy because the distance corresponds to the strength of the interaction between Li and O. On the other hand, the flash point is not a trivial descriptor. It might be a weak relationship between “the oxygen radical reaction for burning” and “the Li cation–solvent interaction”, though the number of the samples should be increased for such a discussion.
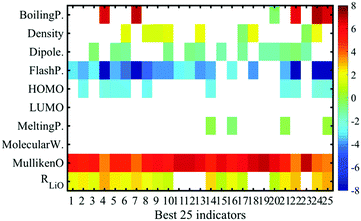 | ||
| Fig. 3 Weight diagram of the descriptors on accurate top 25 combinations of descriptors for the coordination energy prediction. | ||
In materials informatics, proper combinations of descriptors change depending on the purpose of data analysis. In this paper, our goal is both to accurately predict the coordination energy and to reduce the calculation cost. Using the weight diagram (Fig. 3), we realize our purpose. As shown in Fig. 3, the 11th accurate combination does not include the descriptor of R(Li–O). To obtain the distance between Li and oxygen, additional Li–solvent complex calculations are required, though the other descriptors, density, flash point, and Mulliken charge, are obtained by catalogue data and only solvent calculations. The difference in the first and 11th CV errors is quite small, 0.126 kcal mol−1. The value is not a significantly big difference for comparing the coordination energies of various solvents. According to Table 1, the 10−1 kcal mol−1 order is the target accuracy for coordination energies. Then, if we choose the 11th best combination of descriptors (“Flash point” and “Mulliken charge”), we can reduce the calculation cost to a half because the extra calculation for obtaining R(Li–O) is omitted. This indicates that we can choose the balance of the “prediction accuracy” and the “calculation cost for obtaining the descriptors” for the combinatorial material search when we employ the ES-LiR method and calculate the histogram and weight diagram.
3.2. Melting point
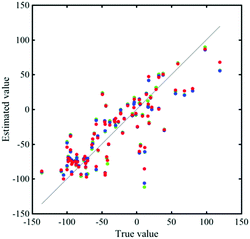
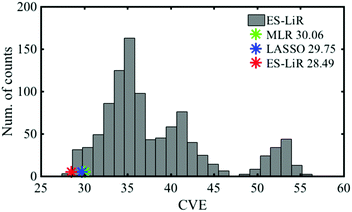
Fig. 4 shows the correlation between the melting point from the catalogue data and the estimated data by MLR, LASSO, and ES-LiR. The CV errors of them were obtained to be 30.06, 29.75, and 28.49 °C, respectively (Table 4). Although the CV error is still large in ES-LiR, the error of ES-LiR is smaller than the LASSO and MLR results. From the extraction of the descriptors by LASSO, density is one of the significant descriptors for the melting point. It matches the chemical intuition because the density is highly related to the interaction between the solvent molecules in the liquid state, and the melting point is also highly affected by the interaction between the solvent molecules. Since LASSO is an approximation method, even if the choice of the descriptors matches the scientific background, it may be just a coincidence. There is a possibility that the completely different set of descriptors can reproduce a more accurate estimation. In contrast, the ES-LiR method can propose a reliable set of descriptors from the best to worst estimations. Fig. 5 shows the histogram of the whole combination patterns of descriptors obtained by ES-LiR. Fig. 6 confirms that from at least the top 25 combinations, density is one of the most important descriptors and flash point, molecular weight and Mulliken charge have also big contributions for the melting point prediction.| Data-driven technique | Combination of descriptors | CV error (C) |
|---|---|---|
| x 1 = boiling point, x2 = density, x3 = dipole moment, x4 = flash point, x5 = HOMO, x6 = LUMO, x7 = coordination energy, x8 = molecular weight, x9 = Mulliken charge, and x10 = R(Li–O). | ||
| MLR | x 1 − x10 | 30.06 |
| LASSO | x 2 − x10 | 29.75 |
| ES-LiR | x 2, x3, x4, x5, x8, x9 | 28.49 |
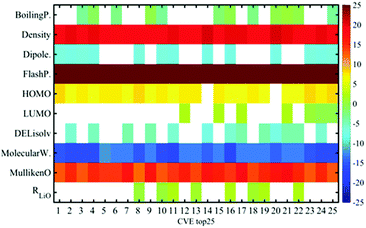 | ||
| Fig. 6 Weight diagram of descriptors based on the accurate top 25 combinations of descriptors for the melting point prediction. | ||
3.3. Statistical significance of the proposed methods about the CV error
Let us consider the statistical significance of the difference in the CV errors of MLR, LASSO, and ES-LiR. For the evaluation of the CV errors, we calculated the CV error for each data set in ES-LiR, just like the condition of LASSO. As a result of applying it to the coordination energy prediction, the CV errors of MLR, LASSO, and ES-LiR are respectively 10.20, 9.18, and 6.34. We conducted a paired sample t-test to the data of 10-fold CV errors of “MLR and ES-LiR” and “LASSO and ES-LiR”, and the p value was less than 0.001, which was a significant result.4. Conclusions
In order to explore new LIB electrolyte materials, we investigated the estimation procedure by data-driven information techniques. We predicted the coordination energies and melting points of solvents by information techniques such as MLR, LASSO, and ES-LiR. ES-LiR reproduced the most accurate estimation of the properties among them. We found that ES-LiR chose the balance of “prediction accuracy” and the “calculation cost to obtain the descriptors” when the combinatorial material search by virtual screening was carried out. This feature is general for all the material exploring studies with virtual screening. This treatment can be a key technique to future material searches.Conflicts of interest
There are no conflicts to declare.Acknowledgements
This research was supported by the JST, PRESTO and NIMS, “Materials research by information” integration initiative. The calculations in this work were carried out on the supercomputer center of NIMS. The work was supported in part by the K computer at the RIKEN AICS through the HPCI System Research Projects (Proposal no. hp160174, hp170198, and hp180134). This work was also supported in part by MEXT KAKENHI (JP15H05701).References
- T. Lookman, F. J. Alexander and K. Rajan, Information Science for Materials Discovery and Design, Springer, New York, 2015 Search PubMed.
- J. B. Goodenough and Y. Kim, Chem. Mater., 2010, 22, 587–603 CrossRef.
- K. Xu, Chem. Rev., 2004, 104, 4303–4417 CrossRef PubMed.
- H.-J. Peng, S. Urbonaite, C. Villevieille, H. Wolf, K. Leitner and P. Novak, J. Electrochem. Soc., 2015, 162, A7072–A7077 CrossRef.
- N. Yabuuchi, M. Takeuhci, M. Nakayama, H. Shiiba, M. Ogawa, K. Nakayama, T. Ohta, D. Endo, T. Ozaki, T. Inamasu, K. Sato and S. Komaba, Proc. Natl. Acad. Sci. U. S. A., 2015, 112, 7650–7655 CrossRef PubMed.
- F. Luo, B. Liu, J. Zheng, G. Chu, K. Zhong, H. Li, X. Huang and L. Chen, J. Electrochem. Soc., 2015, 162, A2509–A2528 CrossRef.
- Y. Yamada, K. Furukawa, K. Sodeyama, M. Yaegashi, K. Kikuchi, Y. Tateyama and A. Yamada, J. Am. Chem. Soc., 2014, 136, 5039–5046 CrossRef PubMed.
- K. Sodeyama, Y. Yamada, K. Aikawa, A. Yamada and Y. Tateyama, J. Phys. Chem. C, 2014, 118, 14091–14097 Search PubMed.
- J. Haruyama, K. Sodeyama, L. Han, K. Takada and Y. Tateyama, Chem. Mater., 2014, 26, 4248–4255 CrossRef.
- A. Jain, S. P. Ong, G. Hautier, W. Chen, W. D. Richards, S. Dacek, S. Cholia, D. Gunter, D. Skinner, G. Ceder and K. A. Persson, APL Mater., 2013, 1, 011002 CrossRef.
- M. Nishijima, T. Ootani, Y. Kamimura, T. Sueki, S. Esaki, S. Murai, K. Fujita, K. Tanaka, K. Ohira, Y. Koyama and I. Tanaka, Nat. Commun., 2014, 5, 4553 CrossRef PubMed.
- R. Jalem, T. Aoyama, M. Nakayama and M. Nogami, Chem. Mater., 2012, 24, 1357–1364 CrossRef.
- R. Jalem, M. Kimura, M. Nakayama and T. Kasuga, J. Chem. Inf. Model., 2015, 55, 1158–1168 CrossRef PubMed.
- M. Korth, Phys. Chem. Chem. Phys., 2014, 16, 7919–7926 RSC.
- T. Husch, N. D. Yilmazer, A. Balducci and M. Korth, Phys. Chem. Chem. Phys., 2015, 17, 3394–3401 RSC.
- N. N. Rajput, X. Qu, N. Sa, A. K. Burrell and K. A. Persson, J. Am. Chem. Soc., 2015, 137, 3411–3420 CrossRef PubMed.
- C. M. Bishop, in Pattern Recognition and Machine Learning, ed. M. Jordan, J. Kleinberg and B. Schölkopf, Springer Science + Business Media LLC, New York, 2006, 128 Search PubMed.
- T. M. Cover and J. M. Van Campenhout, IEEE Trans. Syst. Man Cybern., 1977, 7(9), 657–661 CrossRef.
- K. Nagata, J. Kitazono, S. Nakajima, S. Eifuku, R. Tamura and M. Okada, IPSJ Online Trans., 2015, 8, 25–32 CrossRef.
- Y. Igarashi, K. Nagata, T. Kuwatani, T. Omori, Y. Nakanishi-Ohno and M. Okada, J. Phys.: Conf. Ser., 2016, 699, 012001 CrossRef.
- Y. Igarashi, H. Takenaka, Y. Nakanishi-Ohno, M. Uemura, S. Ikeda and M. Okada, J. Phys. Soc. Jpn., 2018, 87, 044802 CrossRef.
- R. Tibshirani, J. Royal Stat. Soc. B, 1996, 58, 267–288 Search PubMed.
- KISHIDA product information, http://www.kishida.co.jp/english/product, accessed July 2016.
- M. J. Frisch, G. W. Trucks, H. B. Schlegel, G. E. Scuseria, M. A. Robb, J. R. Cheeseman, G. Scalmani, V. Barone, B. Mennucci, G. A. Petersson, H. Nakatsuji, M. Caricato, X. Li, H. P. Hratchian, A. F. Izmaylov, J. Bloino, G. Zheng, J. L. Sonnenberg, M. Hada, M. Ehara, K. Toyota, R. Fukuda, J. Hasegawa, M. Ishida, T. Nakajima, Y. Honda, O. Kitao, H. Nakai, T. Vreven, J. A. Montgomery, Jr., J. E. Peralta, F. Ogliaro, M. Bearpark, J. J. Heyd, E. Brothers, K. N. Kudin, V. N. Staroverov, R. Kobayashi, J. Normand, K. Raghavachari, A. Rendell, J. C. Burant, S. S. Iyengar, J. Tomasi, M. Cossi, N. Rega, J. M. Millam, M. Klene, J. E. Knox, J. B. Cross, V. Bakken, C. Adamo, J. Jaramillo, R. Gomperts, R. E. Stratmann, O. Yazyev, A. J. Austin, R. Cammi, C. Pomelli, J. W. Ochterski, R. L. Martin, K. Morokuma, V. G. Zakrzewski, G. A. Voth, P. Salvador, J. J. Dannenberg, S. Dapprich, A. D. Daniels, Ö. Farkas, J. B. Foresman, J. V. Ortiz, J. Cioslowski and D. J. Fox, Gaussian 09 (Revision D.01), Gaussian, Inc., Wallingford CT, 2009 Search PubMed.
- A. D. Becke, J. Chem. Phys., 1993, 98, 5648–5652 CrossRef.
- T. H. Dunning Jr., J. Chem. Phys., 1989, 90, 1007–1023 CrossRef.
Footnote |
| † Electronic supplementary information (ESI) available. See DOI: 10.1039/c7cp08280k |
| This journal is © the Owner Societies 2018 |


