 Open Access Article
Creative Commons Attribution 3.0 Unported Licence
Dihydrogen vs. hydrogen bonding in the solvation of ammonia borane by tetrahydrofuran and liquid ammonia†
David J.
Ingram
 ab,
Thomas F.
Headen
 *c,
Neal T.
Skipper
ad,
Samantha K.
Callear
c,
Matthew
Billing
b and
Andrea
Sella
b
aDepartment of Physics & Astronomy, University College London, Gower Street, London, WC1E 6BT, UK
bDepartment of Chemistry, University College London, 20 Gower Street, London, WC1H 0AJ, UK
cISIS Facility, Rutherford Appleton Laboratory, Chilton, Oxfordshire, OX11 0QX, UK. E-mail: tom.headen@stfc.ac.uk
dLondon Centre for Nanotechnology, University College London, Gower Street, London, WC1E 6BT, UK
First published on 23rd April 2018
Abstract
The solvation structures of two systems rich in hydrogen and dihydrogen bonding interactions have been studied in detail experimentally through neutron diffraction with hydrogen/deuterium isotopic substitution. The results were analysed by an atomistic Monte Carlo simulation employing refinement to the experimental scattering data. The systems studied were the hydrogen storage material ammonia borane (NH3BH3, AB) dissolved in tetrahydrofuran (THF), and liquid ammonia (NH3), the latter in which AB shows unusually high solubility (260 g AB per 100 g NH3) and potential regeneration properties. The full orientational and positional manner in which AB–AB, AB–THF and AB–NH3 pairs interact with each other were successfully deciphered from the wide Q-range total neutron scattering data. This provided an unprecedented level of detail into such highly (di)hydrogen bonding solute–solvent interactions. In particular this allowed insight into the way in which H–B acts as a hydrogen bond acceptor. The (di)hydrogen bonding was naturally determined to dictate the intermolecular interactions, at times negating the otherwise expected tendency for polar molecules to align themselves with anti-parallel dipole moments. Several causes for the extreme solubility of AB in ammonia were determined, including the ability of ammonia to (di)hydrogen bond to both ends of the AB molecule and the small size of the ammonia molecule relative to AB and THF. The AB B–H to ammonia H dihydrogen bond was found to dominate the intermolecular interactions, occurring almost three times more often than any other hydrogen or dihydrogen bond in the system. The favourability of this interaction was seen on the bulk scale by a large decrease in AB clustering in ammonia compared to in the dihydrogen bond-less THF.
1 Introduction
A classic example of an important intermolecular interaction is the hydrogen bond.1 This follows the pattern X–H⋯Y, where the donor atom X, being more electronegative than hydrogen, causes said hydrogen to possess a partial positive charge. The acceptor, Y, is an atom capable of stabilising this charge, usually taking the form of an atom with a free lone or non-bonding pair of electrons, commonly a nitrogen or oxygen. Hydrogen bonds are common, and influence the properties of molecules as small as water, up to those as large and complex as proteins and DNA.A somewhat rarer type of intermolecular interaction is dihydrogen bonding. This is quite similar to regular hydrogen bonding in terms of the donor, but the difference lies in that the acceptor is no longer a single atom. A dihydrogen bond instead follows the pattern X–H⋯H–Y, where the H bound to Y possesses a partial negative charge, caused normally by the relatively lower electronegativity of Y. This leads to a weak electrostatic attraction between the two hydrogens involved. Dihydrogen bonds have been observed within transition metal hydrides, playing a role in processes such as proton transfer and H2 evolution.2 Dihydrogen bonding has also frequently been observed in main group hydrides, especially those containing boron, where they have been shown to enable stereochemical control of reactions like reduction.3,4
Amine-boranes are a family of compounds known to be rich in dihydrogen bonding, owing to the hydridic and protonic natures of the hydrogens bound to boron and nitrogen respectively. Ammonia borane (NH3BH3, AB) is the simplest amine-borane, and studies of the solid-state structure of AB, both theoretical and experimental, are numerous.5–9 In AB, the dihydrogen bonds were distinguished from other intermolecular interactions (such as van der Waals forces) and classified as a type of hydrogen bond using “atoms in molecules” theory.10 The HN⋯HB dihydrogen bond is responsible for many of the properties of AB, including the high melting point (110–114 °C, cf. the isoelectronic ethane −182.8 °C).11
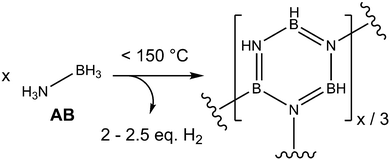
AB has received wide-spread attention due to its potential as an air-stable and safe hydrogen storage material. AB contains 19.6 wt% hydrogen, approximately 13–16 wt% (2–2.5 eq. H2 per AB) of which can be extracted by heating to mild temperatures (<150 °C) (Fig. 1). The dihydrogen bonds have to be overcome in order for the material to melt, which occurs simultaneously with the onset of hydrogen release.11 In addition to these intermolecular interactions, homopolar HB⋯HB interactions have been theorised to exist during the dehydrogenation process, due to an isotopic substitution experiment (which observed, for example, D2 on dehydrogenation of NH3BD3).12
A factor holding back the use of AB is in the difficulty of recycling the waste material post-dehydrogenation. This waste consists of a variety of partially hydrogenated hexagonal boron nitride-like products. Many attempts have been made to efficiently regenerate AB waste.13–17 A promising one-pot route involves treating the waste with hydrazine in liquid ammonia, which was shown to regenerate an AB waste surrogate successfully in 24 hours at 40 °C.14 A further curiosity in terms of treating AB waste surrogates with liquid ammonia was demonstrated by Davis et al., who showed that some Lewis bases (specifically, pyridine and ammonia) were able to scavenge some of the residual high energy B–H bonds in the waste and rearrange them to form BH3. If the Lewis base used was ammonia, this led to direct regeneration of some of the waste back into AB.18 AB also has an extremely high solubility in ammonia (260 g AB per 100 g NH3 at 298 K, cf. 25 g AB per 100 g tetrahydrofuran).11 This behaviour raises the question of how AB interacts with ammonia in solution, and has implications for future attempts at the regeneration of AB waste.
While there have been studies into the dynamics of dihydrogen bonding using IR and NMR spectroscopy, there has not yet to our knowledge been a detailed empirical analysis of the full structural and orientational way in which dihydrogen bonding occurs in solution.19,20 Solvation as studied through neutron diffraction is a wide-ranging and active subject with applications in many fields ranging from physical chemistry to biochemistry.21–27 In addition to the AB–ammonia interactions, a more fundamental interest in the nature of solvation in such a (di)hydrogen bond-rich environment sparks our study of these systems. Insight into the AB–AB intermolecular interactions is a further goal for this work. Due to the concurrent release of hydrogen when AB melts, the interactions within molten AB cannot be directly studied; a concentrated solution of AB in liquid ammonia, especially considering the structural similarities, is probably the best analogue for studying such a system.
In this paper the solvation structure of AB in both liquid ammonia and tetrahydrofuran (THF), another common solvent, has been investigated through the use of neutron diffraction. Empirical Potential Structure Refinement (EPSR) was used to analyse the results, and build up a simulation box that could be interrogated to determine the spatial and orientational solvent–solute interactions.28–30 Isotopic substitution of both the solvent and solute hydrogens for deuterium was performed to obtain additional, complementary constraints for the data refinement process. The results were compared with those from solid state diffraction and ab initio calculations of dimers, providing important insight into the distribution of dihydrogen bonding structures in the liquid state. A description of the theory behind the neutron diffraction experiments and the EPSR procedure is provided in the ESI.†
2 Results and discussion
The neutron scattering experiments were performed on 7 samples for AB in THF and 3 samples for AB in NH3 (details in Experimental section). Table 1 shows the seed parameters used for the EPSR simulations, with the atom nomenclature shown in Fig. 2. The Lennard-Jones parameters for AB were adapted from the CHARMM parameters for methylamine used in Chen et al., as parameters for AB do not exist to our knowledge.31 It is important to mention that the seed potentials are only a starting point, and differences in structural behaviour induced in the simulation would be compensated for by the refinement. The AB charges were sourced from a Mulliken analysis of AB itself.32 For ammonia, the nitrogen parameters were taken from Gao et al., with the hydrogen values adjusted to match the AB N–Hs.33 Finally, the THF parameters were taken from the OPLS all-atom force field.34–38| Atom label | Epsilon/kJ mol−1 | Sigma/Å | Charge/e |
|---|---|---|---|
| N | 0.25104 | 3.5458 | −0.9100 |
| B | 0.33472 | 3.5458 | −0.2900 |
| HN | 0.04184 | 1.5591 | 0.4500 |
| HB | 0.16736 | 2.2451 | −0.0500 |
| NA | 0.87900 | 3.3600 | −1.0260 |
| HA | 0.04184 | 1.5591 | 0.3420 |
| O1 | 0.58576 | 2.9000 | −0.4000 |
| C1 | 0.27614 | 2.5000 | 0.1400 |
| C2 | 0.27614 | 2.5000 | −0.1200 |
| HC1 | 0.12552 | 2.5000 | 0.0300 |
| HC2 | 0.12552 | 2.5000 | 0.0600 |
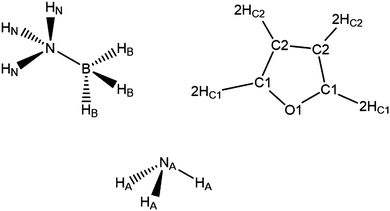 | ||
| Fig. 2 Atom labels used throughout the analysis of the EPSR simulations of AB dissolved in THF and liquid ammonia. | ||
The normalised structure factors for the AB in THF and AB in ammonia experiments are shown in Fig. 3 and 4 respectively, together with the simulated EPSR fits. Scattering for Q < 2 Å−1 is dominated by the intermolecular interactions, weighted by each atom's neutron scattering length and concentration. The opposite occurs at high Q, with the intramolecular interactions dominant. The EPSR fits are of good quality, with the deviations at Q < 0.5 Å−1 caused most likely by errors in the inelasticity correction, which would explain the larger magnitude in hydrogen (rather than deuterium) rich samples.39,40
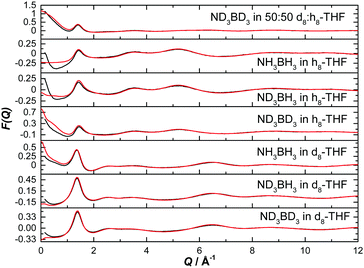 | ||
| Fig. 3 Diffraction pattern (black) and EPSR fitted structure factor (red) for various isotope combinations of ammonia borane dissolved in THF. | ||
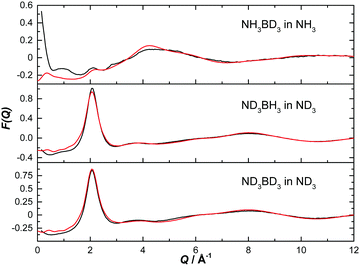 | ||
| Fig. 4 Diffraction pattern (black) and EPSR fitted structure factor (red) for various isotope combinations of ammonia borane dissolved in ammonia. | ||
The Fourier transformation of the total structure factors produces the total radial distribution functions, shown in Fig. S1 and S2 (ESI†). These show that the intramolecular bond lengths are modelled accurately in our simulations.
More specific structural information can be obtained by looking at the partial radial distribution functions (g(r), RDF) for atom pairs of interest in our systems.
2.1 Ammonia borane–ammonia borane interactions
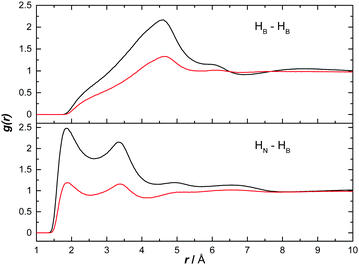
We have used the output of the EPSR simulations to study both hetero- and homopolar interactions between AB molecules. Given the likelihood for AB–AB interactions to be less rigid in solution than in the solid state (and arguably more similar to melted/dehydrogenating AB), this allows an understanding of the interactions suggested to exist during dehydrogenation.12Fig. 5 shows the partial RDF for heteropolar HN⋯HB and homopolar HB⋯HB interactions. The sharp peak at 1.85 Å in the heteropolar function suggests the presence of strong dihydrogen bonding between AB molecules. This distance is smaller than the sum of the van der Waals radii for two hydrogen atoms (2.4 Å) and characteristic of, though slightly shorter than, the dihydrogen bonding present in the solid state (2.02 Å).11,20 This structural motif appears in both ammonia and THF. In ammonia however, the magnitude of the peak is much lower suggesting AB–AB interactions are less numerous (both graphs were normalised to the bulk concentration of AB). The second peaks at 3.4 Å are not due to a second coordination shell, but the non-bonding HBs on the same AB molecule responsible for the 1.85 Å peak.
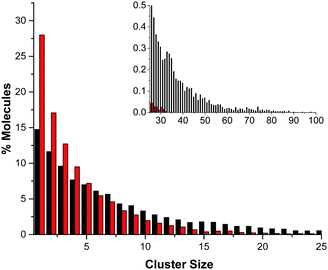
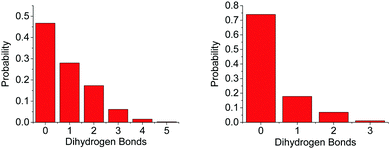
The difference in the number of AB–AB interactions between the two solvents can further be seen in an analysis of the AB–AB clustering (a cluster defined as having an HN⋯HB distance of 2.7 Å or less) present in the solutions, shown in Fig. 6. Overall 86% of the AB molecules in THF were in a cluster of size two or more, compared to 72% in liquid ammonia. This lower overall clustering in ammonia also manifested as a tendency towards smaller clusters, with the largest involving about 20 AB molecules. In THF however, larger clusters were often observed containing over 30 AB molecules. Each HN on average dihydrogen bonds to 0.701 HBs in THF, compared to only 0.438 in ammonia. This was determined from the average coordination numbers obtained by integrating the partial radial distribution functions. The results are shown in Table 2. More detailed probability distributions of the dihydrogen bonding in the first coordination shell (<2.7 Å) are shown in Fig. 7. These show that although the average coordination number is less than one, situations where multiple HNs are dihydrogen bonded to each HB are not uncommon, more so in THF than in liquid ammonia, reflecting the increased clustering.
| Atom pair | Range/Å | Average coordination number |
|---|---|---|
| HN⋯HB | 2.7 | 0.701 (AB–THF) |
| HN⋯HB | 2.7 | 0.438 (AB–NH3) |
| HN⋯O1 | 2.7 | 0.361 |
| O1⋯HN | 2.7 | 0.282 |
| HN⋯NA | 2.7 | 0.798 |
| NA⋯HN | 2.7 | 0.258 |
| HB⋯HA | 2.5 | 1.905 |
| HA⋯HB | 2.5 | 0.206 |
The lower clustering in ammonia suggests that AB–ammonia interactions are relatively favourable compared to AB–THF. This may be linked to the ability of ammonia to partially break down the polymeric structure of the waste material, redistributing the residual B–H bonds to form AB as mentioned before.18 This is a process that would be promoted by stronger AB–solvent interactions, and is not observed in THF.
In Fig. 5, the peak signifying homopolar HB⋯HB interactions does not appear until 4.5 Å. This long range suggests that there are no direct correlations in these solutions. The density observed in these functions at this distance is likely instead due to the heteropolar interactions. This suggests that the presence of D2 during the dehydrogenation of NH3BD3, as observed by Wolstenholme et al., was more likely to be a result of hydrogen scrambling than homopolar coordination.12
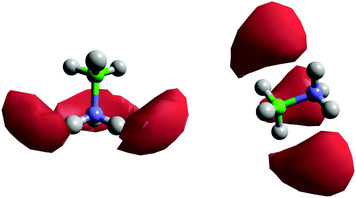
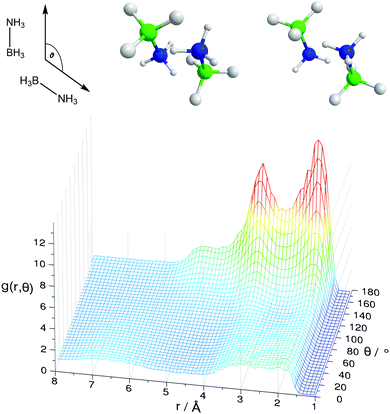
Fig. 8 shows the spatial density functions (SDF) showing where neighbouring AB molecule density is located around a central AB in ammonia (similar SDFs are seen in THF). The density is broadly located side-on to the central AB rather than end-on, and adopts the three-fold symmetry expected for intermolecular interactions primarily based on the hydrogen bonding sites. Fig. 9 shows the angular RDF for the AB–AB interactions, with θ corresponding to the angle between the AB dipole moments. The distance r is that between HN and an HB. The function shown is for AB dissolved in THF, the same function calculated in liquid ammonia (Fig. S3, ESI†) showed the same features. This implies that the only difference caused by the solvent is in the number of AB–AB interactions rather than the structure. A strong bias towards anti-parallel dipole moments is observed. The side-on configuration shown in Fig. 9 is the only configuration where (heteropolar) dihydrogen bonding and anti-parallel dipole moments can occur together. The second peak, at 3.5 Å, is assigned to the distance between HN and the other HBs on the dihydrogen bonding AB.
In the angular RDF in Fig. S4 (ESI†) with θ equal to the angle between the N–H bonds, a preference for both a parallel and anti-parallel orientation of the N–H bonds is seen. The resulting AB–AB pairs fulfilling all of the above criteria are shown in Fig. 9. The N–HN bonds point towards the B–HB bonds, rather than directly at the HBs. This structure, observed before in theoretical studies of dimers, has been suggested to be favourable by allowing the protonic hydrogen to get nearer to the relatively negative boron atom.41 As a result, it was proposed that the σ-bond itself was the acceptor in the dihydrogen bond rather than just the hydridic hydrogen.20 This may also explain how multiple dihydrogen bonds can form with a particular HB, as HNs can bond from many angles surrounding the σ bond rather than from only pointing directly at the HB (regular hydrogen bonds typically being linear, see Section 2.4).
In considering the HN density in Fig. 8 near to the nitrogen end of AB, we note that there is no close-range HN⋯HN homopolar correlation either, the peak in the partial RDF appearing at approximately 4.2 Å (Fig. S6, ESI†).
2.2 Ammonia borane–tetrahydrofuran interactions
The H to O partial RDFs for AB dissolved in THF are shown in Fig. 10. Only HN shows strong interactions to O1 with two contacts at 2.05 and 3.44 Å respectively. The first is attributed to a direct HN⋯O1 hydrogen bond while the second peak is due to a longer range interaction between the oxygen and another HN on the same nitrogen. As expected, given the hydridic nature of HB, the HB⋯O1 RDF shows only a much longer range interaction, indicated by a broad peak centred at 4.83 Å.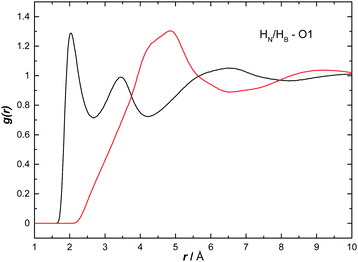 | ||
| Fig. 10 Partial radial distribution functions for HN (black) and HB (red) to O1, calculated from the EPSR fitted system, for AB dissolved in THF. | ||
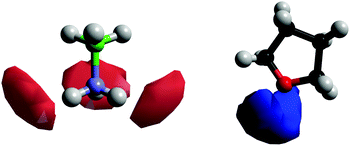
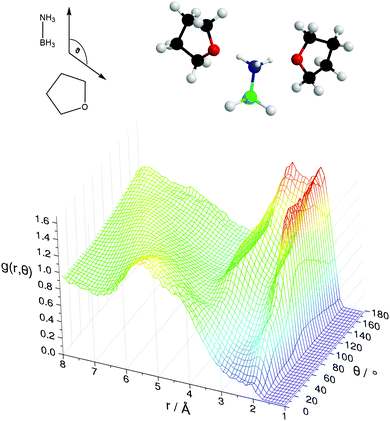
Fig. 11 shows the SDFs plotting the regions of highest probability density around the AB and THF in which the other molecule is located. These show that the density is centred around the hydrogen bonding sites O1 and HN. Fig. 12 shows the angular RDF, where the angle θ is that between the AB and THF dipoles, and the distance r is that between HN and O1. A roughly equal, high probability is seen for orientations with θ between 90 and 180°. Together with the SDFs and other angular RDFs (Fig. S7–S9, ESI†), we can determine that THF occupies a range around the nitrogen end of AB, with O1 always pointing at HN. This can involve a disruption of the usual tendency for pairs to align with anti-parallel dipole moments, which speaks to the strength of the hydrogen bonding interactions. It could also be a result of the increased degree of disorder present in liquid samples.
On average, each HN coordinates to 0.361 O1s, suggesting it is about twice as likely for an AB (via HN) to bond to another AB (0.701) than to a THF molecule. A more detailed distribution of the AB–THF coordination is shown in Fig. 13, which also shows that it is much less likely for each HN to be within hydrogen bonding distance of more than one O1, than with multiple HBs (Fig. 7). Looking at the distribution of HNs around O1s also reveals that the THF oxygen can be within hydrogen bonding range of two HNs at once, suggesting that both of the oxygen non-bonding electron pairs could be involved in hydrogen bonding at the same time.
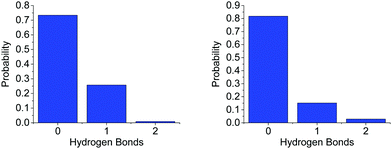 | ||
| Fig. 13 Probability distribution of (left) the number of O1s in hydrogen bonding distance (<2.7 Å) to each HN and (right) the number of HNs around O1, for the model of AB dissolved in THF. | ||
2.3 Ammonia borane–ammonia interactions
Fig. 14 shows the AB H to ammonia NA and HA partial RDFs. HA predominantly interacts with HB, as can be seen by the defined peak at 1.98 Å. This is a slightly longer dihydrogen bond than the corresponding bond between two ABs (HN⋯HB, 1.9 Å), suggesting it may be weaker. HN, however, does not seem to dihydrogen bond directly with HA, the ‘shoulder’ peak at 2.7 Å instead likely due to AB bonded via the HB, as was observed in Ricci et al.42 The opposite was determined for bonding to NA, with HN showing a clear peak at 2.19 Å. HB however does not show any bonding to NA before the first peak at 2.88 Å, likely again caused by bonding to the other end of AB. The extra dihydrogen bonding interactions observed between AB and ammonia, and not present in THF, are likely responsible for the large difference in solubilities.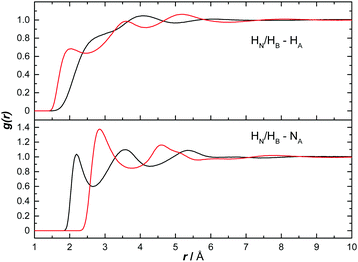 | ||
| Fig. 14 Partial radial distribution functions for HN (black) and HB (red) to HA as well as to NA, calculated from the EPSR fitted system, for AB dissolved in liquid ammonia. | ||
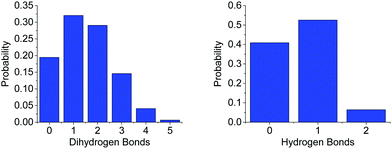
The average first shell (<2.5 Å) coordination number of NA around HN, and of HA around HB is 0.798, and 1.905 respectively. The latter is remarkably high, possibly due to the large number of HAs in the system compared to NAs. Something of note though in comparing to THF, is the effective doubling of the average coordination number of O1 around HN (0.361) in regards to NA. While it is likely this is at least partly due to the higher concentration of AB in ammonia, the smaller size of the ammonia molecule may also make it less sterically unfavourable for multiple HNs on an AB to be coordinated. Fig. 15 shows the more detailed analysis of the coordination, which reveals just how frequently HB⋯HA dihydrogen bonds occur. As many as five HAs were observed to be within dihydrogen bonding distance of one HB, eclipsing the coordination observed in THF. The coordination is also weighted more towards one or two bonds rather than zero as was observed in the AB–AB coordination in THF.
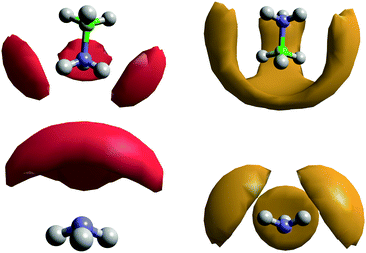
The SDFs for AB–ammonia pairs are shown in Fig. 16. The density around AB largely mirrors that seen in the previous pairs, a three-fold symmetrical pattern of density around the HNs, and between the HBs. In this case, the lobes of density between the HBs also extend down to meet end-on to the boron atom, unlike in the AB–AB pair. This could reflect the extreme prevalence of HB⋯HA dihydrogen bonds, and the smaller size of the ammonia molecule relative to AB enabling it to bond from positions where the larger AB could not. This large volume of probability density may also be the reason that a coordination number as high as 5 can be observed, albeit very rarely. The location of the probability density being between the HBs rather than pointing at them again highlights that it is the B–HB σ bond that is acting as the dihydrogen bond acceptor.
The angular RDFs were split into those calculated based on HN⋯NA, and HB⋯HA interactions. These are shown in Fig. S10 and S11 (ESI†) respectively. Orientations that satisfy the ARDFs and the SDFs, are shown in Fig. 17. The additional angular RDFs needed to narrow down the most probable orientations are shown in Fig. S12 and S13 (ESI†).
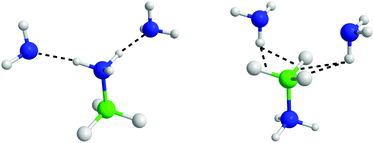 | ||
| Fig. 17 AB–ammonia orientations that satisfy the spatial density functions and angular radial distribution functions. | ||
2.4 Directionality of dihydrogen bonding in solution
The hydrogen and dihydrogen bonding angles X–H⋯Y observed throughout the simulations, where X is the hydrogen bond donor and Y the acceptor, were determined with the resulting probability distributions shown in Fig. 18. All the interactions are predominantly linear, matching what would be expected for hydrogen bonds.1 The dihydrogen bonds however, show wider peaks than the regular hydrogen bonds, indicating more flexibility. This could reflect a slightly weaker bond, or be a product of the larger number of these interactions forcing some to adopt a less ideal orientation. The other angles XH⋯Y–A, where A is an atom covalently bound to Y, were also determined and shown in Fig. 19. The peaks are much wider for these angles, reflecting less rigidity. The HN⋯HB–B angle however predominantly appears at 90°. This is due to the dihydrogen bond acceptor formally being the HB–B σ bond rather than just the hydridic hydrogen, as was seen in the SDF (Fig. 8). For the HA⋯HB–B dihydrogen bond, a slightly larger angle of 110° is seen. This may be due to HN having a slightly more positive charge than HA, and therefore experiencing a stronger attraction to the electron density in the σ bond.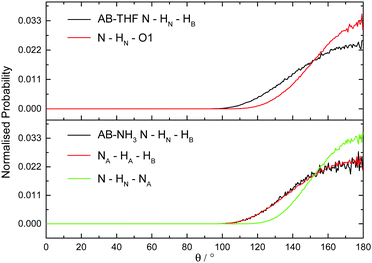 | ||
| Fig. 18 Normalised probability distributions for the angle X–H⋯YA, where X is the hydrogen bond donor and Y the acceptor, in (top) AB dissolved in THF and (bottom) AB dissolved in liquid ammonia. | ||
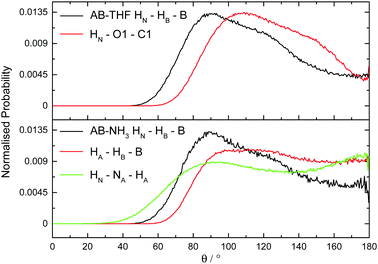 | ||
| Fig. 19 Normalized probability distributions for the angle A–Y⋯HX, where Y is the hydrogen bond acceptor and X the donor, in (top) AB dissolved in THF and (bottom) AB dissolved in liquid ammonia. | ||
Analysing the angles of the (di)hydrogen bonds also enables us to distinguish these from other intermolecular interactions (such as van der Waals forces). Fig. S14 (ESI†) shows the angular distribution for the non-(di)hydrogen bonding B–HB⋯HB. The distribution is very flat, with the reduction in probability at <120° likely due to steric reasons. This is very different to what we see in the (di)hydrogen bonds, which all seem to show directionality.
2.5 Comparison of ammonia borane–ammonia results to a theoretical approach
After observing that (di)hydrogen bonding to both ends of the AB molecule by ammonia was occurring, the possibility was raised that a single ammonia could bond to both ends of the same AB. Indeed in theoretical studies run on systems of AB dissolved in ammonia by Kar and Scheiner, their fully relaxed AB–NH3 dimer (Fig. 20) showed HN⋯NA hydrogen bonding as well as HA dihydrogen bonding to two HBs.43 Looking for pairs where (di)hydrogen bonding occurs on both ends of an AB molecule to one NH3 in our empirically refined simulation showed that this occurred 32% of the time (out of all bonding pairs). Dihydrogen bonding was determined by the atom pairs satisfying distance constraints of <2.7 Å for HN⋯NA and <2.5 Å for HB⋯HA. These constraints were chosen to include the full breadth of the corresponding peak in the partial RDFs. Angular constraints were not included as any orientation which involves bonding to both sides of the AB would be radically different to what we saw in the prior analysis. Searching specifically for the bonding pattern in the theoretically optimised dimer (one HA dihydrogen bonding to two HBs, and NA hydrogen bonding to one HN), showed it as present only 4.2% of the time. The average geometric parameters were also quite different (HN⋯NA lit. 1.993 Å, exp. 2.455 Å; HA⋯HB lit. 2.495 Å, exp. 2.155 Å; N–HN⋯NA lit. 150.4°, exp. 130.3°; HA⋯HB–B lit. 88.6°, exp. 86.9°).43 The closest match was the last angle, which the authors claimed to show energy minima at 100 and 180°; in this work we see broad corresponding probability peaks at about 90 and 180° (Fig. 19). The broadness of the peaks and the relatively small differences between experimental and theoretical results reflects the disordered nature of the liquid samples. The theoretical model also only had to minimise the energy of two molecules, while in the liquid multiple interactions had to be globally minimised. The chelate effect would suggest that solvation structures where one ammonia bonds to both ends of AB would be favoured, considering the increase in entropy gained from displacing other ammonia molecules. Nevertheless the probabilities were quite low, this may be because such orientations diverge from the most favourable angles (Fig. S10 and S11, ESI†); the multiply bonded pairs have HA–NA running parallel to the AB dipole rather than anti-parallel.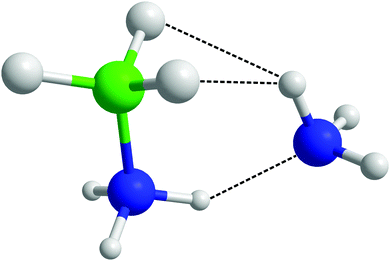 | ||
| Fig. 20 Theoretically optimised AB–ammonia dimer in which bonding to both sides of the AB molecule from one ammonia is observed.43 | ||
3 Conclusions
The solvation structure of AB by THF and liquid ammonia has been determined via refinement of a Monte Carlo simulation to neutron diffraction data, constrained by complementary data sets of isotopically substituted samples. The large capacity of AB to hydrogen bond was found to dominate the solute–solvent interactions. In THF, hydrogen bonding via the oxygen was usually observed to happen only once per THF, with instances where both non-bonding electron pairs were involved occurring five times less frequently. The low number of hydrogen bonds formed with THF, along with the larger and more rigid size relative to another AB, caused AB–AB contacts to be favoured over AB–THF. This manifested as a noticeable increase in AB clustering.The extreme solubility of AB in liquid ammonia could then be seen in the sheer number of (di)hydrogen bonds formed on average between AB and ammonia. The first shell coordination number of NA around HN was more than double that of the THF oxygen around HN. This could be due to the increased availability of the nitrogen lone pair compared to the oxygen non-bonding electron pairs. The HB⋯HA dihydrogen bond in particular was prevalent, with a coordination number roughly 2.5 times greater than even NA around HN. This also came with a relative decrease in AB clustering.
The structure of the dihydrogen bonding between AB and either ammonia or another AB in solution was determined to be very directional, with the N–HN/A⋯HB angle centred around 180°. This was still slightly less rigid than regular hydrogen bonds. The frequency of these interactions was attributed to the preference for a 90° HN/A⋯HB–B angle, which enabled the bonding to occur from a much larger volume of space surrounding each HB. This may also be the reason for the lower rigidity of N–HN/A⋯HB, as some distortion of the linearity to point towards the B–HB σ bond would be expected.
The fact that ammonia can hydrogen bond to both ends of the AB molecule undoubtedly leads to an increased solubility of AB compared to in THF. In comparing to AB–AB contacts however, which can also occur on both ends of the molecule, AB–ammonia contacts were still preferred. We determined this could be due to the smaller size of the ammonia molecule opening up new volumes of space in which hydrogen bonding could occur from. This was mainly observed in an end-on position next to the AB boron.
It is the combination of these factors that cause the high solubility of AB in liquid ammonia. An interesting test would be to study in a similar way the solvation structure of AB in water, as water also has a small size and could bond to both ends of AB. The solubility in water (33.6 g AB per 100 g solvent) however is more similar to that in THF (25 g AB) than ammonia (260 g AB).11 This could perhaps place more weight on the availability of the lone pair as well as the number of hydrogens involved in terms of factors contributing to solubility. It could also be possible that the three-fold symmetry of the ammonia is complementary to the AB symmetry, and enables a larger degree of dihydrogen bonding between the two.
In terms of implications towards AB regeneration, the sheer favourability in ammonia of the HB⋯HA dihydrogen bonds may be the reason for the observed B–H bond redistribution in AB waste treated with ammonia.18 Typically, the reduction of BX3 (X = O, S, or halide) to BH3 is the highest energy step in regeneration. In ammonia however, the formation of BH3 would be stabilised by the numerous dihydrogen bonds formed with the HAs, making the reduction more facile. Ammonia can also stabilise the formation of AB via interacting with the other end of the molecule through a regular hydrogen bond. This is the only interaction possible in other coordinating solvents like THF and other ethers, which lack the multitude of partially positive hydrogens ammonia has and therefore cannot stabilise BH3. An example of a different solvent that does is water, but that raises issues in terms of incompatibility with reducing agents like sodium borohydride, that ammonia does not have. This explains the relative success of regeneration processes in ammonia, and suggests that any energetically efficient regeneration would be wise to use it as a solvent.
4 Experimental
11B enriched ammonia borane was synthesised following the procedure described in Ramachandran and Gagare.4411B enriched sodium borohydride and borodeuteride were sourced from Katchem, ammonium sulfate from Alfa Aesar, and the THF from Sigma-Aldrich. Deuteration of the nitrogen hydrogens was achieved by dissolving in D2O and removing the solvent under reduced pressure three times. All the chemicals were used as received without further purification. For the neutron scattering experiments, the THF and ammonia were both sourced from Sigma-Aldrich and again used without further purification.The neutron scattering experiments were run on the Small Angle Neutron Diffractometer for Amorphous and Liquid Samples (SANDALS) beamline at the spallation neutron source ISIS, at the Rutherford Appleton Laboratory, Didcot, UK.45 The neutron diffraction patterns of ND3BD3, NH3BH3 and ND3BH3 were measured dissolved in THF and THF-d8, as well as ND3BD3 in a mixture of 50![[thin space (1/6-em)]](https://www.rsc.org/images/entities/char_2009.gif) :
:![[thin space (1/6-em)]](https://www.rsc.org/images/entities/char_2009.gif) 50 THF
50 THF![[thin space (1/6-em)]](https://www.rsc.org/images/entities/char_2009.gif) :
:![[thin space (1/6-em)]](https://www.rsc.org/images/entities/char_2009.gif) THF-d8. The ND3BD3 in THF-d8 sample was 12 wt% AB, with the other samples in the same mole ratio. For the ammonia experiments, less combinations were possible due to exchanging of the ammonia protons with the AB N–Hs. ND3BD3 and ND3BH3 were dissolved and measured in ND3 along with NH3BD3 in NH3. The ND3BD3 in ND3 sample was 20 wt% AB, with the other samples in the same mole ratio.
THF-d8. The ND3BD3 in THF-d8 sample was 12 wt% AB, with the other samples in the same mole ratio. For the ammonia experiments, less combinations were possible due to exchanging of the ammonia protons with the AB N–Hs. ND3BD3 and ND3BH3 were dissolved and measured in ND3 along with NH3BD3 in NH3. The ND3BD3 in ND3 sample was 20 wt% AB, with the other samples in the same mole ratio.
The samples in THF were prepared under an inert atmosphere before being sealed in a cell made of a null-scattering titanium/zirconium alloy. The cell had a flat-plate geometry facing the neutron beam to reduce multiple scattering and absorption.39 The diffraction pattern was measured at room temperature, monitored by a thermocouple, and the length of each experiment was approximately 8 hours. The samples in ammonia were measured in the same cell at 220 K, with the ammonia being condensed directly into the cell. The data correction method followed was that implemented by the Gudrun program.46 This involved taking a background measurement of the empty instrument, the empty sample cell, and an incoherently scattering vanadium slab. Gudrun was also used to correct for the inelastic self-scattering using ‘top-hat’ deconvolution and an iterative method before the analysis by EPSR.40,47 Analysis of the final simulation box after EPSR was performed using the dlputils software.48
Conflicts of interest
There are no conflicts to declare.Acknowledgements
The authors thank the EPSRC (EP/L504889/1) and Cella Energy for funding, as well as the ISIS Neutron Scattering Facility for beamtime allocations RB1610270 and RB1610293 on SANDALS. We also thank Prof. Alan Soper for assistance with the THF EPSR simulation.References
- E. Arunan, G. R. Desiraju, R. A. Klein, J. Sadlej, S. Scheiner, I. Alkorta, D. C. Clary, R. H. Crabtree, J. J. Dannenberg, P. Hobza, H. G. Kjaergaard, A. C. Legon, B. Mennucci and D. J. Nesbitt, Pure Appl. Chem., 2011, 83, 1619–1636 CrossRef CAS.
- N. V. Belkova, L. M. Epstein, O. A. Filippov and E. S. Shubina, Chem. Rev., 2016, 116, 8545–8587 CrossRef CAS PubMed.
- S. C. Gatling and J. E. Jackson, J. Am. Chem. Soc., 1999, 121, 8655–8656 CrossRef CAS.
- X. Chen, J.-C. Zhao and S. G. Shore, Acc. Chem. Res., 2013, 46, 2666–2675 CrossRef CAS PubMed.
- D. G. Allis, M. E. Kosmowski and B. S. Hudson, J. Am. Chem. Soc., 2004, 126, 7756–7757 CrossRef CAS PubMed.
- W. J. Shaw, M. Bowden, A. Karkamkar, C. J. Howard, D. J. Heldebrant, N. J. Hess, J. C. Linehan and T. Autrey, Energy Environ. Sci., 2010, 3, 796 CAS.
- S. M. Kathmann, C. J. Mundy, G. K. Schenter, T. Autrey, P. C. Aeberhard, B. David, M. O. Jones and T. Ramirez-Cuesta, J. Phys. Chem. C, 2012, 116, 5926–5931 CAS.
- K. M. Dreux, L. E. McNamara, J. T. Kelly, A. M. Wright, N. I. Hammer and G. S. Tschumper, J. Phys. Chem. A, 2017, 121, 5884–5893 CrossRef CAS PubMed.
- K. P. Vijayalakshmi and C. H. Suresh, J. Phys. Chem. A, 2017, 121, 2704–2714 CrossRef CAS PubMed.
- P. L. A. Popelier, J. Phys. Chem. A, 1998, 102, 1873–1878 CrossRef CAS.
- F. H. Stephens, V. Pons and R. Tom Baker, Dalton Trans., 2007, 2613 RSC.
- D. J. Wolstenholme, K. T. Traboulsee, Y. Hua, L. A. Calhoun and G. S. McGrady, Chem. Commun., 2012, 48, 2597 RSC.
- A. D. Sutton, B. L. Davis, K. X. Bhattacharyya, B. D. Ellis, J. C. Gordon and P. P. Power, Chem. Commun., 2010, 46, 148–149 RSC.
- A. D. Sutton, A. K. Burrell, D. A. Dixon, E. B. Garner, J. C. Gordon, T. Nakagawa, K. C. Ott, J. P. Robinson and M. Vasiliu, Science, 2011, 331, 1426–1429 CrossRef CAS PubMed.
- C. Reller and F. O. R. L. Mertens, Angew. Chem., Int. Ed., 2012, 51, 11731–11735 CrossRef CAS PubMed.
- Y. Tan, L. Zhang, X. Chen and X. Yu, Dalton Trans., 2015, 44, 753–757 RSC.
- O. T. Summerscales and J. C. Gordon, Dalton Trans., 2013, 42, 10075 RSC.
- B. L. Davis, B. D. Rekken, R. Michalczyk, E. B. Garner, III, D. A. Dixon, H. Kalviri, R. T. Baker and D. L. Thorn, Chem. Commun., 2013, 49, 9095 RSC.
- C. H. Giammanco, P. L. Kramer and M. D. Fayer, J. Phys. Chem. B, 2015, 119, 3546–3559 CrossRef CAS PubMed.
- R. Custelcean and J. E. Jackson, Chem. Rev., 2001, 101, 1963–1980 CrossRef CAS PubMed.
- R. Hayes, S. Imberti, G. G. Warr and R. Atkin, Angew. Chem., Int. Ed., 2013, 52, 4623–4627 CrossRef CAS PubMed.
- R. Hayes, S. A. Bernard, S. Imberti, G. G. Warr and R. Atkin, J. Phys. Chem. C, 2014, 118, 21215–21225 CAS.
- R. J. Gillams, J. V. Busto, S. Busch, F. M. Goñi, C. D. Lorenz and S. E. McLain, J. Phys. Chem. B, 2015, 119, 128–139 CrossRef CAS PubMed.
- A. J. Johnston, Y. R. Zhang, S. Busch, L. C. Pardo, S. Imberti and S. E. McLain, J. Phys. Chem. B, 2015, 119, 5979–5987 CrossRef CAS PubMed.
- H. J. Jiang, S. Imberti, R. Atkin and G. G. Warr, J. Phys. Chem. B, 2017, 121, 6610–6617 CrossRef CAS PubMed.
- D. T. Bowron and K. J. Edler, Langmuir, 2017, 33, 262–271 CrossRef CAS PubMed.
- M. Falkowska, D. T. Bowron, H. G. Manyar, C. Hardacre and T. G. A. Youngs, ChemPhysChem, 2016, 17, 2043–2055 CrossRef CAS PubMed.
- A. Soper, Chem. Phys., 1996, 202, 295–306 CrossRef CAS.
- A. Soper, Mol. Phys., 2001, 99, 1503–1516 CrossRef CAS.
- A. K. Soper, Phys. Rev. B: Condens. Matter Mater. Phys., 2005, 72, 104204 CrossRef.
- I. J. Chen, D. Yin and A. D. MacKerell, J. Comput. Chem., 2002, 23, 199–213 CrossRef CAS PubMed.
- B. Zhong, L. Song, X. X. Huang, L. Xia and G. Wen, Phys. Scr., 2012, 86, 015606 CrossRef.
- J. Gao, X. Xia and T. F. George, J. Phys. Chem., 1993, 97, 9241–9247 CrossRef CAS.
- W. L. Jorgensen, D. S. Maxwell and J. Tirado-Rives, J. Am. Chem. Soc., 1996, 118, 11225–11236 CrossRef CAS.
- R. C. Rizzo and W. L. Jorgensen, J. Am. Chem. Soc., 1999, 121, 4827–4836 CrossRef CAS.
- M. L. P. Price, D. Ostrovsky and W. L. Jorgensen, J. Comput. Chem., 2001, 22, 1340–1352 CrossRef CAS.
- E. K. Watkins and W. L. Jorgensen, J. Phys. Chem. A, 2001, 105, 4118–4125 CrossRef CAS.
- G. A. Kaminski, R. A. Friesner, J. Tirado-Rives and W. L. Jorgensen, J. Phys. Chem. B, 2001, 105, 6474–6487 CrossRef CAS.
- T. F. Headen, C. A. Howard, N. T. Skipper, M. A. Wilkinson, D. T. Bowron and A. K. Soper, J. Am. Chem. Soc., 2010, 132, 5735–5742 CrossRef CAS PubMed.
- A. Soper, Mol. Phys., 2009, 107, 1667–1684 CrossRef CAS.
- T. Richardson, S. de Gala, R. H. Crabtree and P. E. M. Siegbahn, J. Am. Chem. Soc., 1995, 117, 12875–12876 CrossRef CAS.
- M. A. Ricci, M. Nardone, F. P. Ricci, C. Andreani and A. K. Soper, J. Chem. Phys., 1995, 102, 7650–7655 CrossRef CAS.
- T. Kar and S. Scheiner, J. Chem. Phys., 2003, 119, 1473–1482 CrossRef CAS.
- P. V. Ramachandran and P. D. Gagare, Inorg. Chem., 2007, 46, 7810–7817 CrossRef CAS PubMed.
- C. Benmore and A. Soper, The SANDALS Manual, 1998.
- A. K. Soper, GudrunN and GudrunX Manual, 2012.
- A. K. Soper, ISRN Phys. Chem., 2013, 2013, 1–67 CrossRef.
- T. G. A. Youngs, dlputils: Calculate Properties from Molecular Dynamics Trajectories, accessed July 2017, https://www.projectaten.com/dlputils.
Footnote |
| † Electronic supplementary information (ESI) available. See DOI: 10.1039/c7cp08220g |
| This journal is © the Owner Societies 2018 |

