 Open Access Article
Collective thermal transport in pure and alloy semiconductors
Pol
Torres
 *a,
Amr
Mohammed
b,
Àlvar
Torelló
a,
Javier
Bafaluy
a,
Juan
Camacho
 a,
Xavier
Cartoixà
c,
Ali
Shakouri
b and
F. Xavier
Alvarez
a
aDepartament de Física, Universitat Autònoma de Barcelona, 08193 Bellaterra, Catalonia, Spain. E-mail: pol.torres@uab.cat
bBirck Nanotechnology Center, Purdue University, West Lafayette, Indiana 47907, USA
cDepartament d’Enginyeria Electrònica, Universitat Autònoma de Barcelona, 08193 Bellaterra, Catalonia, Spain
First published on 26th February 2018
Abstract
Conventional models for predicting thermal conductivity of alloys usually assume a pure kinetic regime as alloy scattering dominates normal processes. However, some discrepancies between these models and experiments at very small alloy concentrations have been reported. In this work, we use the full first principles kinetic collective model (KCM) to calculate the thermal conductivity of Si1−xGex and InxGa1−xAs alloys. The calculated thermal conductivities match well with the experimental data for all alloy concentrations. The model shows that the collective contribution must be taken into account at very low impurity concentrations. For higher concentrations, the collective contribution is suppressed, but normal collisions have the effect of significantly reducing the kinetic contribution. The study thus shows the importance of the proper inclusion of normal processes even for alloys for accurate modeling of thermal transport. Furthermore, the phonon spectral distribution of the thermal conductivity is studied in the framework of KCM, providing insights to interpret the superdiffusive regime introduced in the truncated Lévy flight framework.
Over the past years, thermal conductivity of a large number of bulk materials has been accurately calculated using phenomenological1,2 and ab initio3–6 techniques. Proper inclusion of normal (N) processes (i.e. momentum conserving phonon collisions) in the calculations has played a key role. This procedure has allowed probing new transport regimes like hydrodynamic heat flow or collective behavior in samples where N processes are important.7,8
Despite of the level of accuracy achieved, there are still some open questions. On one hand, although it is well known that size effects reduce the thermal conductivity, this reduction can not be fully explained from pure kinetic models, which only account for the resisitve scattering mechanisms (Umklapp (U), boundary, mass defect), without the introduction of new fitting parameters. Current models require modifying the relaxation times expressions typically used for the bulk material or including new scattering mechanisms.9,10 On the other hand, it is widely known that alloying is also a successful strategy for thermal conductivity reduction. However, precise calculations of thermal transport at small alloy concentrations remain unexplored. All this hinders the interpretation of spectral information in terms of characteristic lengths and times resolved in ultrafast heating phenomena observed in experiments such as Time Domain and Frequency Domain Thermoreflectance (TDTR/FDTR).11
The Kinetic Collective Model (KCM)1,2 offers a natural framework to understand the role of N processes in thermal transport. In this model, a collective mechanism is introduced as a result of the N scattering processes, where all the phonons share a unique value for the resistive relaxation time.1,2,6 Unlike Relaxation Time Approximation (RTA) models, KCM does not treat the N processes as resistive (R) processes. Instead, KCM uses N processes to calculate the relative weight between collective and kinetic contributions. This approach is in accordance with Peierls’ initial work where the non-resistive nature of N scattering was demonstrated.12 While other recently developed methods, such as full-BTE solutions (iterative method,13 the relaxon solution14 and the direct solution15), also capture the effects of collective contributions, obtaining physical insight from the computed results is harder due to the heavy numerical character of these approaches. In addition, it is hard for these methods to go from bulk to the nanoscale.6 On the other hand, the formalism underlying KCM makes it easier to develop more accurate predictions of the thermal conductivity and how it is enhanced or reduced at small scales or lower dimensions.
In the present work, we focus on the role played by N scattering on alloys. On the one hand, we show that some difficulties in predicting pure and alloy experimental thermal conductivities with the same model are explained by the reduction of the collective contribution as impurity increases due to the enhancement of resistive effects caused by alloying. In these cases, trying to fit the thermal conductivity with RTA for high alloy concentrations, the value for pure materials is underestimated,†![[thin space (1/6-em)]](https://www.rsc.org/images/entities/char_2009.gif) 16 as the collective contribution is neglected. On the other hand, even when the collective contribution is negligible and thermal transport is dominated by resistive collisions, N scattering is shown to significantly slow down kinetic transport. We also propose that the presence of a collective regime could offer a basis to explain the significant differences in the frequency behaviour between alloy and pure materials in frequency domain termoreflectance (FDTR) experiments.11
16 as the collective contribution is neglected. On the other hand, even when the collective contribution is negligible and thermal transport is dominated by resistive collisions, N scattering is shown to significantly slow down kinetic transport. We also propose that the presence of a collective regime could offer a basis to explain the significant differences in the frequency behaviour between alloy and pure materials in frequency domain termoreflectance (FDTR) experiments.11
We study two well-known and extensively used thermoelectric and optoelectronic alloys, Si1−xGex and InxGa1−xAs. Such materials have a diamond/zincblende-like structure, with a Si1−xGex and InxGa1−x atom in the (0,0,0) position and Si1−xGex and As at (1/2,1/2,1/2) respectively. First principles KCM calculations at several germanium and indium concentrations x are performed in each case.
The total lattice thermal conductivity κT is formulated in KCM model as the sum of the kinetic κk and the collective κc terms (κT = κk + κc):6,18
 | (1) |
 | (2) |
 | (3) |
 , since it is corrected through the (1 − Σ) factor as a consequence of normal collisions, i.e. kk = (1 − Σ)
![[k with combining circumflex]](https://www.rsc.org/images/entities/i_char_006b_0302.gif) k.
k.
In order to compute the properties of the alloys, the phonon dispersion relations and the relaxation times are needed. To obtain the dispersion relations for a stoichiometry x, we perform lattice dynamics calculations within the Virtual Crystal Approximation (VCA) in a first principles framework.19 Calculations were done with the Quantum ESPRESSO package,20 under the Density Functional Theory (DFT),21,22 and the Local Density Approximation (LDA) in the parameterization of Perdew and Zunger.23 Plane waves from norm-conserving pseudopotentials of the von Barth–Car type24,25 were cut off at an energy of 60 Rydberg. Born effective charges have been considered for the polar compounds. At each composition x, the lattice parameter was adjusted until the pressure was less than 0.1 kbar. Solution of the ensuing dynamical matrix provides the dispersion relations and transport parameters. As the shape of the dispersion relations depends on the crystal structure and atomic masses, their shape will be very similar to that of their constituent materials.26,27
For the above materials, four different relaxation times should be considered. The resisitve scattering terms, which contribute to the total resistivity, are arranged in the kinetic MFP using the Mathiessen's rule
 | (4) |
τB = Leff/v![[thin space (1/6-em)]](https://www.rsc.org/images/entities/char_2009.gif) , , | (5) |
 for rods, where l1 and l2 are the rod thickness and width.1
Umklapp and normal scattering rates are computed from first principles calculations for natural silicon and gallium arsenide. For Si1−xGex alloys, such calculations have been carried in the VCA for x = 0.0025, 0.004, 0.01, 0.04, 0.1, 0.18, 0.2, 0.4, 0.5, 0.82 and for InxGa1−xAs at x = 0.01, 0.15, 0.3, 0.53 compositions. Interpolation has been used in the latter case for smaller and intermediate concentrations.
Regarding impurity scattering, the mass defect term describes the variability in isotopic abundance for single-species crystals, but in alloys it should also account for the variability in the force and lattice constants. Thus, including these three factors, the total alloy relaxation time can be expressed as:33
 | (6) |
 | (7) |
Fig. 1 shows the KCM prediction of the thermal conductivity and the weighting factor Σ for Si1−xGex and InxGa1−xAs rods at 300 K. One observes that theoretical predictions (black lines) agree with experimental data for Si1−xGex. For InxGa1−xAs we note inconsistencies between old published bulk experimental data,28,35 reporting values smaller than 5 W m−1 K−1, and recent 1.6 μm thin films measurements of 5.5 W m−1 K−1 for In0.53Ga0.47As at 300 K.36 Therefore bulk values are expected to be higher than 5.5 W m−1 K−1. Note that collective thermal transport (red region) is only important for very pure materials close to x = 0, being mostly destroyed with impurity fractions as low as 0.4% and 4% for Si1−xGex and InxGa1−xAs respectively.
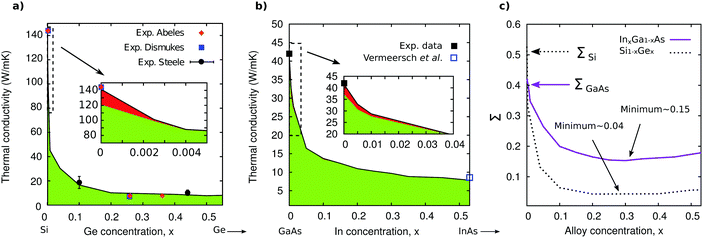 | ||
| Fig. 1 Thermal conductivity of Leff = 7 mm rods in terms of alloy concentration x at 300 K for (a) Si1−xGex and (b) InxGa1−xAs. Green and red filled zones denote the kinetic and collective contributions to the thermal conductivity respectively. Black solid lines denote the total thermal conductivity. Insets represent magnifications at low impurity concentrations. (c) Switching factor Σ corresponding to (a) and (b) showing the transition to a kinetic-dominant regime as impurity increases. Experimental data for Si1−xGex are from ref. 28–30. GaAs experimental datum is taken from ref. 17 and for In0.53Ga0.47A from ref. 31. | ||
From the insets it can be appreciated that although the kinetic contribution can describe most of the concentration range, it is not able to explain the conductivity near the pure region x ∼ 0, where the collective term contributes up to a 10% of the thermal conductivity.16 It is the correct treatment of N processes, as done by KCM or iterative and full solution methods, that provides good predictions at all concentrations. These results show that a proper description of the collective contribution is necessary to understand the large drop in thermal conductivity at small impurity concentrations. In the case of InxGa1−xAs, it is visible that the reduction of the collective contribution when the alloy concentration is increased is not as sharp as that found in Si1−xGex. This is a consequence of the difference of the strength of the alloy scattering in each sample: the isotopic mass variation term in Si1−xGex alloys is several times larger than in InxGa1−xAs alloys. A magnitude that quantifies these differences is the Σ factor (Fig. 1c). For pure materials like Si and GaAs we found values of ΣSi ∼ 0.5 and ΣGaAs ∼ 0.4. When the alloy concentration is increased this value goes fast below 0.1 for Si1−xGex, with a minimum of ∼0.04 around Si0.7Ge0.3. In contrast, in the case of InxGa1−xAs the reduction of Σ is smoother, decreasing from 0.4 → 0.15 for In concentrations going from x = 0 → x = 0.3. Since the larger Σ the larger the collective contribution, the sharper change of Σ in Si1−xGex alloys as impurity increases translates into a sharper drop in conductivity, as displayed in Fig. 1.
A second issue to be pointed out, is that as consequence of N scattering, not only a collective contribution to thermal conductivity does appear, but it also causes the slowdown of kinetic modes. The pure kinetic term  is thus reduced by a factor (1 − Σ). Since the minimum values of Σ displayed in Fig. 1c are 0.04 for Si1−xGex and 0.15 for InxGa1−xAs, this correction amounts at least a 4% and a 15%, respectively. In general it will be more important in InxGa1−xAs than in Si1−xGex.
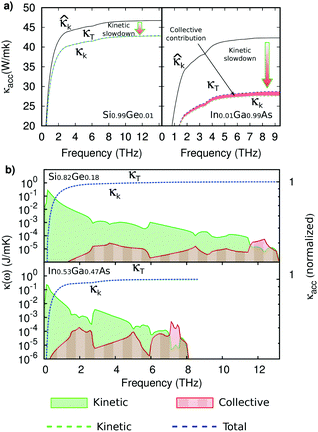
Fig. 2a displays the thermal conductivity accumulation function (TCAF) for the two alloys at x = 0.01, showing a significant slowing down of kinetic transport. This reduction of the kinetic heat transport due to N collisions is modelled in the classical RTA approach through the inclusion of N scattering as a resistive mechanism in the Mattiessen rule. The present model thus helps to understand why, when Σ is small, the RTA is expected to work. Notice that KCM offers a more general framework for accounting the effects of N scattering, namely, the reduction of kinetic transport, and the existence of a collective heat transport.
From a microscopic point of view, collective and kinetic contributions should have very different transient behaviour. This can be shown by noticing that while each mode has a different MFP in the kinetic regime, the collective MFP is the same for all of them. In Fig. 2b the phonon spectral distribution of the thermal conductivity of the two common alloy concentrations Si0.82Ge0.18 (top) and In0.53Ga0.47As (bottom) at 300 K and Leff = 7 mm are shown. The green region represents the kinetic and the red the collective contribution. Notice that, differently to a pure kinetic approach, all the contribution for the collective regime that spans the whole frequency spectrum is to be assigned to a single collective mean free path vτc.6 In pure materials like GaAs, C, Ge or Si, the collective contribution is larger than in alloys.6 This could offer an explanation of why the reduction of thermal conductivity in FDTR experiments in pure samples occurs at higher frequencies.
The transient behaviour can be explained in more detail if we combine KCM with the Truncated Lévy-flights (TL) formalism.31,37 This provides a unified description of the transition from diffusive to ballistic thermal transport in pure and alloy semiconductors. In the time domain, this transition from short to long time scales can be described by the Maxwell–Cattaneo equation:38
 | (8) |
 the diffusion equation is recovered, and in the opposite case
  we obtain the wave equation. Despite of this clear distinction, dynamics of energy transport in actual semiconductors is more complex. Eqn (8) is valid only when a single characteristic time τ can be defined from the phonon distribution. This is only possible in the collective regime, as all the modes share the same MFT. However, in the kinetic-dominated regime this is not possible as the MFT of the different phonons can span several orders of magnitude and the diffusive to ballistic transition has a different time scale for each phonon mode. TL is the generalization of the kinetic transport taking into account the broad distribution of mean free times giving rise to a fractal random walk behavior. This approach properly distinguishes interfacial dynamics from nearby quasiballistic heat flow suppression. In this framework, the effect of different time scales is captured by using the fractal exponent (α) that relates the scaling of the mean-square displacement (MSD) of thermal energy with time.39 Considering steady state, the fractal diffusivity χα in the TL model is expressed as:31
 | (9) |
Fig. 3 represents the spatial transient thermal response for Si, In0.53Ga0.47As and Si0.82Ge0.18 obtained from a TL model.31,37 It can be seen that the region with a superdiffusive behaviour with fractional exponent spans 4 orders of magnitude in time for Si0.82Ge0.18 and 3 orders for In0.53Ga0.47As. Although for Si the spatial evolution has not been reported, in the time space the transition from pure ballistic to diffusive regime seems to be gradual without a dominant fractal exponent.31 This behavior may be explained in terms of the different weight of the collective contribution Σ shown in Fig. 1c. The reasoning is the following. The fractal behavior is a kinetic phenomenon and, as the collective contribution increases, the superdiffusive transition decreases until a single scale appears in the pure collective regime. The spatial/temporal window where superdiffusive transport is observable seems to be directly related to the dominant scattering mechanisms.
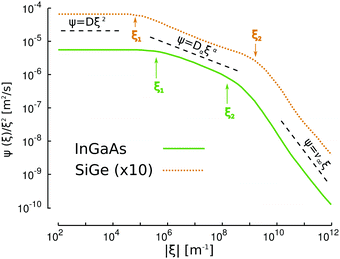 | ||
| Fig. 3 Fractal diffusivity defined from ψ(ξ)/ξ2 for In0.53Ga0.47As and Si0.82Ge0.18. Si0.82Ge0.18 curve is upscaled to ease the visualization.31 Three scaling regions with different exponents may be identified. | ||
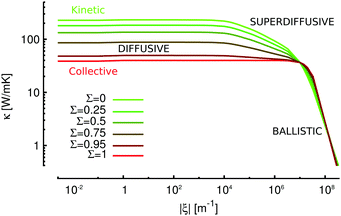
The effect of the Lévy flights reproduced from the KCM framework is represented in Fig. 4. As can be observed, while the pure kinetic regime (top green line) shows a clear superdiffusive region, in the collective regime there is a single transition scale. When the collective contribution increases (i.e. Σ increases) the fractal slope becomes smoother until it disappears for Σ = 1. Notice that the value of Σ = 0.5 corresponds approximately to silicon.
Using KCM in combination with TL to obtain the phonon MFP spectral distribution from experiments should include the collective effect in the functions used to convolute with experimental results, usually called suppression functions. The obtained function should present in this case an step function at its corresponding scale. In Fig. 5 the predicted MFP accumulation functions by KCM for Si, In0.53Ga0.47As, and Si0.82Ge0.18 are shown. The jump in cumulative thermal conductivity can be seen clearly for silicon at the MFP of ∼20 nm. In contrast, the contribution of the collective regime to thermal conductivity in the alloys is almost negligible. Accordingly, a definite slope can be observed in the thermal conductivity accumulation function (TCAF). Notice that this does not mean that N scattering is not important as kinetic slowdown is still present.
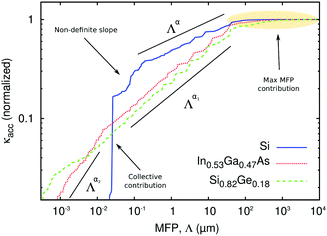 | ||
| Fig. 5 Thermal conductivity accumulation function (TCAF) of natural Si, Si0.82Ge0.18 and In0.53Ga0.47As at 300 K with Leff = 7 mm. | ||
As noticed by Vermeersch et al.,31 the slope of the accumulation function can be related to the exponent of the dominant scattering mechanism. To see this relation, Fig. 6 shows the U and impurity/alloy relaxation times for Si, In0.53Ga0.47As, and Si0.82Ge0.18. It can be observed that U scattering is dominant for silicon, which has a trend that goes from τ![[thin space (1/6-em)]](https://www.rsc.org/images/entities/char_2009.gif) ∝
∝ ![[thin space (1/6-em)]](https://www.rsc.org/images/entities/char_2009.gif) ω−3 to τ
ω−3 to τ![[thin space (1/6-em)]](https://www.rsc.org/images/entities/char_2009.gif) ∝
∝ ![[thin space (1/6-em)]](https://www.rsc.org/images/entities/char_2009.gif) ω−2, according to the first principles calculations and in agreement with Han's expressions.40 For Si0.82Ge0.18 and In0.53Ga0.47As the dominant scattering is the alloy with τ
ω−2, according to the first principles calculations and in agreement with Han's expressions.40 For Si0.82Ge0.18 and In0.53Ga0.47As the dominant scattering is the alloy with τ![[thin space (1/6-em)]](https://www.rsc.org/images/entities/char_2009.gif) ∝
∝ ![[thin space (1/6-em)]](https://www.rsc.org/images/entities/char_2009.gif) ω−4, although is stronger in Si0.82Ge0.18. This shows why both have also the same exponent in the accumulation function but with different extents of the superdiffusive region.
ω−4, although is stronger in Si0.82Ge0.18. This shows why both have also the same exponent in the accumulation function but with different extents of the superdiffusive region.
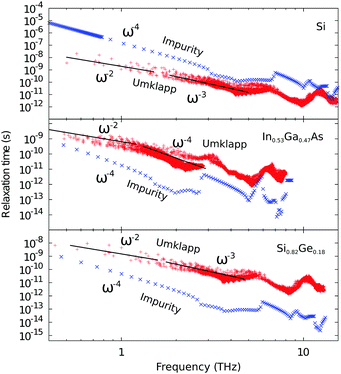 | ||
| Fig. 6 Umklapp and impurity/alloy first principles relaxation times for Si, In0.53Ga0.47As and Si0.82Ge0.18 at 300 K. | ||
In addition, from Fig. 6 it can be obtained an explanation of why the superdiffusive window is narrower for In0.53Ga0.47As than for Si0.82Ge0.18. According to Vermeersch et al.31 the fractal exponent can be defined only when the dominant relaxation time has an exponent n ≥ 3. Having a look at the dominant relaxation times, the narrowest window will correspond to silicon, where only the central part of the spectrum has n = 3. Comparing between the two alloys, it can be observed that for In0.53Ga0.47As at the left side of the plot around 0.5 THz the relaxation time with τ ∝ ω−2 starts to be important in front of τ ∝ ω−4, while for Si0.82Ge0.18 is not yet relevant. Therefore when τ ∝ ω−2 a fractal dimension is not defined. Notice that this effect can be only clarified if the low frequency relaxation times are well interpreted, as done in the present work by using Han's expressions,40 and are examined independently without considering N scattering as resistive. The effect of N scattering does not change the superdiffusive window but only its slope trough Σ as shown in Fig. 4.
In conclusion, we have analyzed the collective contribution to thermal transport in alloys, which is a consequence of the role of normal phonon scattering. First, thermal conductivity values derived from the Kinetic Collective Model for Si1−xGex and InxGa1−xAs alloys show good agreement with experimental data and previous calculations. Without introducing any fitting parameters, we have shown that the proper combination of kinetic and collective transport due to the normal processes can accurately predict thermal conductivity at low alloy concentrations. Impurity concentrations as little as 0.4% almost eliminate the collective contribution in Si1−xGex, while in InxGa1−xAs, the collective contribution is strongly reduced, but not completely removed, at 4% concentrations. This insight could be useful when addressing phenomena such as phonon drag or dopant effects in semiconductor thermoelectrics. Secondly, while the impact of collective transport on steady-state thermal conductivity of bulk alloys is negligible at most concentrations, the role of normal scattering is always important by slowing down the kinetic transport, thus reducing thermal conductivity by 4–15% at room temperature. The latter can have a big impact on the analysis of ultrafast thermal transport at small length scales. Finally, from the phonon spectral analysis, it is shown that the collective regime, where phonons share the same mean free path, narrows the time window of superdiffusive heat transport. This reduction is visible in highly pure samples such as silicon. In addition, the slope of the accumulation function can been correlated to the dominant scattering mechanism in both kinetic and collective regimes.
Conflicts of interest
There are no conflicts to declare.Acknowledgements
This work has been partially funded by the Spanish Ministerio de Economía y Competitividad under Project Nos TEC2012-31330, FIS2012-32099, MAT2012-33483, TEC2015-67462-C2-2-R (MINECO/FEDER), TEC2015-67462-C2-1-R (MINECO/FEDER), Consolider nanoTHERM CSD2010-00044 and Generalitat de Catalunya under Project 2014-SGR-0064 and 2014-SGR-384. Also, the research leading to these results has received funding from the European Union Seventh Framework Programme under grant agreement No. 604391 Graphene Flagship.References
- C. De Tomas, A. Cantarero, A. F. Lopeandia and F. X. Alvarez, J. Appl. Phys., 2014, 115, 164314 CrossRef.
- C. De Tomas, A. Cantarero, A. F. Lopeandia and F. X. Alvarez, Proc. R. Soc. A, 2014, 470, 20140371 CrossRef CAS PubMed.
- L. Lindsay, D. a. Broido and T. L. Reinecke, Phys. Rev. B: Condens. Matter Mater. Phys., 2013, 87, 165201 CrossRef.
- A. Ward and D. A. Broido, Phys. Rev. B: Condens. Matter Mater. Phys., 2010, 81, 085205 CrossRef.
- D. A. Broido, M. Malorny, G. Birner, N. Mingo and D. A. Stewart, Appl. Phys. Lett., 2007, 91, 231922 CrossRef.
- P. Torres, A. Torello, J. Bafaluy, J. Camacho, X. Cartoixà and F. X. Alvarez, Phys. Rev. B, 2016, 95, 165407 CrossRef.
- S. Lee, D. Broido, K. Esfarjani and G. Chen, Nat. Commun., 2015, 6, 6290 CrossRef CAS PubMed.
- K. M. Hoogeboom-Pot, J. N. Hernandez-Charpak, X. Gu, T. D. Frazer, E. H. Anderson, W. Chao, R. W. Falcone, R. Yang, M. M. Murnane, H. C. Kapteyn and D. Nardi, Proc. Natl. Acad. Sci. U. S. A., 2015, 112, 201503449 CrossRef PubMed.
- N. Mingo, L. Yang, D. Li and A. Majumdar, Nano Lett., 2003, 3, 1713–1716 CrossRef CAS.
- M. Kazan, G. Guisbiers, S. Pereira, M. R. Correia, P. Masri, A. Bruyant, S. Volz and P. Royer, J. Appl. Phys., 2010, 107, 083503 CrossRef.
- R. B. Wilson and D. G. Cahill, Nat. Commun., 2014, 5, 5075 CrossRef CAS PubMed.
- R. E. Peierls, Quantum Theory of Solids, Oxford University Press, 2007 Search PubMed.
- A. Ward, D. A. Broido, D. A. Stewart and G. Deinzer, Phys. Rev. B: Condens. Matter Mater. Phys., 2009, 80, 1–8 CrossRef.
- A. Cepellotti and N. Marzari, Phys. Rev. X, 2016, 6, 041013 Search PubMed.
- L. Chaput, Phys. Rev. Lett., 2013, 110, 1–5 CrossRef PubMed.
- J. Garg, N. Bonini, B. Kozinsky and N. Marzari, Phys. Rev. Lett., 2011, 106, 1–4 CrossRef PubMed.
- A. V. Inyushkin, A. N. Taldenkov, A. Y. Yakubovsky, A. V. Markov, L. Moreno-Garsia and B. N. Sharonov, Semicond. Sci. Technol., 2003, 18, 685–688 CrossRef CAS.
- P. Torres, Kinetic Collective Model: BTE-based hydrodynamic model for thermal transport, 2017, accessed August 20, 2017, https://physta.github.io/.
- L. Bellaiche and D. Vanderbilt, Phys. Rev. B: Condens. Matter Mater. Phys., 2000, 61, 7877–7882 CrossRef CAS.
- P. Giannozzi, S. Baroni, N. Bonini, M. Calandra, R. Car, C. Cavazzoni, D. Ceresoli, G. L. Chiarotti, M. Cococcioni, I. Dabo, A. Dal Corso, S. de Gironcoli, S. Fabris, G. Fratesi, R. Gebauer, U. Gerstmann, C. Gougoussis, A. Kokalj, M. Lazzeri, L. Martin-Samos, N. Marzari, F. Mauri, R. Mazzarello, S. Paolini, A. Pasquarello, L. Paulatto, C. Sbraccia, S. Scandolo, G. Sclauzero, A. P. Seitsonen, A. Smogunov, P. Umari and R. M. Wentzcovitch, J. Phys.: Condens. Matter, 2009, 21, 395502 CrossRef PubMed.
- P. Hohenberg and W. Kohn, Phys. Rev., 1964, 136, 864–871 CrossRef.
- W. Kohn and L. J. Sham, Phys. Rev., 1965, 140, A1133 CrossRef.
- J. P. Perdew and A. Zunger, Phys. Rev. B: Condens. Matter Mater. Phys., 1981, 23, 5048–5079 CrossRef CAS.
- U. von Barth and R. Car, Unpublished notes, 1977.
- R. R. A. D. Corso, S. Baroni and S. de Gironcoli, Phys. Rev. B: Condens. Matter Mater. Phys., 1993, 47, 3588–3592 CrossRef.
- G. Nilsson and G. Nelin, Phys. Rev. B: Solid State, 1972, 6, 3777–3786 CrossRef CAS.
- D. Strauch and B. Dorner, J. Phys.: Condens. Matter, 1990, 2, 1457 CrossRef CAS.
- B. Abeles, D. Beers, G. Cody and J. Dismukes, Phys. Rev., 1962, 125, 44–46 CrossRef CAS.
- J. P. Dismukes, L. Ekstrom, E. F. Steigmeier, I. Kudman and D. S. Beers, J. Appl. Phys., 1964, 35, 2899–2907 CrossRef CAS.
- M. C. Steele and F. D. Rosi, J. Appl. Phys., 1958, 29, 1517–1520 CrossRef CAS.
- B. Vermeersch, J. Carrete, N. Mingo and A. Shakouri, Phys. Rev. B: Condens. Matter Mater. Phys., 2015, 91, 085202 CrossRef.
- H. Casimir, Physica, 1938, 5, 495–500 CrossRef.
- P. G. Klemens, Proc. Phys. Soc., London, Sect. A, 1955, 68, 1113–1128 CrossRef.
- W. Capinski, H. Maris and S. Tamura, Phys. Rev. B: Condens. Matter Mater. Phys., 1999, 59, 10105–10110 CrossRef CAS.
- P. Mycock, Solid-State Electron., 1966, 10, 161–168 CrossRef.
- W. Kim, J. Zide, A. Gossard, D. Klenov, S. Stemmer, A. Shakouri and A. Majumdar, Phys. Rev. Lett., 2006, 96, 1–4 Search PubMed.
- B. Vermeersch, A. M. S. Mohammed, G. Pernot, Y. R. Koh and A. Shakouri, Phys. Rev. B: Condens. Matter Mater. Phys., 2015, 91, 085203 CrossRef.
- J. C. Maxwell, Philos. Mag., 1868, 35, 49–88 Search PubMed.
- B. Vermeersch, A. M. S. Mohammed, G. Pernot, Y. R. Koh and A. Shakouri, Phys. Rev. B: Condens. Matter Mater. Phys., 2014, 90, 1–5 CrossRef.
- Y.-J. Han, Phys. Rev. B: Condens. Matter Mater. Phys., 1996, 54, 8977–8980 CrossRef CAS.
Footnote |
| † Notice that in this case the predicted thermal conductivity for Si is ∼130 W m−1 K−1, while the current reported experimental value is ∼145 W m−1 K−1.17 |
| This journal is © the Owner Societies 2018 |

