
A study of the effectiveness and energy efficiency of ultrasonic emulsification
Wu
Li
ab,
Thomas S. H.
Leong
 abc,
Muthupandian
Ashokkumar
ab and
Gregory J. O.
Martin
*ac
abc,
Muthupandian
Ashokkumar
ab and
Gregory J. O.
Martin
*ac
aARC-ITRP Dairy Innovation Hub, The University of Melbourne, Parkville, Victoria 3010, Australia. E-mail: gjmartin@unimelb.edu.au
bSchool of Chemistry, The University of Melbourne, Parkville, Victoria 3010, Australia
cDepartment of Chemical Engineering, The University of Melbourne, Parkville, Victoria 3010, Australia
First published on 13th November 2017
Abstract
Three essential experimental parameters in the ultrasonic emulsification process, namely sonication time, acoustic amplitude and processing volume, were individually investigated, theoretically and experimentally, and correlated to the emulsion droplet sizes produced. The results showed that with a decrease in droplet size, two kinetic regions can be separately correlated prior to reaching a steady state droplet size: a fast size reduction region and a steady state transition region. In the fast size reduction region, the power input and sonication time could be correlated to the volume-mean diameter by a power-law relationship, with separate power-law indices of −1.4 and −1.1, respectively. A proportional relationship was found between droplet size and processing volume. The effectiveness and energy efficiency of droplet size reduction was compared between ultrasound and high-pressure homogenisation (HPH) based on both the effective power delivered to the emulsion and the total electric power consumed. Sonication could produce emulsions across a broad range of sizes, while high-pressure homogenisation was able to produce emulsions at the smaller end of the range. For ultrasonication, the energy efficiency was higher at increased power inputs due to more effective droplet breakage at high ultrasound intensities. For HPH the consumed energy efficiency was improved by operating at higher pressures for fewer passes. At the laboratory scale, the ultrasound system required less electrical power than HPH to produce an emulsion of comparable droplet size. The energy efficiency of HPH is greatly improved at large scale, which may also be true for larger scale ultrasonic reactors.
Introduction
In its simplest form, an emulsion is a mixture of two immiscible liquids usually consisting of an organic “oil” phase (O) and a water phase (W), in which one liquid (the dispersed phase) is in the form of microscopic droplets dispersed in the bulk (continuous) phase. Two common types of emulsions are the oil-in-water (O/W) and water-in-oil (W/O) emulsions. To stabilize the two immiscible liquids, an emulsifier is usually required to prevent spontaneous separation back into individual phases. The choice of the emulsifier is an important consideration in the emulsion formation and its long-term stability.1–3Emulsions have wide applicability in a range of fields including paints, foods, cosmetics and drugs.4–7 For many applications, the emulsion droplet size (EDS) of the disperse phase is a key factor that governs the stability, appearance and functionality of the produced emulsion. With a decrease in EDS from a size range of 0.5–100 μm (i.e., macroemulsion) to a size range of 20–200 nm (i.e., nanoemulsion), a higher kinetic stability can be achieved.6 Additionally, the size reduction process can lower the turbidity of the emulsion, potentially creating high functionality without affecting the appearance of the final product.8 The selection of appropriate equipment and processing parameters is important to enable the formation of nano-sized emulsions required for optimally designed products.
The emulsification technique is critical for achieving a nanoemulsion size range and there are many techniques available. “Low energy” emulsification methods involve either transitional or spontaneous phase inversion, which can be induced by altering the hydrophilic–lipophilic balance (HLB) of the system, or by increasing the dispersed phase volume fraction, respectively.9–11 However, there are some limitations to these “low energy” methods. For instance, the requirement for large amounts of particular combinations of surfactant is not generally practical for large-scale applications.12
The industrial production of sub-micron emulsions is primarily based on the application of high shear to disrupt and distribute a disperse phase into small droplets throughout the continuous phase. High-pressure homogenizers (HPH) are one of the most effective methods by which nanoemulsions can be formed. In these devices, a high pressure is used to drive fluid flow across very narrow valve gaps, creating extreme turbulence, cavitation, high shear and inertial forces.13 With homogenizing pressures of up to 2500 bar achievable, it is possible to create emulsions with a mean droplet diameter of less than 0.2 μm.14 HPHs are widely used in industry (e.g., dairy processing), however they require regular maintenance due to the moving parts and the susceptibility of the valves to damage. Ultrasonic systems that generate high local power densities offer an alternative to HPH systems. The physical shear and turbulence generated in ultrasonic systems originates from the phenomenon of acoustic cavitation. Due to the pressure fluctuation of the sound wave throughout the aqueous medium, gas pockets in water act as nuclei, and microbubbles can form, grow and collapse within microseconds, causing implosions at a micro-scale, providing intense localised shear forces. The cumulative effect of these microscale-implosions throughout the medium gives rise to ultrasonic emulsification.5,15–17 The high intensity of acoustic cavitation in low-frequency systems can generate several high-impact physical effects such as micro-streaming, micro-jetting and shockwaves.18–20 As a result, high turbulence and velocity gradients can be generated over very small length scales, leading to the production of nanoemulsions.8,21,22 For ultrasonic emulsification, a well-accepted mechanistic theory has been established by Li and Fogler, which involved a two-step mechanism starting from two separate phases. It was concluded that the higher the ultrasonic frequency, the more difficult it is to reach the critical amplitude of acoustic vibration required to initiate the mixing of the two separate phases.23 Further, with an increase in frequency, the radius of the cavitation bubbles decreases, resulting in less violent collapse of the bubbles, such that the physical effects (e.g. shockwaves) gradually weaken while the chemical effects (i.e. radical formation) strengthen. Therefore, low ultrasound frequencies, typically 20 kHz, are commonly used for emulsification purposes. Regardless of the technique, emulsification requires considerable energy, and it is important to understand how to maximise energy efficiency. Leong et al. have examined the correlation between the energy density (sonication energy per unit volume) and the Z-average droplet size as a function of the sonication time.8 Across various sonication setups (i.e. batch and continuous systems with different ultrasonic transducers and container designs) operated at ambient pressure, the correlation of droplet size and energy density showed a power-law index of −0.37.8 Abismaïl et al. investigated the relation between droplet size and sonication power density, ε (power input per unit volume),24 without investigating the effect of changing the processing volume. Similar measurements were reported by Gupta et al.,21,22 where three different ultrasound amplitudes were employed using the same emulsification container. These studies have demonstrated that ultrasonic systems are capable of producing emulsions spanning across a size range of submicron to nanometer scales. However, to date the kinetics of droplet size reduction have not been well studied in the context of ultrasonic systems and the maximisation of energy efficiency. A comprehensive correlation between droplet size and energy density still needs to be established based on the combination of individual parameters (i.e. power input, sonication time and processing volume).
To the best of our knowledge, there is no systematic study available in the literature that focused on correlating the EDS to various ultrasonic experimental parameters, both theoretically and experimentally. In order to fill this knowledge gap, this work aims to understand, from both theoretical and experimental viewpoints, the effect of selected experimental parameters of ultrasonic emulsification on the kinetics of EDS reduction, including sonication amplitude, residence time and processing volume using a select surfactant/oil system. Instead of using power density or energy density, the three parameters will firstly be examined independently in order to explore their individual effects in more detail. The results will be interpreted on the basis of the physics of emulsification as well as providing an empirical relationship. The energy efficiency of US emulsification will also be benchmarked against HPH.
Theoretical background
The theory around emulsification in turbulent flow was established half a century ago and a comprehensive understanding has been established on the prediction of macroemulsion droplet size as a function of power density.25–28 Two regimes of emulsification have been distinguished: the turbulent inertial and the turbulent viscous regime.28 The difference between the two regimes is the relative size of the droplets, d, to the smallest eddies, λ0. In the turbulent inertial regime, d > λ0, whereas in the turbulent viscous regime, d < λ0. The size of the smallest eddies in the turbulent flow, λ0, which is also referred to as the “Kolmogorov scale”, can be defined according to the following empirical relationship that reflects the hydrodynamic conditions during emulsification:| λ0 ≈ ε−1/4ηc−3/4ρc−3/4, | (1) |
In the turbulent inertial regime, there is a critical droplet size at which there is a balance between droplet breakup and recoalescence. The critical stable drop diameter, dcrit is expressed as follows:28
| dcrit = Cε−2/5σ3/5ρc−3/5, | (2) |
Eqn (2) gives a prediction of droplet size based on power density as d ∼ ε−0.4 for the formation of macroemulsions (0.1–5 μm) and has been widely applied in the studies of different systems such as ultrasound (US), Ultra-Turrax (UT) and HPH systems to determine the difference in energy efficiency.29 However, due to the lack of time dependence, eqn (1) is only suitable to describe the critical diameter in the steady state where an equilibrium between droplet breakage and coalescence has been reached. In other words, the impact of residence time on droplets’ disruption kinetics cannot be elucidated. During practical processes, although the critical droplet size is essential to characterize the theoretical limit of different techniques, the kinetics of droplet breakup is also of significant importance to predicting the results. The kinetics of size reduction depend on the residence time within the actual dispersing zone, which for high energy systems, is where an extreme level of energy is focused in a small area.30 Typically, in US systems, uneven power density distribution in the dispersing zone likely causes a wide EDS distribution. There is, therefore, a strong dependence of droplet size on the residence time that needs to be taken into consideration.
Another commonly reported quantity is the energy density (Ev), which is the energy input per unit volume, per unit time:8,30
| Ev = Pτ/V = P/v, | (3) |
| d(t) = Cεb1·τb2, | (4) |
| d(t) = CVaP−bτ−c, | (5) |
Here we look to develop an understanding of the impact of power input, sonication time and processing volume on the kinetics of emulsification. The potential difference amongst the parameters will be explored by examining the emulsion droplet breakup over a wide range of conditions. Correlations will be determined based on the power-law fit to provide empirical relationships that allow comparison of different types of mechanical emulsification equipment from energy consumption and emulsification efficiency perspectives for potential scaling-up purposes in practical applications.
Materials and methods
Materials
Sodium dodecyl sulfate (SDS) (Sigma Aldrich) and sunflower oil (Woolworths, Australia) were used as the surfactant and oil phase, respectively, without any further modification. Milli-Q water was used in all experiments as the continuous phase with a typical resistivity of 18.2 MΩ cm at 25 °C.Methods
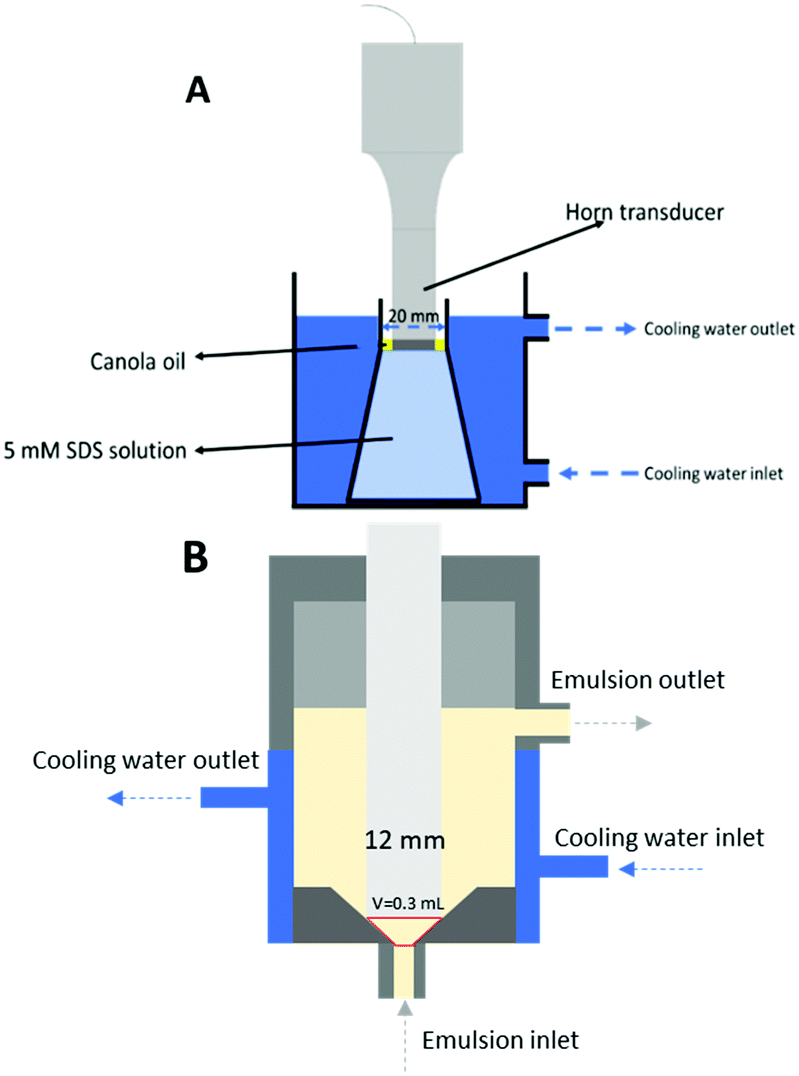 | ||
| Fig. 1 Schematic illustration of the ultrasound emulsification batch (A) and continuous flow (B) systems. | ||
One set of experiments was designed to investigate the influence of processing volume, but fixed interfacial contact area between the horn and the fluid. For this, three conical flasks of different volume but with a similar internal neck diameter around 2 cm were used. The processing volumes were adjusted according to the neck position to ensure a similar oil surface area contacted with the horn tip.
The effect of three parameters: sonication amplitude, time and processing volume were investigated as follows. Sonication amplitude was varied from 10% to 50% of the total power (400 W) (details of the calorimetric power characterization are shown below). The sonication time was varied from 30 s to 10 min for each amplitude applied. Three different processing volumes, 60, 110 and 180 mL, were examined using three conical flasks of different sizes. The three conical flasks had a similar neck width of ∼2 cm.
The emulsions were prepared with fixed SDS concentration of 5 mM in Milli-Q water and 1 wt% of canola oil to reduce impact from dispersed phase viscosity, close packing limits. For surfactants in an emulsion system, there exists a competition between the oil/water and air/water interfaces, which will exert an important effect on the size of O/W emulsion droplets that are formed. SDS surfactant is well-known to foam when subject to strong agitation. During ultrasonication, acoustic cavitation also creates air bubbles, causing some of the SDS molecules to move to the air/water interface. This can result in the creation of SDS-stabilised foams, which will cushion the shockwaves generated by sonication. The SDS concentration, sonication power input and the position of the sonicator probe, all need to be carefully adjusted to avoid excessive foaming.
Some preliminary experiments were conducted whereby the parameters mentioned were adjusted to avoid onset of excessive foaming during the sonication period (not shown). The occurrence of foaming resulted in poorer emulsification (evident from a damping of the sonication noise) and the formation of larger than expected droplets. Further, some of the oil droplets became immobilised in the foaming layer at the top of the aqueous phase, limiting their ability to be processed by the applied ultrasound. There was a threshold sonication power which, once exceeded, lead to excessive foaming and inefficient emulsification. Similarly, this was also the case with the SDS concentration. Based on these findings, an ‘optimal’ SDS concentration of 5 mM and ultrasonic power of 50% amplitude (200 W) was found to enable emulsification without formation of excessive foaming, even for prolonged durations of ultrasonication.
The solution temperature was controlled by the circulation of cooling water at 22.5 ± 2 °C. The conical flasks were placed in a glass cell with circulating water at sufficient level for submerging the entire emulsion.
| d[4,3] = ∑nidi4/∑nidi3 | (6) |
| Pcalo = cmΔT/t, | (7) |
Results and discussion
Impact of ultrasound power input on the kinetics of emulsion droplet size reduction
The volume-mean diameter of the droplets as a function of sonication time and power intensity is presented in Fig. 2. As expected, applying ultrasound at higher power input (for a given volume) produced smaller emulsion droplets more rapidly than at lower power. For all power inputs tested, the average droplet size was approximately inversely proportional to sonication time, reflecting the increasing difficulty of breaking apart progressively smaller droplets. By fitting the experimental data in the initial fast size reduction region using a power-law fit, power-law indices of ∼1.1 were determined, with high R2 = 0.99, regardless of the power amplitude used. This indicates that the proportionality between sonication time and droplet size is similar at various power levels (i.e., for a given emulsion and sonication power, halving the average droplet diameter will require processing for just under twice the amount of time).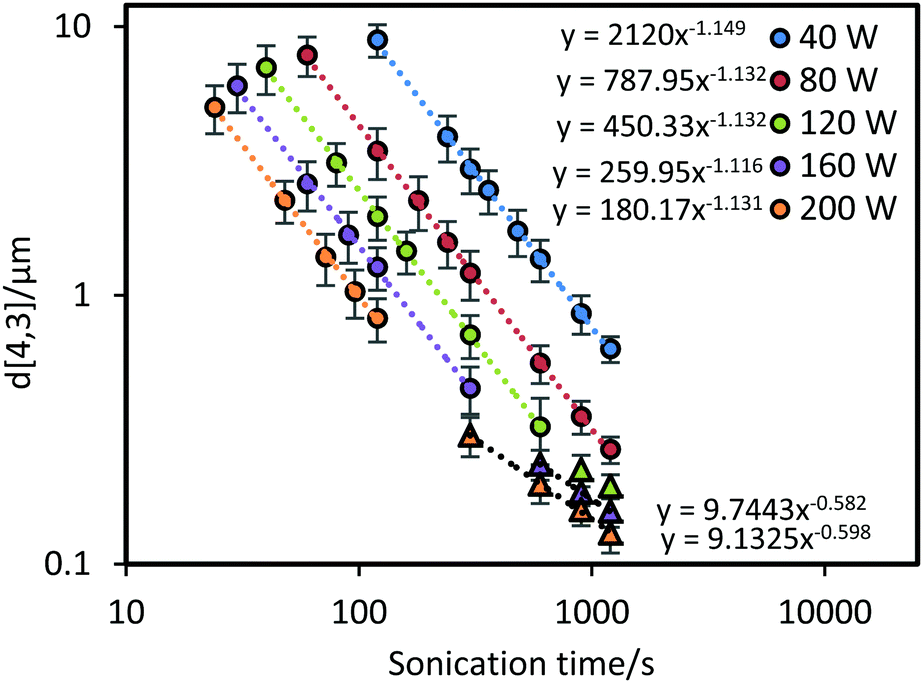 | ||
| Fig. 2 Volume mean droplet diameter, d[4,3], as a function of sonication time for different power intensities (W) at a constant volume (60 mL). Triangular symbols stand for the data points showing the transition towards steady state. Error bars represent the standard deviation of triplicate experiments. | ||
As many studies have demonstrated, a steady state (i.e., where the droplet size does not decrease with further sonication) is eventually be reached as the rate of shear-induced droplet breakup decreases to match the rate of droplet recoalescence.8,21,22,24,28,31 After prolonged ultrasonication at a power of 120 W and above (see triangular data points in Fig. 2) the kinetics deviate from the established power-law trend lines (dashed lines) as the droplet size starts to approach a steady state. To approximate the transition in kinetics from the initial power-law to steady state, new power-law trend lines can be extracted from the existing data, which share a power-law index value around −0.6. Although steady state was not fully reached in even the highest power input, the reduced rate of size decrease is evident in the transition region. This reflects the increasing difficulty of breaking smaller droplets.32 In a previous study by Cucheval and Chow,33 it was shown that a steady state diameter was reached after shorter (3 min) durations of sonication at a similar power input used in this current study. It should be noted however that the droplet sizes reached by Cucheval and Chow, were approximately 0.7 μm for all power inputs investigated. Compared to the results in this study and others,8,21,22 droplet sizes can reduce to the nano-size range with further treatment time. The main difference here is the surfactant/oil system used, which suggests that the ratio of the surfactant concentration/oil volume could be a limiting factor in the size reduction ability in some systems.
Prior to the transition region the power-law indices with respect to residence time were ∼1.1 for each power intensity. To determine the power-law index with respect to input power prior to the transition region, a correlation was performed between d[4,3]/τ−1.1 and power input (using all the pre-transition period data presented as circles in Fig. 2). As shown in Fig. 3, a power-law index for the fit was found to be around −1.5. Similarly, a correlation of droplet size and power input was plotted using the experimental data within the transition region towards steady state (i.e. the triangle symbols in Fig. 2 and 3), the power-law index was only around −0.6 for both sonication time and power input. Results from such a power-law fit between droplet size and power input has not been proposed in any of the previous studies. Nonetheless, implementing the same mathematical method on the data from the work by Abismaïl et al. provides comparable power-law indices of around −1.6 and −0.6 within the fast size reduction region and the steady state transition region respectively.24
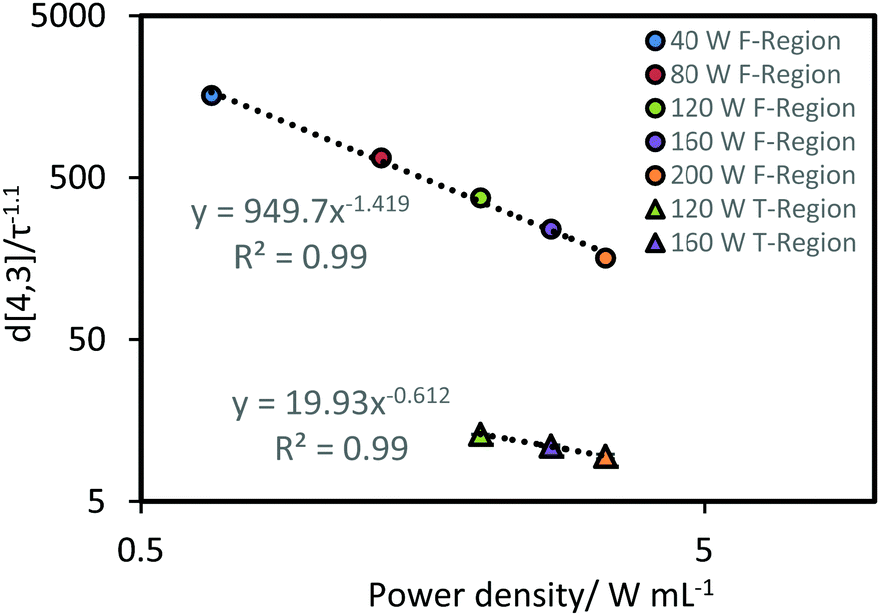 | ||
| Fig. 3 Correlation between d[4,3]/τ−1.1 and power density. Data points are the average of values obtained from the corresponding data presented in Fig. 2, where the data was normalized to the power-law index of −1.1. The error bars represent the standard deviation of these values. F-Region and T-Region indicate the fast size reduction and transition regions, respectively. | ||
By incorporating sonication time and power input together, the following equation can be devised to predict the droplet size outcome of the two regions:
| d[4,3] = CP−1.4τ−1.1, | (8) |
| d[4,3] = C(Pτ)−0.6, | (9) |
 | ||
| Fig. 4 Experimental data from Fig. 2, replotted as a function of P−1.4τ−1.1 and P−0.6τ−0.6 (inset plot). Circles and triangles represent data obtained in the fast size reduction region and the steady state transition region, respectively. | ||
Impact of processing volume on the kinetics of emulsion droplet size reduction
The relationship between emulsification kinetics and processing volume was examined further by varying the processing volume (V), and thereby the power density ε (W mL−1) at a given power intensity (40% amplitude, 160 W). The calorimetric power (Pcalo) was implemented in this experiment to examine the actual amount of energy dissipated for generating acoustic cavitation and shear stress.5,17,32 Experiments were performed using three selected volumes, which cover the processing volume range of general ultrasonic emulsification processes (60, 110 and 180 mL, corresponding to power densities of 0.53, 0.29 and 0.18 W mL−1, respectively). As expected, an increase in the processing volume (decrease in the power density) reduced the rate of droplet size reduction (Fig. 5A), owing to a reduction in the average energy density as the processing volume increases. To account for this, the same data were presented as a function of energy density (Fig. 5B). A correlation between d[4,3]/τ−1.1 and volume (inset plot in Fig. 5A), was performed to determine the impact of this volume change. Based on the linear trend, a proportional correlation can be extracted as d[4,3] ∼ V.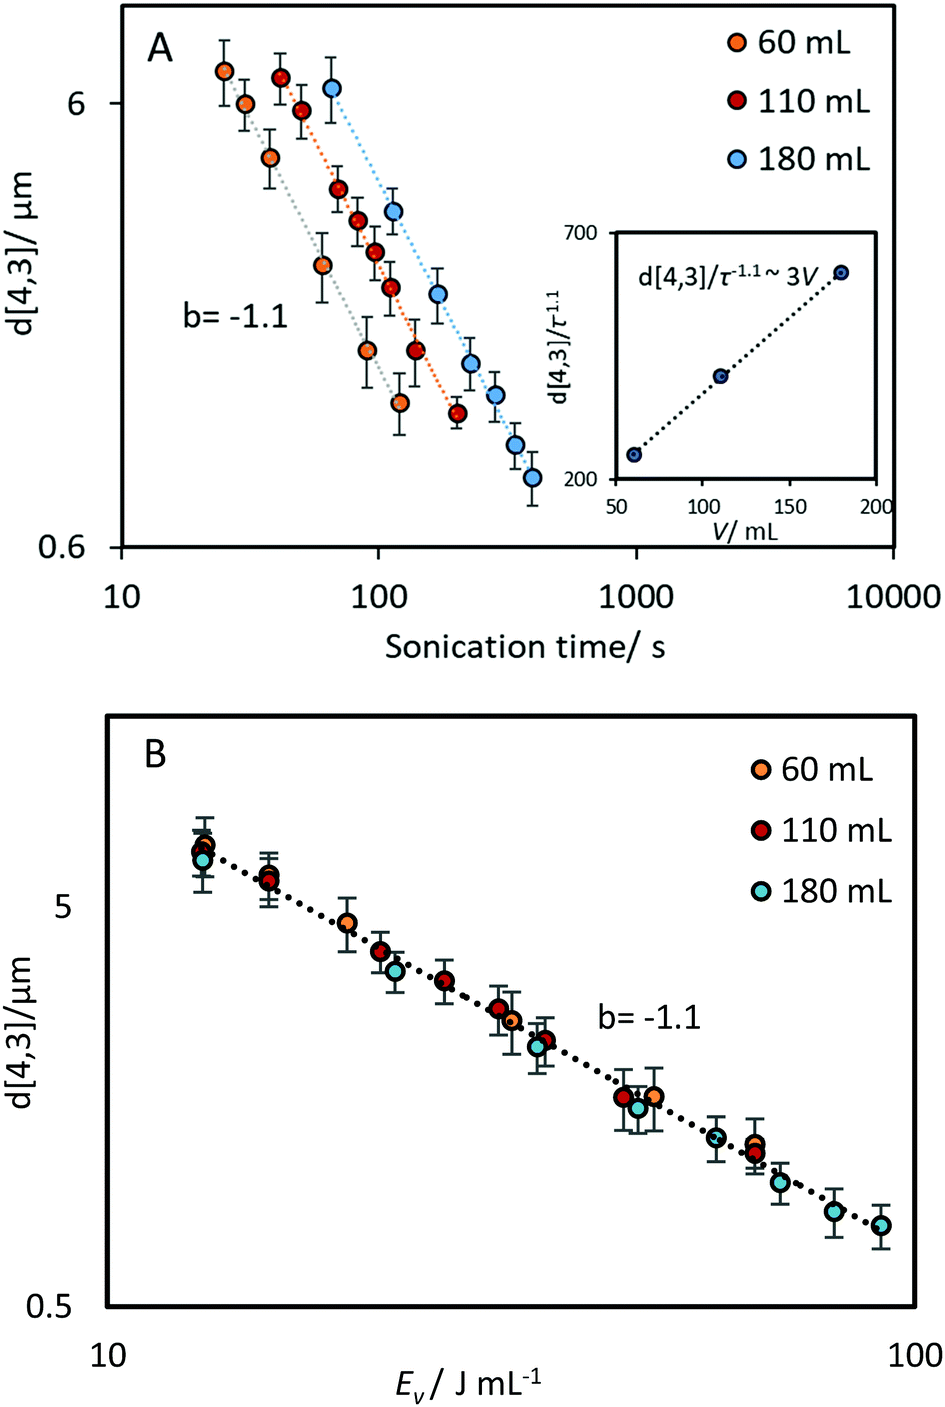 | ||
| Fig. 5 Volume mean average droplet diameter, d[4,3], as a function of sonication time (A) and energy density, Ev (B) at different processing volume and a constant power of 160 W. The inset plot shows the correlation between d[4,3]/τ−1.1 and processing volume (V). Error bars represent the standard deviation of triplicate experiments. | ||
By normalising the impact of processing volume, all the experimental data presented in Fig. 5 can be regressed into a linear correlation with R2 = 0.99 (Fig. 6). The high quality of the fit shows the consistency of employing the power-law index of power input and sonication time proposed above to different power densities. The result that the effectiveness and energy efficiency of droplet size reduction is independent of power density throughout the examined range, supports the possible scalability of ultrasound systems. Comparing this finding with the results above (i.e., the dependence on power intensity versus the independence on power density) indicates that it is the intensity of power in the emulsification zone of the probe that is important for achieving high energy efficiency, and that larger volumes can be processed simply by increasing the sonication time in proportion to the volume. This is consistent with the idea that it is the time the droplets spend in the emulsification zone near the horn tip that is important, and that with adequate mixing, this time will be proportional to the sonication time and inversely proportional to the processing volume. This understanding has implications for the translation of batch into continuous flow-through processes.
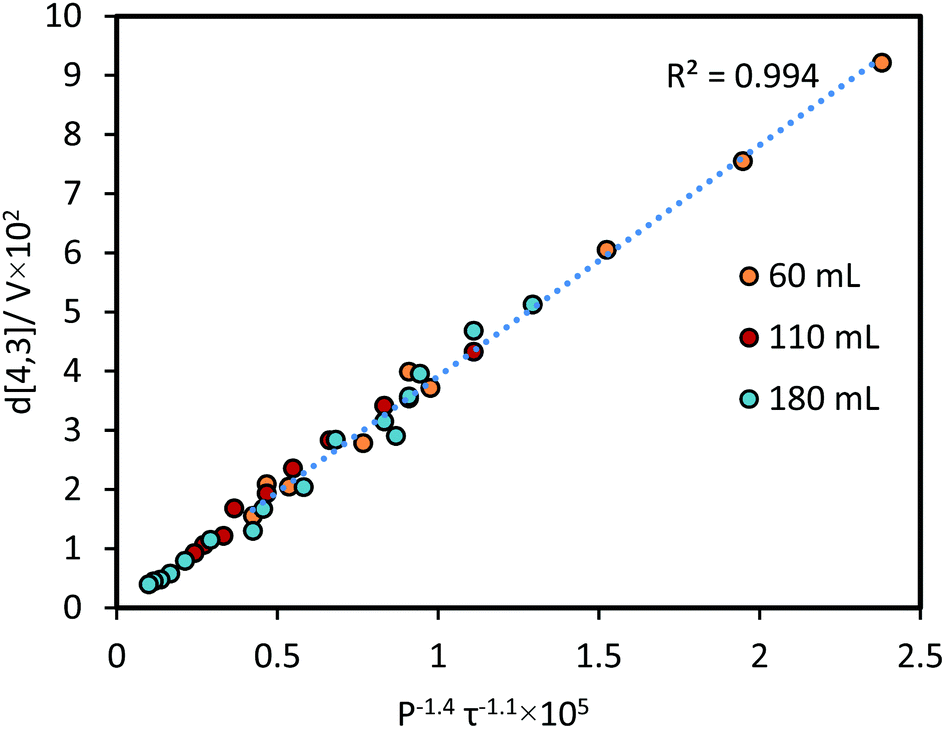 | ||
| Fig. 6 Correlation between d[4,3]/V and P−1.5τ−1.1. | ||
Based on the three parameters discussed above, eqn (10) can be presented:
| d[4,3] = C1·V·P−1.4τ−1.1, | (10) |
| d[4,3] = C1P−0.4Ev−1.1, | (11) |
The experiments in this study were designed such that emulsification at different power intensities could be directly compared at equivalent energy densities (sonication time × power input/processing volume). For this analysis, all the data presented in Fig. 2 is replotted on the basis of energy density Ev, as shown as Fig. 7 (on the basis of calorimetric power (Pcalo)). The power-law indices for the data obtained prior to the transition region show good agreement with eqn (11) proposed above. Additionally, by normalizing the constant of the power-law fit between droplets size and energy density, a correlation between d[4,3]/Ev. and calorimetric power (Pcalo) was developed with a resulting power-law index of −0.364. Of practical significance, the results show that for a given power density in the test range (0.13 W mL−1 to 0.66 W mL−1), it is more energy efficient to use a higher power density for a shorter time before entering the steady state transition (i.e. less energy will be required to produce an emulsion with a given average diameter). For example, for the system considered here, to produce an emulsion with a volume-mean average diameter of 1.2 micron would require about 55 J mL−1 at 50% amplitude (Pcalo = 40 W), 65 J mL−1 at 40% amplitude (Pcalo = 32 W), 75 J mL−1 at 30% amplitude (Pcalo = 24 W), 81 J mL−1 at 20% amplitude (Pcalo = 16 W), and 89 J mL−1 at 10% amplitude (Pcalo = 8 W). The general trend of increased energy efficiency as a function of increasing power intensity can be explained on the basis of acoustic cavitation. The theory of cavitation bubble dynamics says that with an increase in acoustic pressure, or in this case power input, the number of inertial cavitation bubbles (bubbles that undergo inertial collapse) and the intensity of bubble collapse increase, leading to enhanced physical effects such as higher velocity and stronger shear forces in the bulk liquid.17,30 On the other hand, sonication time only varies the duration of the induced shear force. Higher intensity ultrasound can also lower the threshold of droplet break-up, as determined by the Weber number:
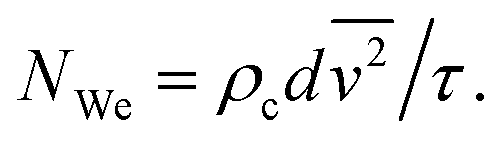 | (12) |
 is the average of the square of the relative velocity between the emulsion droplets and the surrounding continuous phase across the flow field, d is the droplet size, ρc is the density of the continuous phase, and σ is the interfacial tension between the water–oil interface. As the intensity of shear stress increases, the Weber number increases, and droplet deformation is promoted.35 In comparison, prolonged sonication time has no effect on the intensity of shear stress.
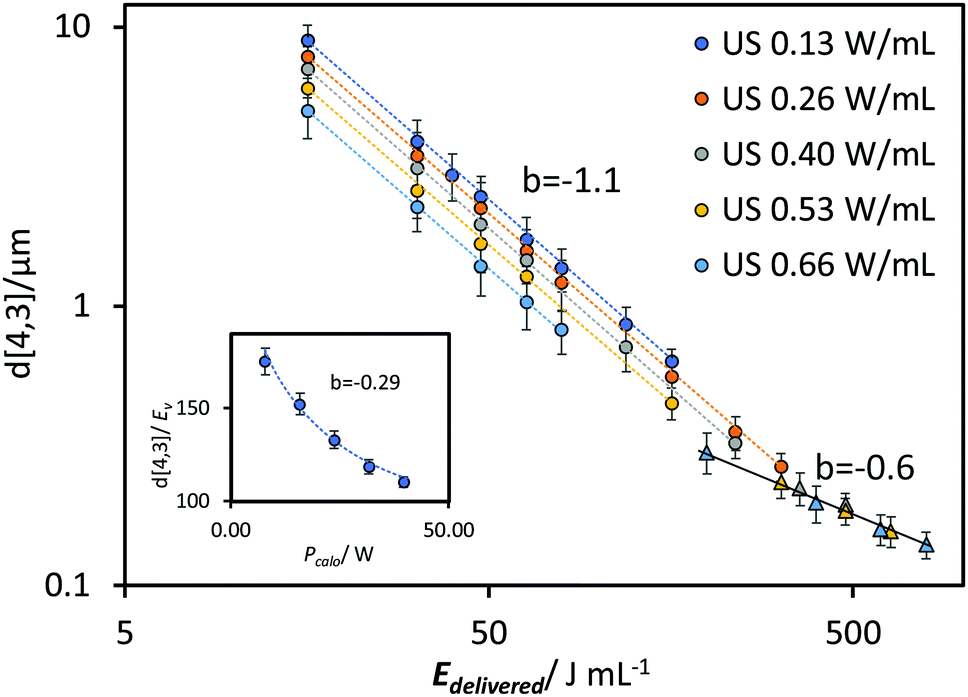 | ||
| Fig. 7 Volume mean diameter d[4,3] data presented in Fig. 2, replotted as a function of energy density Ev. Triangular symbols are used for the data points in the steady state transition region. The power-law indices of the two regions are −1.1 and −0.6 before and during the steady state transition region, respectively. The inset plot presents the correlation between d[4.3]/Ev and calorimetric power Pcalo. | ||
Interestingly, as the droplet size starts reaching the steady state transition region, the impact of the power input on energy efficiency appears to lessen (shown as triangular data points in Fig. 7). In this case the data points from different power inputs can be fitted to a single power-law correlation. In addition, the impact of sonication time reduces, reflected by the power-law index of around −0.6. These results indicate that the relative impact of sonication time and power input gradually converges, giving a new correlation between the droplet size and energy density:
| d[4,3] = Ev−0.6. | (13) |
Comparison of the emulsion droplets size reduction kinetics and energy efficiency between US and HPH
A comparison of the kinetics of EDS reduction was conducted between ultrasound and high-pressure homogenisation, where a similar approach was used to investigate the impact of the relevant HPH parameters.The pressure drop across the valve determined by the pressure gauge, ΔP, and the number of processing pass (N) were used to quantify the effective energy delivered to the fluid.14 The correlation between droplet size and ΔP was shown in Fig. 8A. Across all passes the power-law indices were approximately −0.8. Similarly, power-law indices of approximately −0.8 were obtained across all pressures for correlations between droplet size and pass number (Fig. 8B). In contrast to the US system, all the results from the HPH system could be fitted using a similar power-law index. There was no significant deviation across the tested range of pressure and passes. The power-law correlation was also fitted to the data from Gupta et al., which spanned up to 20 passes.21 A power-law index around −0.7 was obtained from N = 2 to N = 6. Beyond 10 passes significant deviations occurred at high ΔP, indicating the approach to a shear stress limit. For the data obtained beyond 10 passes a power-law index of approximately −0.4 was obtained.
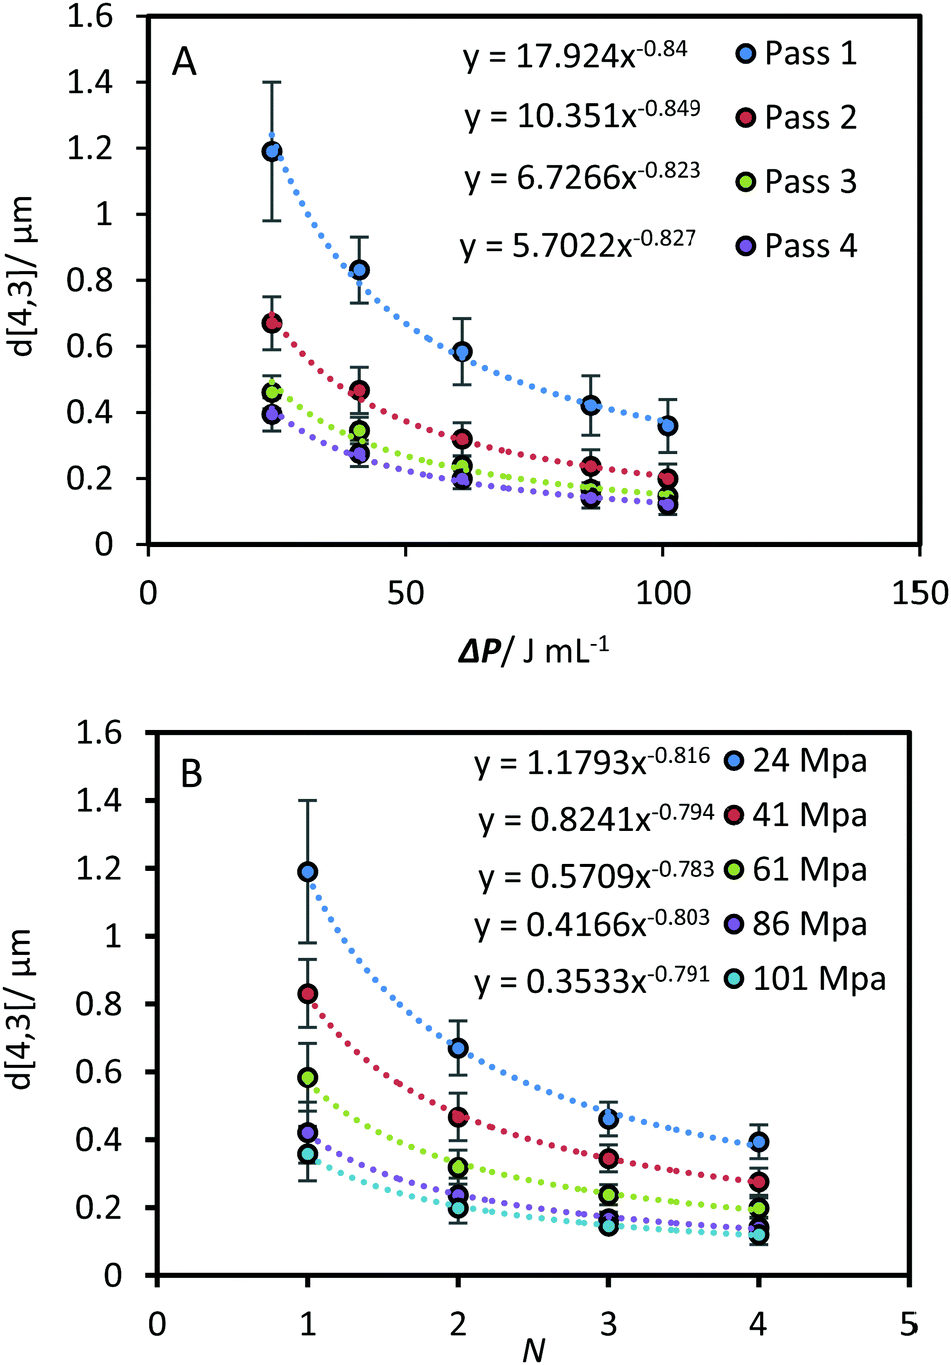 | ||
| Fig. 8 Volume mean diameter, d[4,3] after high-pressure homogenisation. The same data are presented as a function of ΔP (A) and number of processing pass, N (B). Error bars represent the standard deviation of triplicate experiments. | ||
To compare the energy efficiency of the two emulsification systems the droplet size data are plotted together as a function of energy density (Fig. 9A and B). The energy density was calculated on the basis of (i) the effective energy delivered to the emulsion, Edelivered (Fig. 9A) and (ii) the total electricity consumed by the emulsification device, Econsumed (Fig. 9B). The former indicates the effectiveness of droplet size reduction while the latter provides the operating efficiency of the emulsification equipment used in this study. The delivered energy density (Edelivered) was determined based on calorimetric power (Pcalo) for the US system, and pressure gauge readings (ΔP) for the HPH system. The consumed energy density (Econsumed) was determined using a power meter that provided direct measurements of the overall electric power drawn by the units during operation.
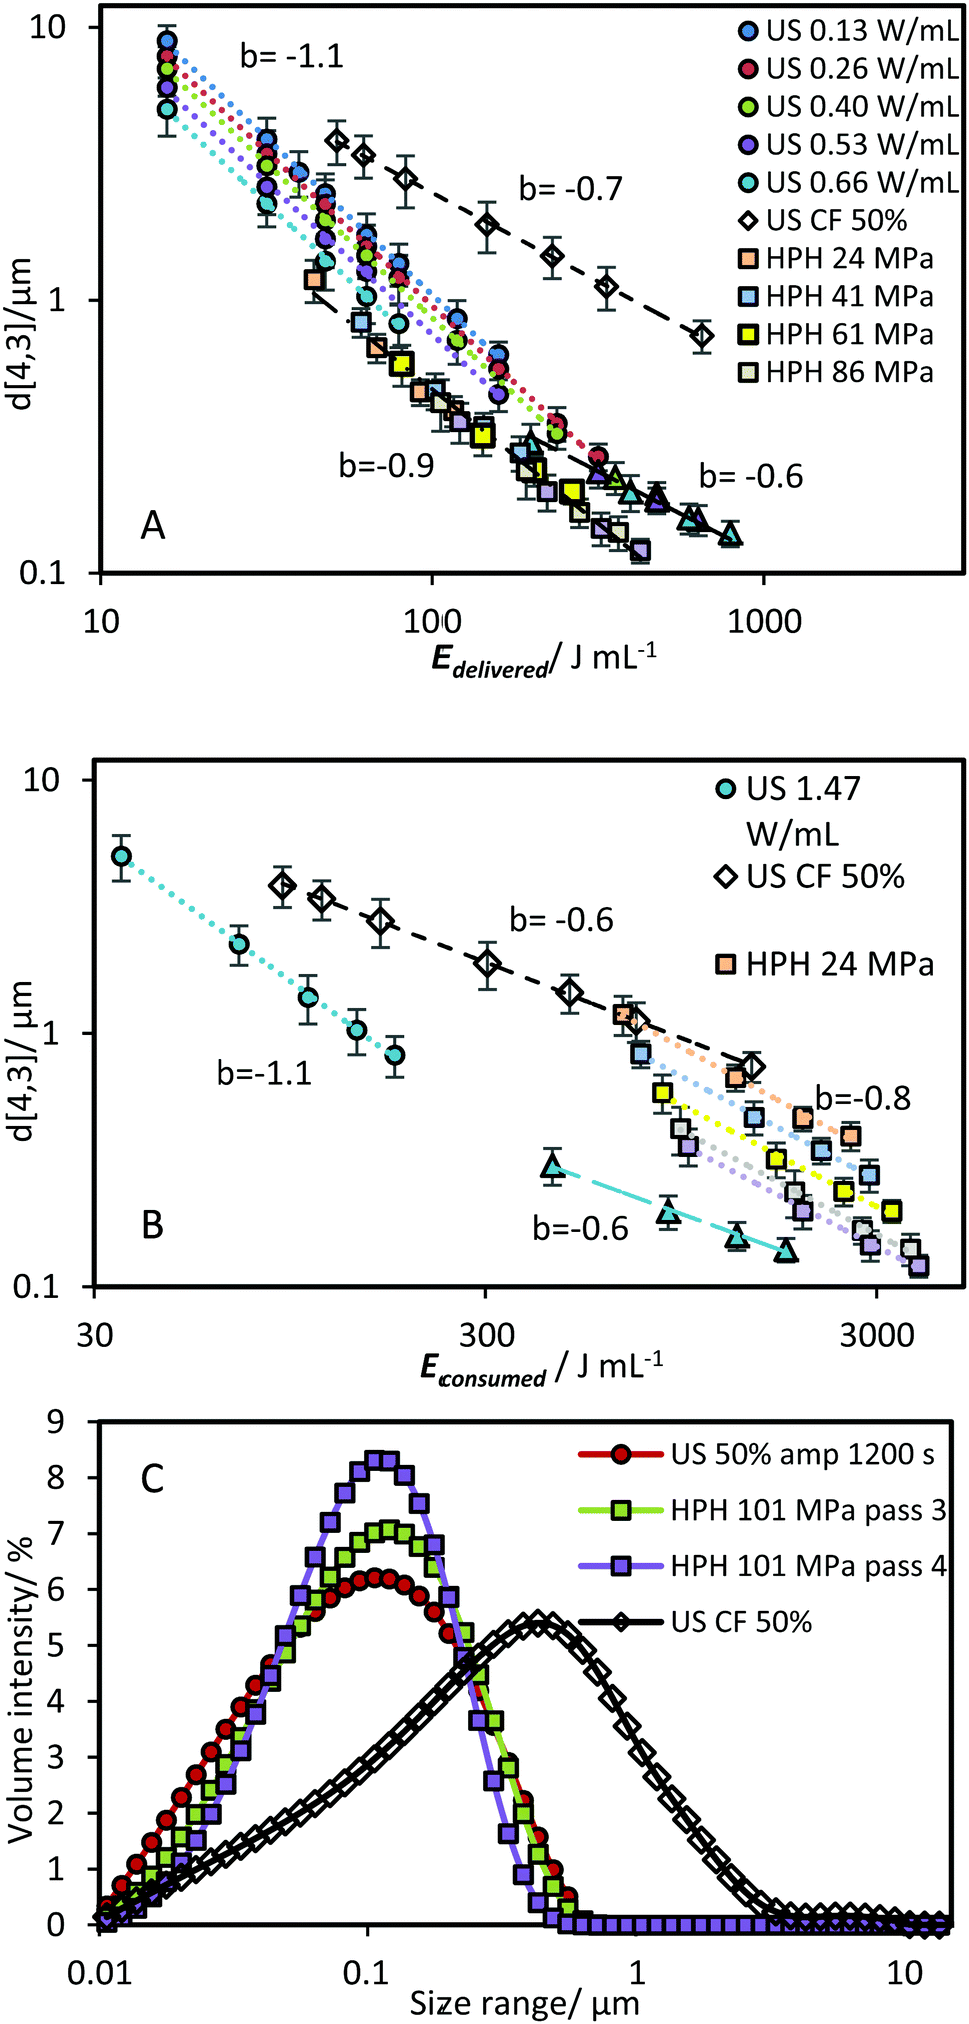 | ||
| Fig. 9 d[4,3] data from Fig. 2 and 8 replotted as a function of delivered energy density Edelivered (A, power density based on Pcalo and ΔP) and consumed energy density Econsumed (B, power density calculated based on total electric power). The triangular symbols with the solid trendline represent the droplet size data in the steady state transition region of the US batch emulsification. (C) Size distribution of droplets obtained by ultrasonication (50% amplitude for 20 min and continuous flow system at 3.8 mL min−1) and high-pressure homogenisation (ΔP = 101 MPa at 3 and 4 passes). | ||
Compared to both US systems, relatively small droplets were obtained using HPH across the tested range of pressure and passes. As demonstrated previously, ΔP and N have equivalent impact meaning the data points could be fitted to a single power-law correlation with an index of −0.9 (the difference between this value and the −0.8 presented previously is due to the inclusion of the additional of energy used in a UT pre-emulsification step (20 J mL−1)). This value is between the power-law indices for US prior to (−1.1) and during the transition region (−0.6). For an Edelivered ∼ 190 J mL−1, the two systems produced emulsions with a similar d[4,3] of around 300 nm. However, with an increase in Edelivered, the US system went into the steady state transition region, in which the efficiency on droplet size reduction decreases. In comparison, the HPH system is able to sustain the same efficiency throughout the tested range, reaching a droplet size of ∼120 nm at 425 J mL−1 compared to the US system requiring around 790 J mL−1 to reach the same size. The difference is mainly due to differences in the maximum shear stress in the two systems as discussed previously. For the US continuous flow system, a larger droplet size with an increased power-law index of −0.65 was observed. Compared to the US batch system, the larger droplet size can be attributed to the insufficient residence time within the energy dissipation zone (red-lined area in Fig. 1B). Although the power density, ε, increased compared to the batch system, from 0.66 W mL−1 to 166.67 W mL−1 (processing volume decreased from 60 mL to 0.3 mL), the residence time at highest energy density was 9 s, which was considerably short compared with the batch system. Additionally, the increase of the residence time in CF system with a higher power density results in an increased power-law index (less efficiency) compared to the batch system, indicating the change in the geometry of the processing unit, which may vary the shape of the cavitation zone and pattern of turbulence, could potentially alter the efficiency of emulsification.
For all the systems, the consumed energy density (Fig. 9B) was greater than the delivered energy density (Fig. 9A) due to inherent inefficiencies associated with the delivery of energy to the system and the background and operating power requirements. As previously observed for the US system, higher power inputs were more energy efficient, and this trend was even more pronounced on the basis of Econsumed. For the HPH, whereas the energy efficiency is independent of ΔP based on Edelivered, the energy efficiency in terms of Econsumed was considerably improved at higher pressures/fewer passes due to the addition of operation power from the high-pressure pump and background power. These results demonstrate that by increasing operating pressure, higher energy effectiveness can be achieved compared to increasing the number of processing passes. For example, a similar volume-mean diameter around 400 nm can be obtained by processing for one pass at 86 MPa with an Econsumed of 945 J mL−1, or using 4 passes at 24 MPa, with a much higher Econsumed of 2575 J mL−1.
Similar droplet size distributions were obtained using US batch system (50% amplitude at 20 min) and HPH (101 MPa for 3 or 4 passes) (Fig. 9C). The volume-mean diameters of the three distributions are 125 nm (US), 128 nm (HPH 101 MPa for 3 passes) and 120 nm (HPH 101 MPa for 4 passes). A slightly narrower size distribution was obtained using HPH than US. This could be due to the shear stress differences between the two systems, especially as the US system has entered the steady state transition region. US CF system, however, shows a relatively wider size distribution with a shoulder at size range 5 μm at the similar energy density range compared to US batch system (Edelivered ∼ 700 J mL−1 and Econsumed ∼ 1500 J mL−1), indicating an insufficient homogenization process. Kentish et al. also stated that an effective design is of great importance for a US CF system to achieve a higher emulsification efficiency. In experiments performed using a similar US CF setup, they encountered a similar shoulder in the size distribution, which they attributed to the fluid bypassing the cavitation zone.32
Table 1 compares the ratio of the power delivered (Pcalo for US and ΔP for HPH) to the power consumed (based on direct power meter readings). The power delivered represents only the power used for the generation of ultrasonic waves, Psonication, and the pressure increase during HPH, Pincease. These values were determined by subtracting the background power readings (i.e. when the sonication unit was on but not delivering ultrasound, and when the HPH was operating at 0 MPa) from the power consumption during operation. The ratio is similar for both units (0.63–0.67 for US, and 0.59–0.64 for HPH). Much of the energy inefficiency for the HPH unit was due to background power, which is exaggerated for a small lab-scale unit. Yap et al. have compared the energy consumption of laboratory-scale (GEA Niro Soavi NS1001), pilot-scale (GEA Niro Soavi NS3030) and industrial-scale (GEA Niro Soavi NS5355) HPHs.36 It was found that there was a 3-fold decrease in energy consumption upon scaling-up from lab- to industrial-scale. When this scale up factor is applied to the results obtained with the current HPH system, the energy efficiency of HPH at 86 MPa is similar to the lab-scale US system at 1.47 W mL−1 (Fig. 10).
| US | HPH | ||||
|---|---|---|---|---|---|
| P calo/W | P sonication/W | P calo/Psonication | ΔP/W | P increase/W | ΔP/Pincrease |
| 8.5 ± 1.1 | 13.6 ± 0.4 | 0.63 | 55.2 ± 3.2 | 93.8 ± 4.3 | 0.59 |
| 15.6 ± 0.9 | 24.4 ± 0.5 | 0.64 | 110.8 ± 5.4 | 172.4 ± 4.6 | 0.64 |
| 23.3 ± 1.2 | 35.3 ± 0.7 | 0.66 | 155.3 ± 7.6 | 242.3 ± 6.5 | 0.64 |
| 31.4 ± 1.0 | 47.2 ± 1.1 | 0.67 | 207.6 ± 10.2 | 322.6 ± 11.6 | 0.64 |
| 41.5 ± 1.2 | 64.1 ± 0.9 | 0.65 | 265.3 ± 11.2 | 412.1 ± 10.7 | 0.64 |
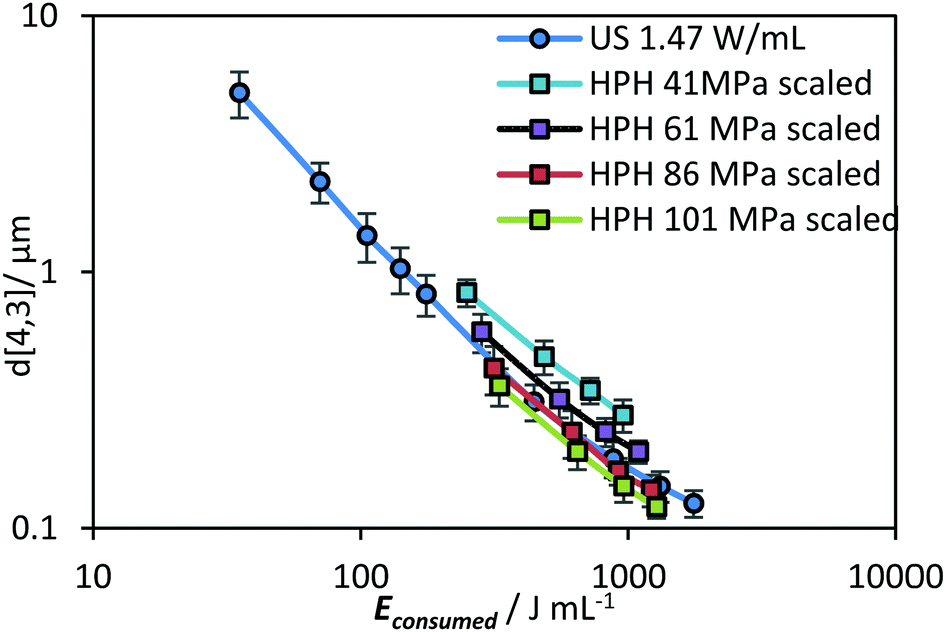 | ||
| Fig. 10 d[4,3] as a function of Econsumed for a lab-scale US and an industrial-scale HPH system. The energy density of the HPH system was derived from the data presented in Fig. 9 using a scale-up energy efficiency conversion factor as discussed in the text. The US data is the most energy efficient result as presented in Fig. 9B. | ||
For US systems, although a number of studies of large-scale reactors have been done for various applications37–39 that show the potential of operating at larger scales, a comparison of the energy efficiency across different scales of operation has yet to be performed. This would be of great interest to explore in future studies, especially in emulsion systems.
Conclusions
In this work, experiments were conducted to better understand the kinetics of ultrasonic emulsification in relation to operational parameters and energy efficiency. Empirical correlations were developed from the data that could be practically applied for the prediction of EDS. The impact of sonication time, power input and processing volume were investigated separately. Two kinetic regions of size reduction (a fast size reduction region and a steady state transition region) were distinguished based on the power-law fit. Within the fast size reduction region, the power input had a greater impact on size reduction than sonication time. Combining the individual parameters, the emulsion droplets size was correlated to energy density on the basis of calorimetric power. Power-law indices of −1.1 and −0.6 were obtained for the fast and transition regions, respectively. The difference in the impact of power input and sonication time was minimal in the transition region. The power-law index of −1.1 represents a faster size reduction compared to previous studies, indicating better emulsification capability of US than previously reported. A comparison of emulsification effectiveness and energy efficiency was made between US and HPH systems. The HPH system was able to obtain smaller droplet sizes than US, indicating a slightly higher effectiveness of size reduction. At lab-scale the US system could produce nanoemulsions using less electrical energy than HPH, indicating better energy efficiency at this scale. Taking the up-scaling factor for HPH into consideration, the tested US system still shows a competitive emulsification efficiency. Due to the unique combination of physical/chemical effects offered by ultrasound, the application of ultrasonic emulsification can be usefully applied to other fields including emulsion polymerisation and nutrient encapsulation where not only the physical shear, but also the radical formation from the cavitation is important. However, more attention needs to be put on the design of continuous ultrasonic flow systems that have good capabilities at large-scale.Conflicts of interest
There are no conflicts to declare.Acknowledgements
This research was supported under the University of Melbourne for the award of MRS, Australian Research Council's Industrial Transformation Research Program (ITRP) funding scheme (project number IH120100005). The ARC Dairy Innovation Hub is a collaboration between The University of Melbourne, The University of Queensland and Dairy Innovation Australia Ltd.References
- T. F. Tadros, Applied surfactants: principles and applications, John Wiley & Sons, 2006 Search PubMed.
- B. P. Binks, Modern aspects of emulsion science, Royal Society of Chemistry, 1998 Search PubMed.
- P. Luckham, B. Vincent and T. F. Tadros, Colloids Surf., 1983, 6, 101–118 CrossRef CAS.
- H. Karbstein and H. Schubert, Chem. Eng. Process., 1995, 34, 205–211 CrossRef CAS.
- S. Abbas, K. Hayat, E. Karangwa, M. Bashari and X. Zhang, Food Eng. Rev., 2013, 5, 139–157 CrossRef CAS.
- D. J. McClements and J. Rao, Crit. Rev. Food Sci. Nutr., 2011, 51, 285–330 CrossRef CAS PubMed.
- A. Shanmugam and M. Ashokkumar, Food Hydrocolloids, 2014, 39, 151–162 CrossRef CAS.
- T. Leong, T. Wooster, S. Kentish and M. Ashokkumar, Ultrason. Sonochem., 2009, 16, 721–727 CrossRef CAS PubMed.
- A. Forgiarini, J. Esquena, C. Gonzalez and C. Solans, Langmuir, 2001, 17, 2076–2083 CrossRef CAS.
- P. Izquierdo, J. Esquena, T. F. Tadros, C. Dederen, M. Garcia, N. Azemar and C. Solans, Langmuir, 2002, 18, 26–30 CrossRef CAS.
- I. Sole, A. Maestro, C. González, C. Solans and J. M. Gutiérrez, Langmuir, 2006, 22, 8326–8332 CrossRef CAS PubMed.
- I. N. Seekkuarachchi, K. Tanaka and H. Kumazawa, Ind. Eng. Chem. Res., 2006, 45, 372–390 CrossRef CAS.
- A. Håkansson, L. Fuchs, F. Innings, J. Revstedt, C. Trägårdh and B. Bergenståhl, Chem. Eng. Commun., 2013, 200, 93–114 CrossRef.
- S. Schultz, G. Wagner, K. Urban and J. Ulrich, Chem. Eng. Technol., 2004, 27, 361–368 CrossRef CAS.
- S. M. Jafari, Y. He and B. Bhandari, J. Food Eng., 2007, 82, 478–488 CrossRef.
- Y. Y. J. Zuo, P. Hébraud, Y. Hemar and M. Ashokkumar, Ultrason. Sonochem., 2012, 19, 421–426 CrossRef CAS PubMed.
- J. Canselier, H. Delmas, A. Wilhelm and B. Abismaïl, J. Dispersion Sci. Technol., 2002, 23, 333–349 CrossRef CAS.
- M. Ashokkumar, R. Bhaskaracharya, S. Kentish, J. Lee, M. Palmer and B. Zisu, Dairy Sci. Technol., 2010, 90, 147–168 CrossRef CAS.
- T. Leong, M. Ashokkumar and S. Kentish, Acoust. Aust., 2011, 39, 54–63 Search PubMed.
- M. Ashokkumar, Theoretical and experimental sonochemistry involving inorganic systems, Springer Science & Business Media, 2010 Search PubMed.
- A. Gupta, V. Narsimhan, T. A. Hatton and P. S. Doyle, Langmuir, 2016, 32, 11551–11559 CrossRef CAS PubMed.
- A. Gupta, H. B. Eral, T. A. Hatton and P. S. Doyle, Soft Matter, 2016, 12, 1452–1458 RSC.
- M. Li and H. Fogler, J. Fluid Mech., 1978, 88, 499–511 CrossRef CAS.
- B. Abismaïl, J. Canselier, A. Wilhelm, H. Delmas and C. Gourdon, Ultrason. Sonochem., 2000, 7, 187–192 CrossRef.
- J. Hinze, AIChE J., 1955, 1, 289–295 CrossRef CAS.
- S. Tcholakova, N. Vankova, N. D. Denkov and T. Danner, J. Colloid Interface Sci., 2007, 310, 570–589 CrossRef CAS PubMed.
- N. Vankova, S. Tcholakova, N. D. Denkov, V. D. Vulchev and T. Danner, J. Colloid Interface Sci., 2007, 313, 612–629 CrossRef CAS PubMed.
- N. Vankova, S. Tcholakova, N. D. Denkov, I. B. Ivanov, V. D. Vulchev and T. Danner, J. Colloid Interface Sci., 2007, 312, 363–380 CrossRef CAS PubMed.
- P. Walstra, Chem. Eng. Sci., 1993, 48, 333–349 CrossRef CAS.
- O. Behrend and H. Schubert, Ultrason. Sonochem., 2001, 8, 271–276 CrossRef CAS PubMed.
- S. G. Gaikwad and A. B. Pandit, Ultrason. Sonochem., 2008, 15, 554–563 CrossRef CAS PubMed.
- S. Kentish, T. Wooster, M. Ashokkumar, S. Balachandran, R. Mawson and L. Simons, Innovative Food Sci. Emerging Technol., 2008, 9, 170–175 CrossRef CAS.
- A. Cucheval and R. Chow, Ultrason. Sonochem., 2008, 15, 916–920 CrossRef CAS PubMed.
- L. E. Kinsler, A. R. Frey, A. B. Coppens and J. V. Sanders, in Fundamentals of Acoustics, ed. L. E. Kinsler, A. R. Frey, A. B. Coppens and J. V. Sanders, Wiley-VCH, 4th edn, 1999, p. 560, ISBN 0-471-84789-5 Search PubMed.
- B. Tal-Figiel, Chem. Eng. Res. Des., 2007, 85, 730–734 CrossRef CAS.
- B. H. Yap, G. J. Dumsday, P. J. Scales and G. J. Martin, Bioresour. Technol., 2015, 184, 280–285 CrossRef CAS PubMed.
- Y. Asakura, T. Nishida, T. Matsuoka and S. Koda, Ultrason. Sonochem., 2008, 15, 244–250 CrossRef CAS PubMed.
- P. R. Gogate, V. S. Sutkar and A. B. Pandit, Chem. Eng. J., 2011, 166, 1066–1082 CrossRef CAS.
- B. Zisu, R. Bhaskaracharya, S. Kentish and M. Ashokkumar, Ultrason. Sonochem., 2010, 17, 1075–1081 CrossRef CAS PubMed.
| This journal is © the Owner Societies 2018 |