
 Open Access Article
 This Open Access Article is licensed under a
 Creative Commons Attribution 3.0 Unported Licence
Origins of biological function in DNA and RNA hairpin loop motifs from replica exchange molecular dynamics simulation†
Jacob B.
Swadling
a,
Kunihiko
Ishii
b,
Tahei
Tahara
 b and
Akio
Kitao
*a
b and
Akio
Kitao
*a
aSchool of Life Science and Technology, Tokyo Institute of Technology, 2-12-1 Ookayama, M6-13, Meguro, Tokyo 152-8550, Japan. E-mail: akitao@bio.titech.ac.jp; Fax: +81-3-5734-3372; Tel: +81-3-5734-3373
bRIKEN, 2-1 Hirosawa, Wako, Saitama, 351-0198, Japan
First published on 3rd January 2018
Abstract
Deoxyribonucleic acid (DNA) and ribonucleic acid (RNA) have remarkably similar chemical structures, but despite this, they play significantly different roles in modern biology. In this article, we explore the possible conformations of DNA and RNA hairpins to better understand the fundamental differences in structure formation and stability. We use large parallel temperature replica exchange molecular dynamics ensembles to sample the full conformational landscape of these hairpin molecules so that we can identify the stable structures formed by the hairpin sequence. Our simulations show RNA adopts a narrower distribution of folded structures compared to DNA at room temperature, which forms both hairpins and many unfolded conformations. RNA is capable of forming twice as many hydrogen bonds than DNA which results in a higher melting temperature. We see that local chemical differences lead to emergent molecular properties such as increased persistence length in RNA that is weakly temperature dependant. These discoveries provide fundamental insight into how RNA forms complex folded tertiary structures which confer enzymatic-like function in ribozymes, whereas DNA retains structural motifs in order to facilitate function such as translation of sequence.
1 Introduction
Ribonucleic acid (RNA) and deoxyribonucleic acid (DNA) can both form short secondary structural folds known as hairpin loops. Hairpin loops form in single-stranded nucleic acids and consist of a base-paired stem and a loop sequence with unpaired nucleotide bases. Hairpins occur when two regions of the same strand, usually complementary in nucleotide sequence when read in opposite directions, base-pair to form a double helix that ends in an unpaired loop.1 The resulting structure is a key building block of many folded secondary structures found in nature, such as ribozymes (RNA enzymes) and messenger-RNA.2Nucleic acids are ubiquitous in modern biological phenomena. DNA stores information in cells, which enables each cellular constituent to be synthesised, assembled and regulated. RNA is involved in the building of ribosomes, in protein synthesis, and in regulatory mechanisms. Viruses are primitive entities containing DNA or RNA, while viroids are merely RNA fragments.
The structural model of DNA proposed by Watson and Crick3 was a decisive event, triggering a dramatic development in molecular biology. Since then and particularly over the last 20 years, the significance of nucleic acids in the living world has become even more evident. The possibility of determining the sequence of several hundred nucleotides either by purely chemical methods4 or by chemical and enzymatic methods5 has opened the way to understand the genome. The sequencing of the plasmid pBR322 was the first great success using these methods.6
The B-helix form of DNA, which we often think of, accounts for most of the behaviour of DNA. Nevertheless, DNA is not always present in this canonical structure but can also form alternatives such as Z-DNA, triple-helix DNA, quadruplex DNA, and slipped-strand DNA.7 One such type of non-canonical DNA which has been much overlooked, but has an active role in cell biology, is single-stranded hairpin DNA.
There are at least three different families of proteins in which specific DNA hairpin binding activities occur. (i) In prokaryotes and their viruses. Single-stranded phages have been found to use DNA hairpins in nearly all steps of their life cycle, such as the origin of replication of E. coli.8 (ii) Cruciform DNA, a type of DNA which contains hairpin motifs has been demonstrated at the RCR dso and for N4 phage promoters. In eukaryotes, cruciform binding proteins have recently been identified and have been suggested to play a major role in genome translocation9 and replication initiation.10 (iii) Finally, the evolution of functions involving single-stranded DNA is implicated in horizontal gene transfer, response to stress, and genome plasticity.11
RNA hairpins originate by two mechanisms: (i) transcription by DNA dependent RNA polymerase of an inverted repeat DNA resulting in the RNA folding into a hairpin loop structure, and (ii) an RNA molecule formed as a folded-back template for RNA-dependent RNA polymerase, which synthesises the second strand of the stem. The second mechanism, which produces perfect long double-stranded RNA hairpins, is not widespread in nature and is most likely restricted to a ‘copy-back’ mechanism of replication in certain viruses.12,13
Functionally, RNA hairpins can regulate gene expression in cis or trans, i.e., an RNA hairpin within an RNA molecule can regulate just that molecule (cis) or it can induce effects on other RNAs or pathways (trans). Hairpins serve as binding sites for a variety of proteins, act as substrates for enzymatic reactions as well as display intrinsic enzymatic activities.14
Alongside the limitless possibilities offered in molecular biology, in biotechnology and soon in genetic therapy, we should not forget the role of genetic engineering in the physicochemical study of nucleic acids. The discovery of an enzymatic role for certain RNAs, while extending the enzymatic concept to on-protein structures (ribozymes), has thrown new light of origins of life and has given a new impetus to methods for modelling the tertiary structures of RNA.15
Structurally, DNA and RNA are very similar, but they have distinctively different and divergent roles in common biological processes. The most naturally prevalent nucleic acids are comprised of either a ribose sugar, in RNA, or a deoxyribose sugar, in DNA. The primary structure of a nucleic acid is conventionally written as a set of bases going from left to right such that each phosphodiester bond is linked to the 3′ of the sugar on the left and to the 5′ of the sugar on the right.1
Since only one of the DNA strands is transcribed into RNA, the latter no longer exhibits the regular complementarity of the bases on each strand that allows very long double helix structures to be formed. However, the phosphodiester chain of RNA can fold on itself and create double helix regions separated by single stranded loops of varying sizes. The difference between the geometry and the structure of DNA and RNA is accentuated still further by the replacement of deoxyribose with ribose. All the regions of RNA with a double-helix structure take on the A-form and the ribose has the C3′-endo conformation. Moreover, the 2′-OH group can form a hydrogen bond with the O4′ atom of the neighbouring 3′ ribose, which stabilises and stiffens the structure.1
The function and dynamics of nucleic acids are intimately tied to the conformational states at a given temperature. Accurately characterising the complete conformational space of biomolecules is a problem of fundamental importance in physical chemistry and computational biology.
Understanding the structural and dynamical differences between DNA and RNA not only give us information on their function in modern biology, but it gives us clues as to the nature of the first biomolecules at the time of the origins of life.16,17
There have been a number of studies utilising temperature replica exchange methods to understand the folding of short RNA hairpins,18,19 and of DNA hairpins20 in the past. Previous studies have largely focused on short sequences (around 8 nucleotides in length), and to our knowledge, they have not made a direct comparison between analogous DNA and RNA hairpin sequences.
In this study, we have made the first direct comparison between 29 nucleotide single-stranded DNA and RNA hairpin loops of analogous sequence, using the enhanced sampling nature of replica exchange simulations. To our knowledge, it is the largest computational study of DNA and RNA hairpin loops to date. The purpose of this study is to understand how the minor local difference in structure between DNA and RNA can lead to major global structural/dynamical differences. The observed differences can give us an understanding of how these local chemical distinctions lead to emergent properties that lead to divergent roles in modern biology.
2 Methods
In the system set-up subsection we describe in detail the methodology used to build the initial atomistic models used in this study, and the specific computational simulation protocols applied to run the simulations. Following this, we provide information on the theoretical underpinning of the analysis methods used to probe the molecular dynamics trajectories.2.1 System set-up
We designed the DNA and RNA hairpin loop sequence (shown in Fig. 1) with special consideration for the convenience of future experimental set-ups, namely, the design of two dimensional fluorescence lifetime correlation spectroscopy (2D FLCS). Because thymine and uracil have the weakest stacking interactions between adjacent pairs, we designed a loop region consisting of these bases in order to minimise the dependency caused by the loop region. This is an important detail in setting up Fluorescence Correlation Spectroscopy (FCS) measurements.21 We selected a four base stem region because the measured dissociation time using FCS at room temperature is in the microsecond regime. The time scale increases dramatically with increasing base number in the stem region. In FCS experiments, it is important to achieve an equilibrium between folding and unfolding rates (such that there is a free energy difference of zero). The length of the loop region which achieves equal association and dissociation times is known to be approximately 20 nucleotides.22 We added a 5′ tail of bases because with direct/close donor–acceptor dye interaction the fluorescence may be quenched (perhaps by forming aggregates). With a distance of three bases that we imposed on the sequence, theoretically, we can avoid the extinction and achieve good fluorescence in 2D FLCS experiments.21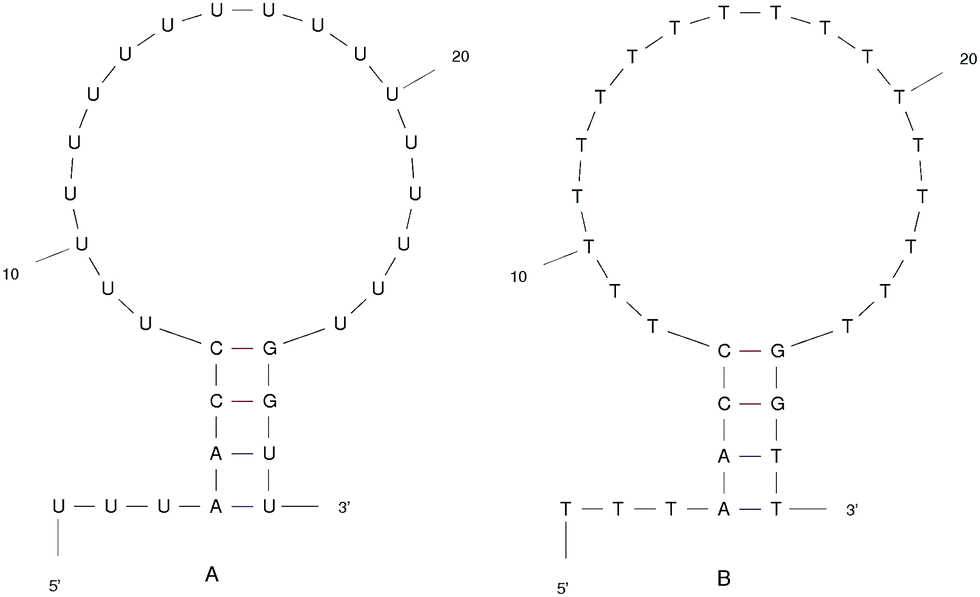 | ||
| Fig. 1 The ideal structure of the (A) RNA and (B) DNA hairpin loop secondary structural motifs. Results were taken from the mfold web server.24 | ||
The starting structure of single-stranded DNA and RNA (Fig. 1) were made using the Nucleic Acid Builder (NAB)23 a program which is part of AmberTools. The NAB produces a single strand of the nucleic acid B-form, which we refer to as elongated, or unfolded. Elongated/unfolded structures (each consisting of 29 individual nucleotides) of sequence 5′-UUUAACC(U)18GGUU-3′ and 5′-TTTAACC(T)18GGTT-3′ were constructed for DNA and RNA respectively, where U, T, A, G and C abbreviations correspond to uracil, thymine, adenine, guanine and cytosine nucleic acid bases.
The nucleic acid structures were solvated with ∼10![[thin space (1/6-em)]](https://www.rsc.org/images/entities/char_2009.gif) 000 SPC/E water molecules25 in a truncated octahedral box and Na+/Cl− to give an ionic concentration of 0.4 M. The total number of atoms per replica are 32398 for DNA and 32522 for RNA.
000 SPC/E water molecules25 in a truncated octahedral box and Na+/Cl− to give an ionic concentration of 0.4 M. The total number of atoms per replica are 32398 for DNA and 32522 for RNA.
Simulations were performed using the GROMACS code26,27 and the ff14SB force field.28 All bonds were constrained using the LINCS algorithm.29 The leap-frog algorithm with a time-step of 2 fs was used for integrating Newton's equations of motion. Fast smooth Particle-Mesh Ewald (SPME) method was used to treat the long-range electrostatic interactions, with a cut-off of 10 Å. Temperature coupling was handled using velocity rescaling with a stochastic term.30 The stochastic term ensures that a proper canonical ensemble is generated. Pressure coupling was handled using the Parrinello–Rahman method.31
Short 20 ns simulations of each nucleic acid were run at a temperature of 500 K in explicit water in order to obtain a compact globular form which was subsequently used to build the Replica Exchange Molecular Dynamics (REMD) starting structure. Our previous work shows that RNA rapidly forms a compact/globular conformation over a few nanoseconds.17 Conformations with the lowest radius of gyration were selected as starting structures for REMD, see Fig. S1 in the ESI.† Independent 100 ns molecular dynamics simulations were performed at each temperature to equilibrate the individual replicas at each temperature, before running REMD for 1 μs (a cumulative total of 108 μs simulation time).
REMD is a widely adopted method for the study of protein and RNA folding.32 REMD consists of M noninteracting copies (or, replicas) of the original system in the canonical ensemble at M different temperatures Tm (m = 0,…,M1). The replicas are arranged so that there is always one replica at each temperature. The trajectory of each independent replica is computed using MD. Adjacent replicas (replicas i and i + 1) exchange temperatures according to a Boltzmann probability distribution. REMD essentially runs N copies of the system, randomly initialised, at different temperatures. Then, on the basis of the Metropolis criterion, configurations are exchanged at different temperatures. The idea of this method is to make configurations at higher temperatures available to the simulations at lower temperatures and vice versa. This results in a very robust ensemble that is able to sample both low- and high-energy configurations. REMD produces enhanced sampling over single trajectory MD because fixed-temperature conformations are much more easily trapped in local energy minima.
In order to achieve the desired range of temperatures and the optimal uniform exchange probability between adjacent replicas, we employed the “Temperature generator for REMD-simulations” web-server.33 108 temperature replicas were made spanning temperatures 273.00–502.46 K. See Table S1 in the ESI† for a full list of temperatures. Additional consideration was also given to the number of replicas and the architecture of the computing resources used in this study. The exchange probability was on average 30% in all simulations. Fig. 2 shows us that a single replica traverses all of the temperature space, which tells us that the high energy conformations are available to low-temperature replicas, and thus there is a converged sampling of conformational space. We also provide in the ESI,† Fig. S2. Values of the average number of hydrogen bonds formed, bootstrapped over a number of simulation time frames. This visualises the convergence of values and provides evidence, along with Fig. 2, that 1 μs of simulation per replica is sufficient.
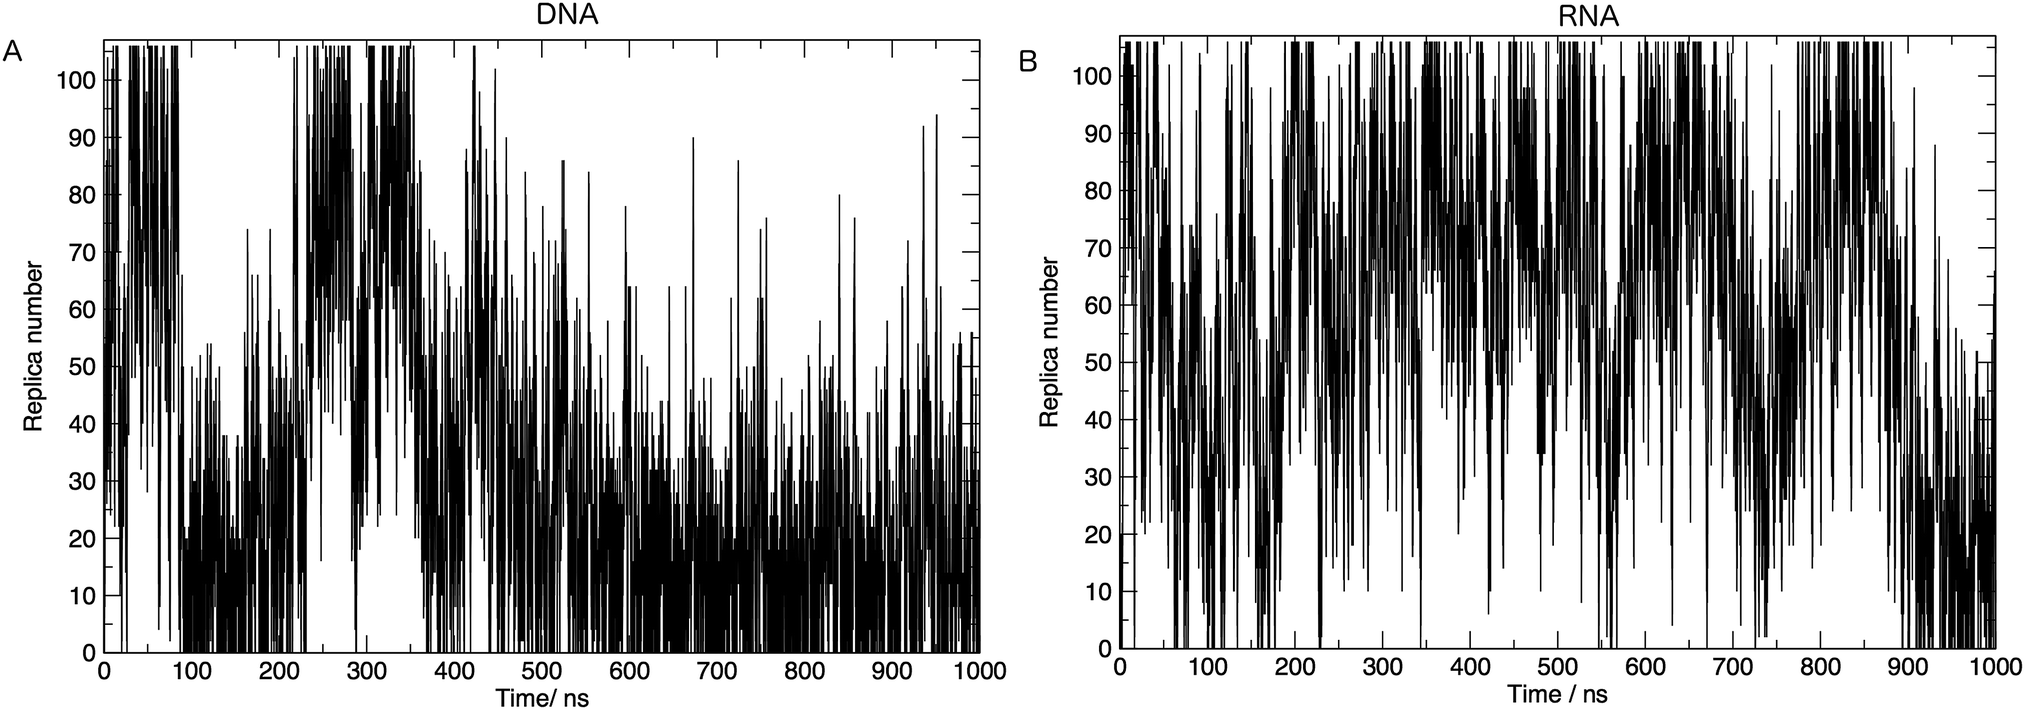 | ||
| Fig. 2 Movement of one simulation through replica temperatures for (A) DNA and (B) RNA. One round-trip is defined as a journey from the initial temperature to the highest temperature and back again. Both (A) and (B) show >5 complete round-trips, indicating that the high energy conformations are accessible and there is a good mixing of replicas. | ||
2.2 Calculation of FRET intensity from end-to-end distance
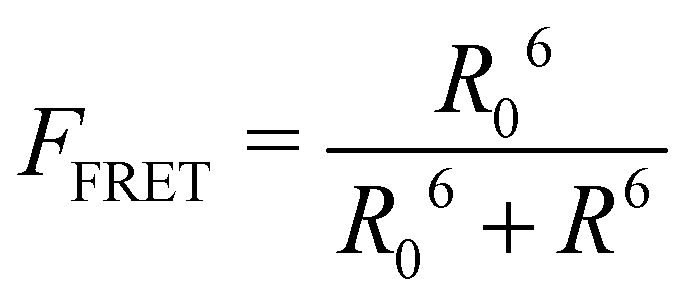
This part of the methodology details the calculations undertaken to compare our simulated nucleic acids to those studied using experimental Förster Resonance Energy Transfer (FRET) techniques.34,35End-to-end distance is a useful quantity for characterising the formation of hairpin loop structures, which can be measured by FRET spectroscopy. FRET is a well-established photo-physical phenomenon by which energy transfer from a donor fluorophore to an acceptor molecule (chromophore/fluorophore) occurs over various distances (typically from 1 nm and up to 10 nm). The energy transfer efficiency often measures the relative distance between the donor and acceptor (FRET pair) and therefore, is popularly known as a “molecular ruler”. FRET is often applied to investigate changes during molecular interaction as a function of time due to its noninvasive nature. This technique provides advantages, including increased sensitivity, short observation timescale in the nanosecond, the working range of distances over which most of the biomolecular processes occur, making it an ideal experimental technique for the understanding of nucleic acid folding processes.36 FRET intensity is directly related to simulated virtual intensity, which we can calculate using the molecules end-to-end distance. Below, we derive the virtual intensity from end-to-end distances and describe how it relates to experimentally derived FRET intensity.
FRET efficiency varies as the sixth power of the distance (R) between the donor/acceptor pair attached to the molecule(s) and can be determined by the following equation:36
 | (1) |
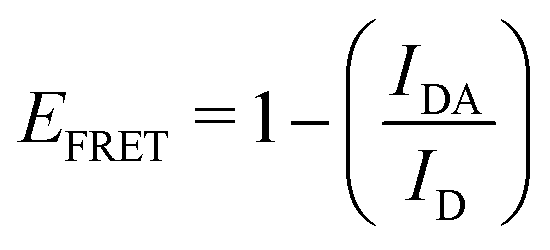 | (2) |
By combining the above equations we can calculate the virtual intensity Ivirtual from simulation by measuring the end-to-end distance using the following equation:
 | (3) |
2.3 Nucleic acid structure characterisation
In this subsection of the methodology we give details on a number of the quantities used in this study to characterise the various nucleic acid structures.Consider N segments of length a each making a small angle θ with the previous one (lying on a cone of vertical semi-angle θ around the previous segment). The mean value 〈h〉 of the projection on the first segment of the end-to-end distance is given by
 | (4) |
θ. The persistence length Lp is defined as the limiting value of h as N → ∞ We then have| Lp = a/(1 − x) | (5) |
| Lp = 2a/θ2 | (6) |
Note that the persistence length does not depend on the length L along the curve, but is an intrinsic property of the polymer in a given medium.
The radius of gyration RG is defined as the square root of the mean square of the distance ρ between the atoms and the centre of gravity of the chain:
 | (7) |
3 Results
In the following results sub-sections, we first concentrate on the temperature dependence of DNA and RNA structure. We employ the enhanced sampling nature of the temperature replica exchange method to collate all simulation trajectory data to view the similarities and differences in hairpin structure, dynamics and stability over a range of temperatures, such as nucleic acid melting. Following the discussion of structure at these conditions we take an in-depth look at how small local chemical changes in the nucleic acid structure affect the global conformational landscape and molecular properties.3.1 Temperature dependent properties of nucleic acid hairpin loops
Here we discuss the results obtained from replica exchange simulations at all temperatures. We simulated replicas at 108 different temperatures as mentioned in the Methods section and listed in Table S1 of the ESI.†By calculating the average radius of gyration of the hairpins at each temperature we constructed melting curves of the nucleic acids shown in Fig. 3. The melting curves show how the effective size of the nucleic acid changes with temperature. Higher temperatures lead to larger sizes around 1.7 nm, and lower temperatures give rise to smaller sizes of approximately 1.5 nm. Fig. 3 shows RNA has a higher melting temperature than DNA.
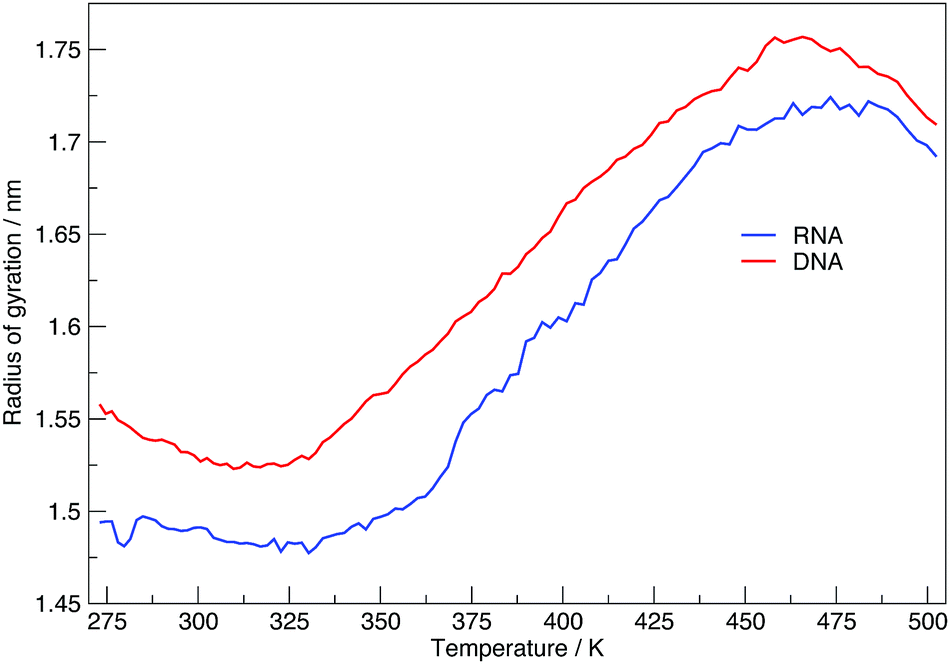 | ||
| Fig. 3 Melting plot of average radius of gyration, at each replica temperature. | ||
The virtual intensity is a simulated property that calculates the fluorescence intensity, often used in an experiment to measure folding rates and melting temperatures. It uses the end-to-end distances calculated at each replica temperature to calculate a “virtual intensity”, as we described in the Methods section. Fig. 4 shows the normalised virtual intensity at each temperature. The simulated melting curves for DNA and RNA display the two phase trend that is commonly seen in melting curves of biomolecules.21 The plot in Fig. 4 depict a difference in melting temperature between DNA and RNA of 6.84 K. Of the sequences we have simulated, RNA has a higher melting temperature than DNA.
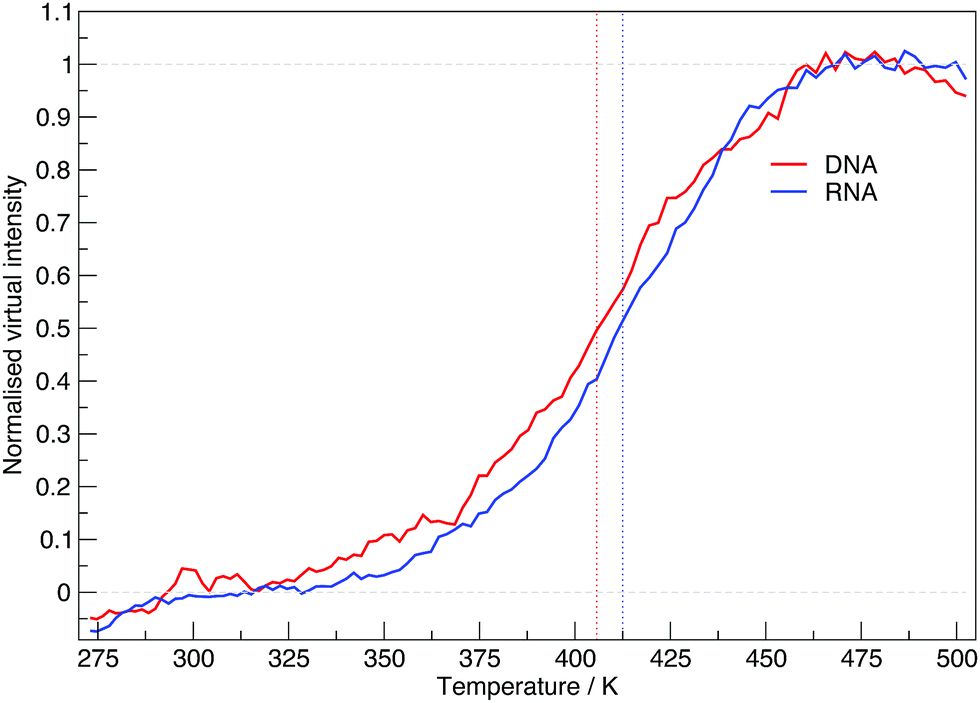 | ||
| Fig. 4 The normalised virtual intensity at each replica temperature for DNA and RNA. DNA exhibits a lower melting temperature than RNA with both systems demonstrating a typical melting curve of the form we see in experimental findings. Vertically running dotted lines indicate the mid-point of the melting curve for DNA at 405.69 K and RNA at 412.53 K. | ||
The temperature dependence of the distribution of end-to-end for DNA and RNA is shown in Fig. 5. The figure shows the type of dependence we see in Maxwell–Boltzmann distributions of molecular kinetic energies at different temperatures, given by the Arrhenius equation: 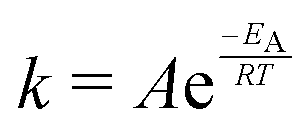 . As the temperature increases the average end-to-end distance increase (from 1.9 to 2.5 nm) and the standard deviation increases, as shown by the broader distribution at higher temperatures.
 | ||
| Fig. 5 Normalised density distribution of end-to-end distances for (A) DNA and (B) RNA at three different temperatures, 300.00, 387.76 and 475.97 K. | ||
Fig. 6 shows the average number of intra-molecular hydrogen bonds at each temperature. Hydrogen bonds were determined based on cutoffs for the angle hydrogen–donor–acceptor and the distance donor–acceptor. OH and NH groups are regarded as donors, O and N as acceptors. RNA, on average, has over twice the number of hydrogen bonds than DNA. At 300.00 K RNA has 26 and DNA has 12. The increased number of hydrogen bonds can be attributed to the –OH donor group present in RNA in the 2′ position of the ribose, that is not replaced by a –H acceptor group in DNA. The increase in the number of hydrogen bonds can also be ascribed to the increased stability of adenine–uracil pairs over adenine–thymine pairs in DNA.38 The increased number of hydrogen bonds in RNA, and the added stability of adenine–uracil base pairs counters the electrostatic repulsion between phosphate backbone groups allowing RNA to have a smaller, more compact, conformation, which is reflected in the smaller radius of gyration of RNA in Fig. 3.
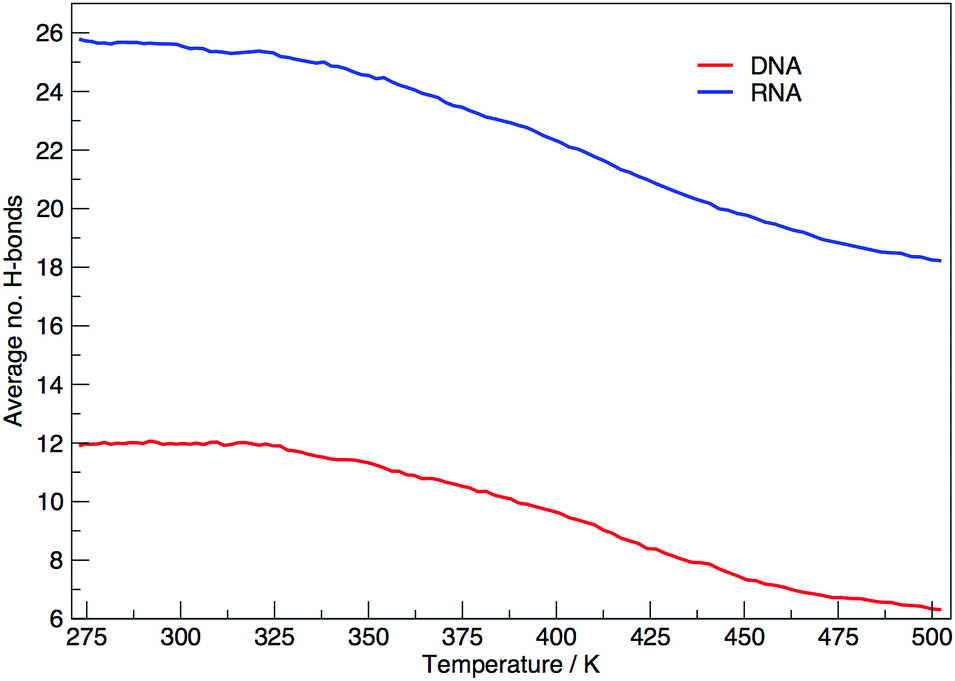 | ||
| Fig. 6 Average number of hydrogen bonds at each replica temperature. | ||
3.2 Exploring the free energy landscape at different temperatures
To build a picture of the conformational landscape depicting the distribution of all structures accessible at 300.64, 387.76 and 475.97 K, we have calculated the radii of gyration and end-to-end distance of molecular dynamics frames and plotted the free energy in Fig. 7 (also see ESI,† Fig. S3). We selected the three temperatures from the plot of virtual intensity in Fig. 4 as they correspond to the two-state phase transition and the mid-point. Biomolecular processes, such as folding or aggregation, can be described in terms of the molecule's free energy| ΔG(R) = −kBT[lnP(R) − lnPmax] | (8) |
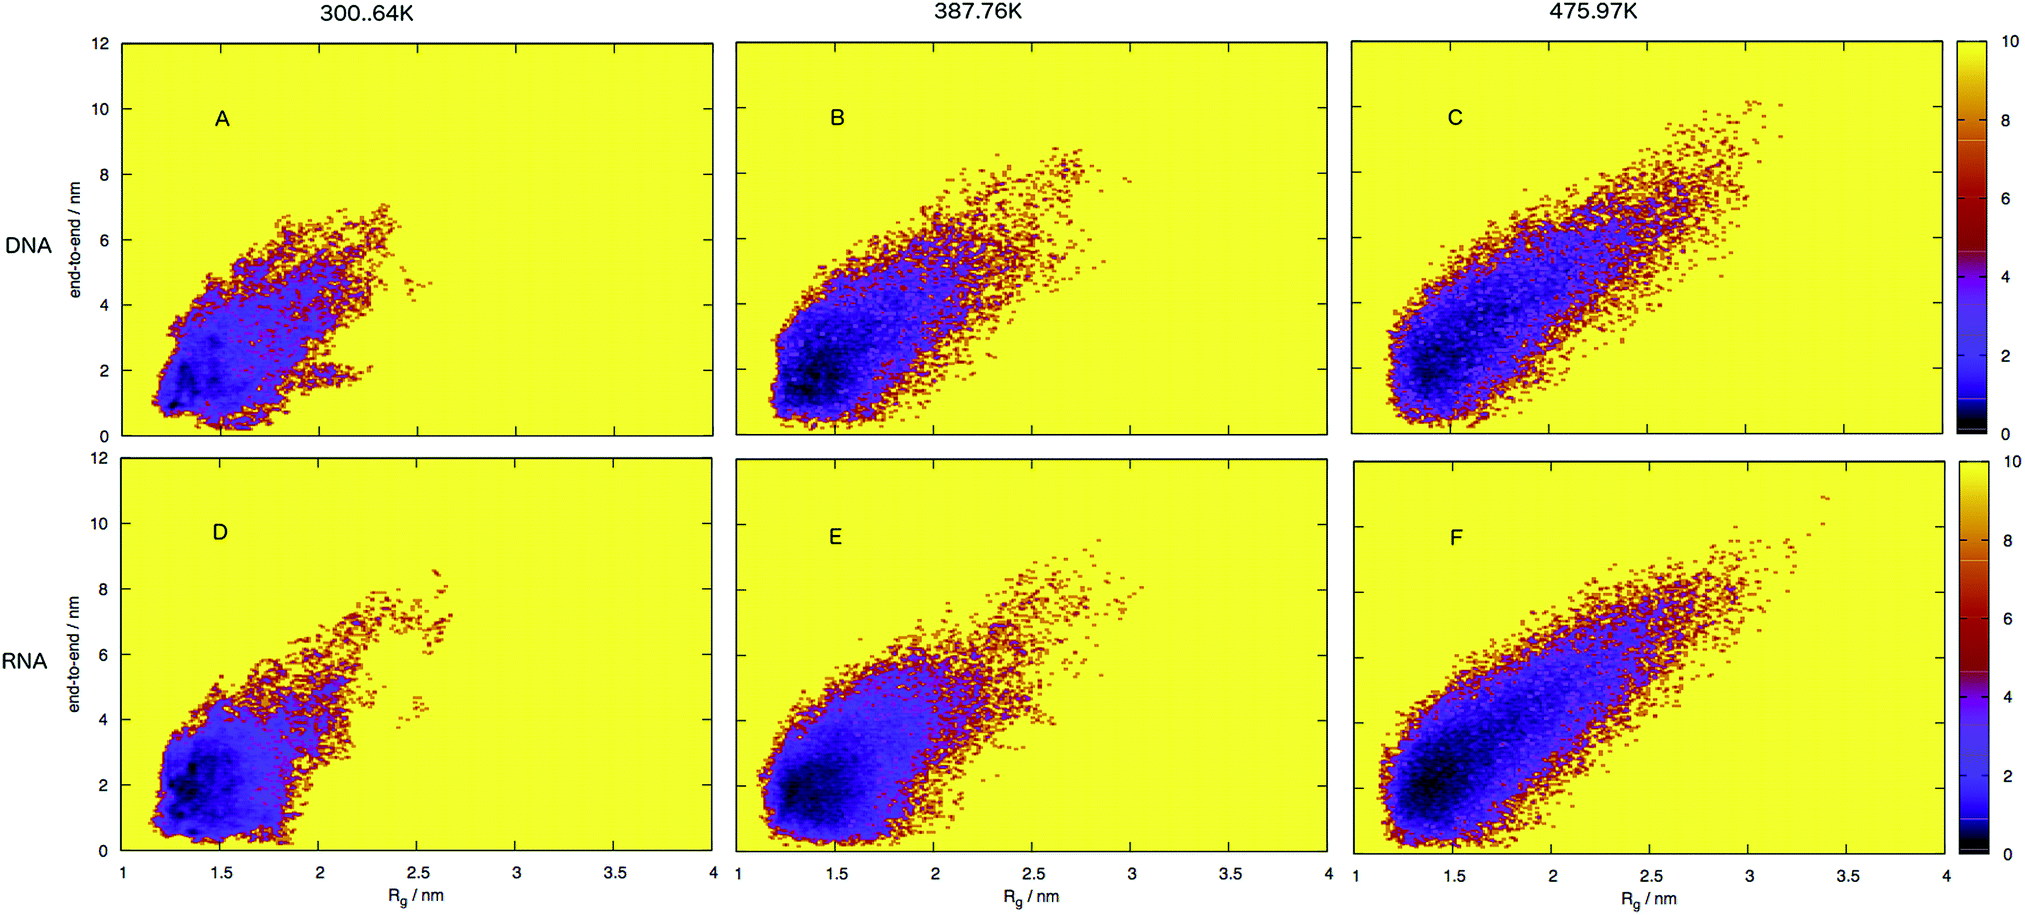 | ||
| Fig. 7 Free energy surface for DNA (A–C) and RNA (D–F), shown as end-to-end distances and radius of gyration sizes at three different temperatures. Note that RNA occupies a narrower portion of the conformational space, which corresponds to structures which have smaller distances and sizes compared to DNA, that is spread over a broader area of conformational space with larger distances and sizes. The free energy landscapes indicate that RNA conformations are more compact than DNA which occupies more of the surface that corresponds to a larger and more unfolded structure. | ||
An initial inspection of these free energy landscapes indicates DNA and RNA occupy visibly different portions of conformational space. In terms of end-to-end distances and radius of gyration, DNA can possess relatively small globular structures (of Rg 1.25 nm and e2e of 0.1 nm) and long elongated forms (of Rg 3.5 nm and e2e of 11 nm), as well as a range of lengths and sizes in between. RNA on the other hand occupies a comparatively smaller portion of conformational space, with Fig. 7 displaying a range of accessible structures indicative of a folded polymer with a short length and a small size. In terms of free energy, the most stable conformations appear between ΔG = 0–2 kJ mol−1 (visible as black regions in the free energy surface in Fig. 7). This low energy region is visibly much smaller in Fig. 7A than B. This indicates that RNA can adopt many more low energy (ΔG = 0 − 1 kJ mol−1) conformations than DNA. Alternatively, DNA can adopt many more higher energy conformations that appear between ΔG = 2–6 kJ mol−1 (visible as purple regions) than RNA, which correspond to longer end-to-end distance and larger radius of gyration. This trend continues at higher temperatures.
Both the free energy landscapes for DNA and RNA resemble that which we traditionally think of for folded proteins. Proteins show similar properties to nucleic acids and historically there has been more effort devoted to their understanding. The landscapes resolved for proteins will often show a single area of high density surrounded by less dense regions.39 This often appears as a “funnel” type landscape with a low energy minimum. Closer inspection of the free energy landscapes reveals subtle differences in the density around the minimum. The low energy, dense region (seen as red-to-black in Fig. 7) exhibits a much smoother basin for DNA. RNA has a comparatively rugged energy minimum. In effect, this means RNA has a propensity to form a variety of meta-stable conformations with low barriers between states. DNA conversely, has a single low energy conformation and therefore less diversity in low energy conformations.
RNA has the ability to form a variety of low energy, secondary structures through Watson–Crick hydrogen bonding, non-Watson–Crick hydrogen bonding, and π−π stacking between adjacent and non-adjacent bases.
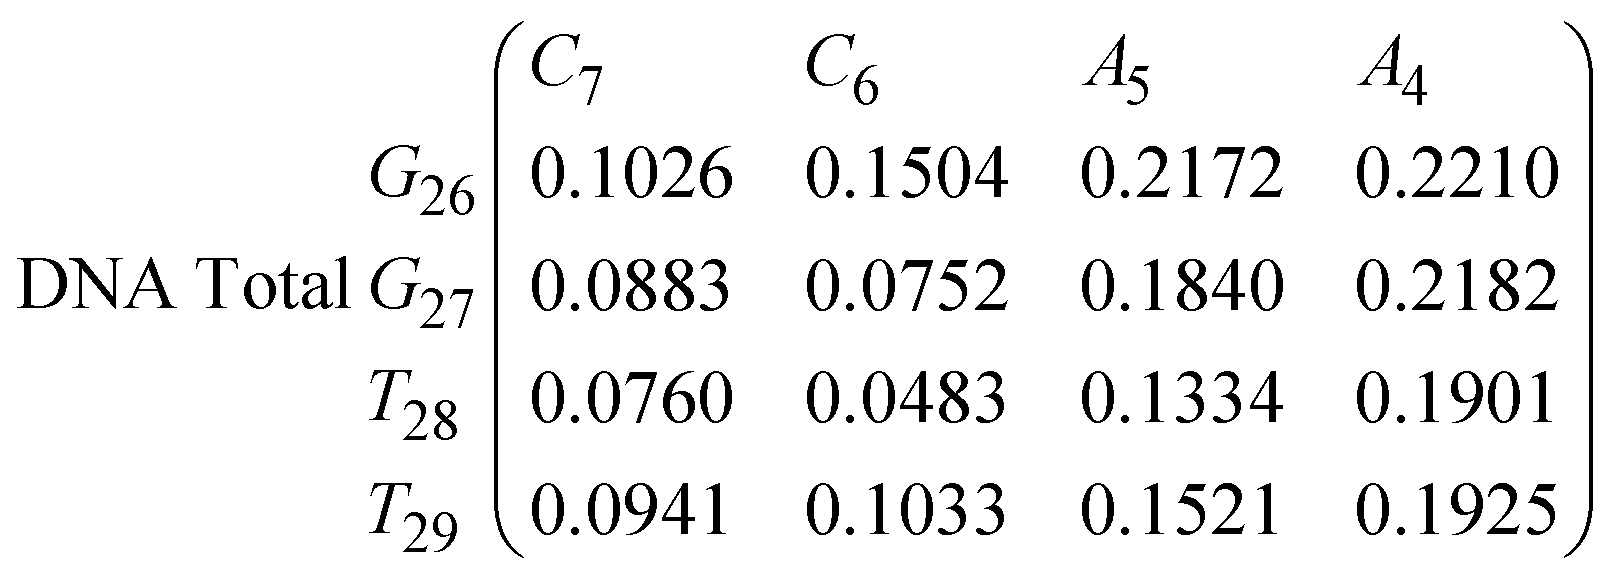
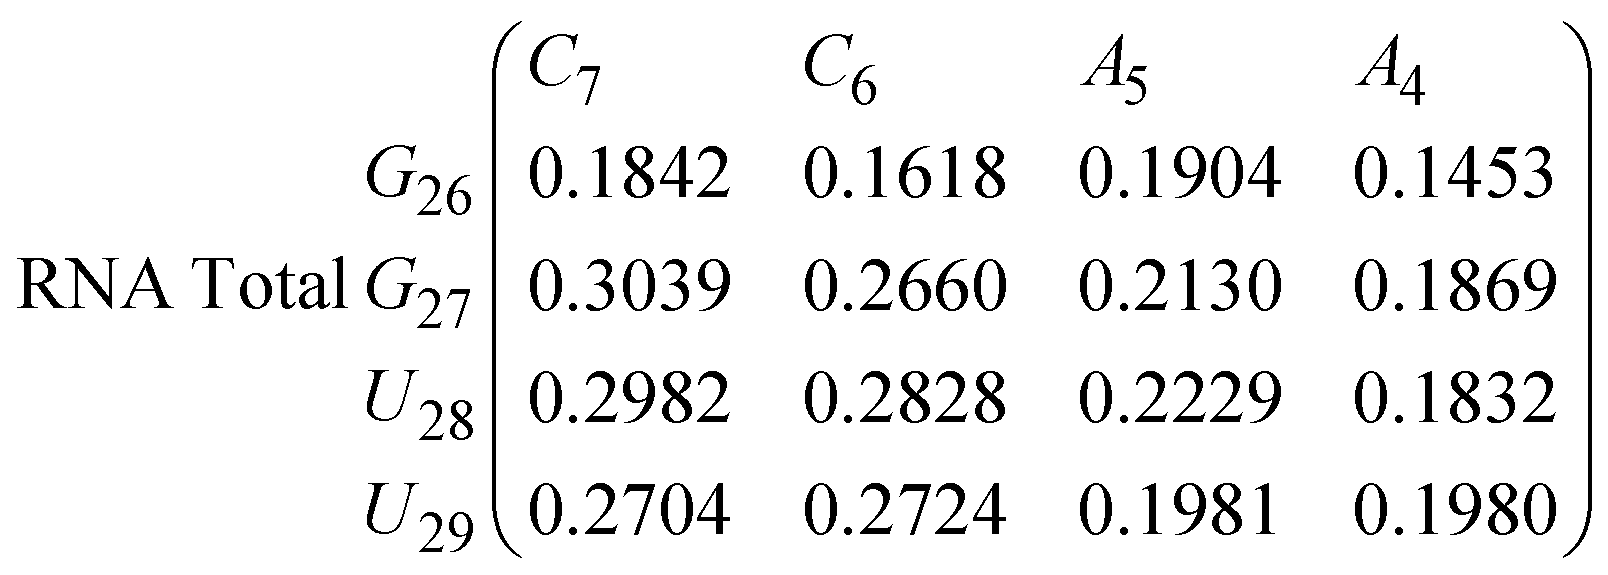
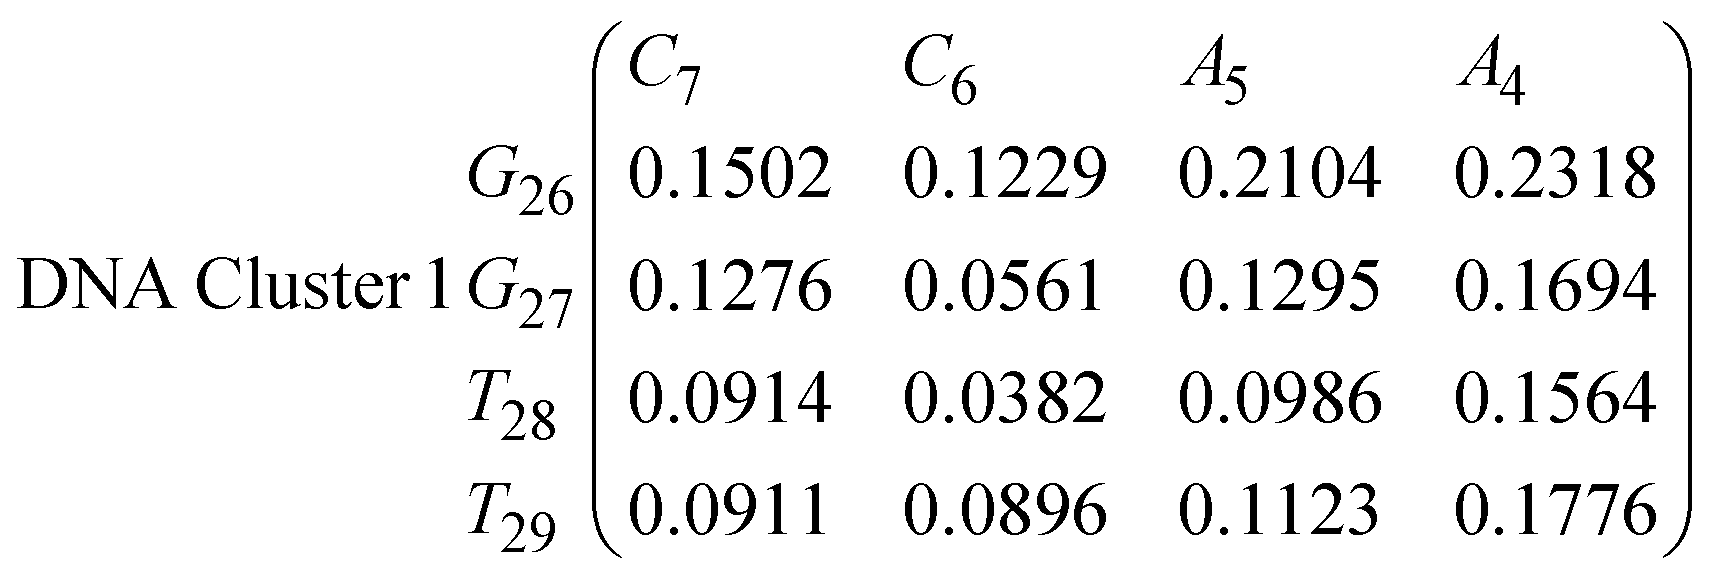
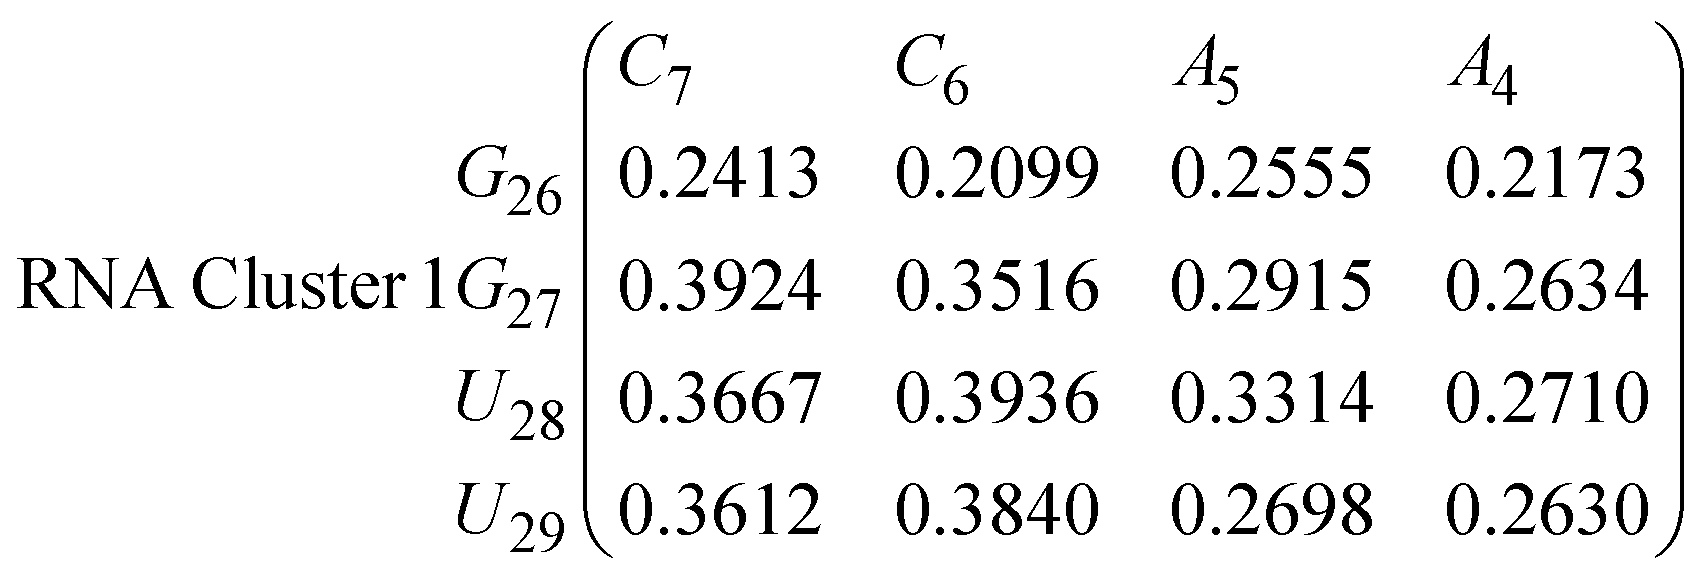
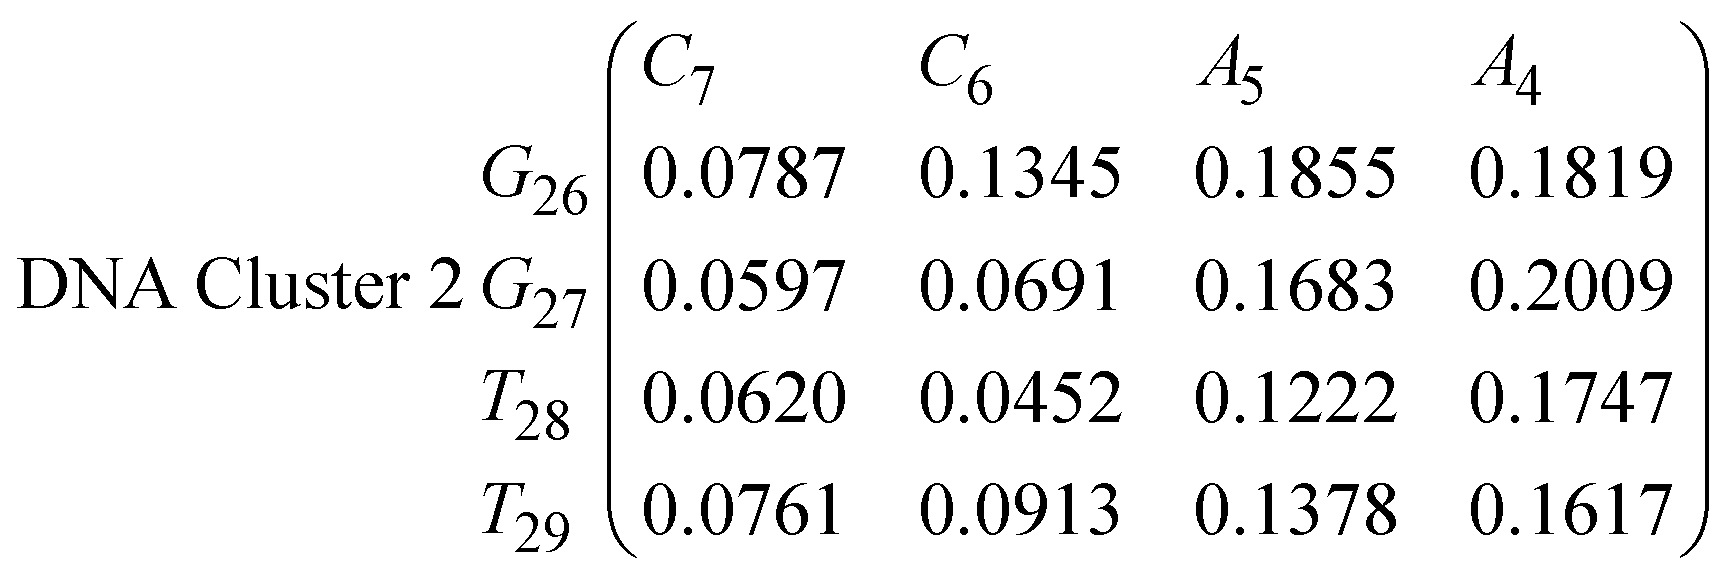
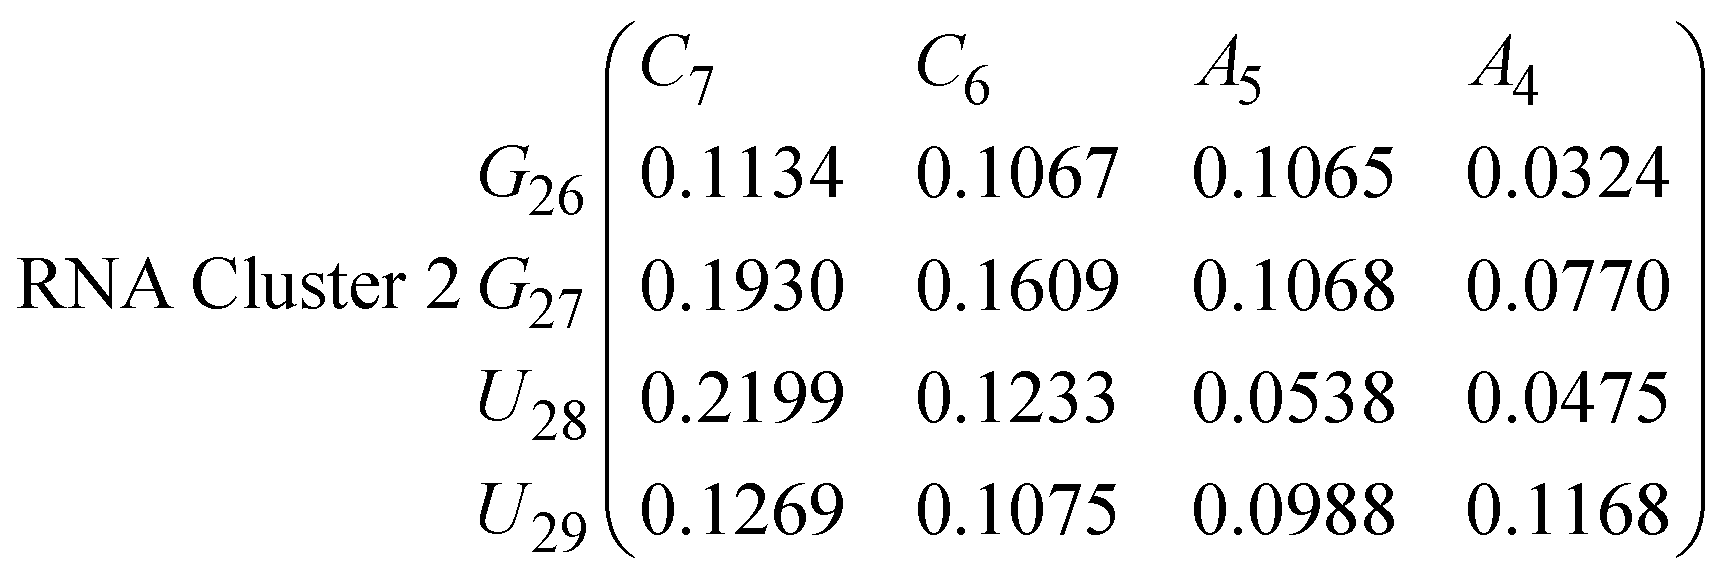
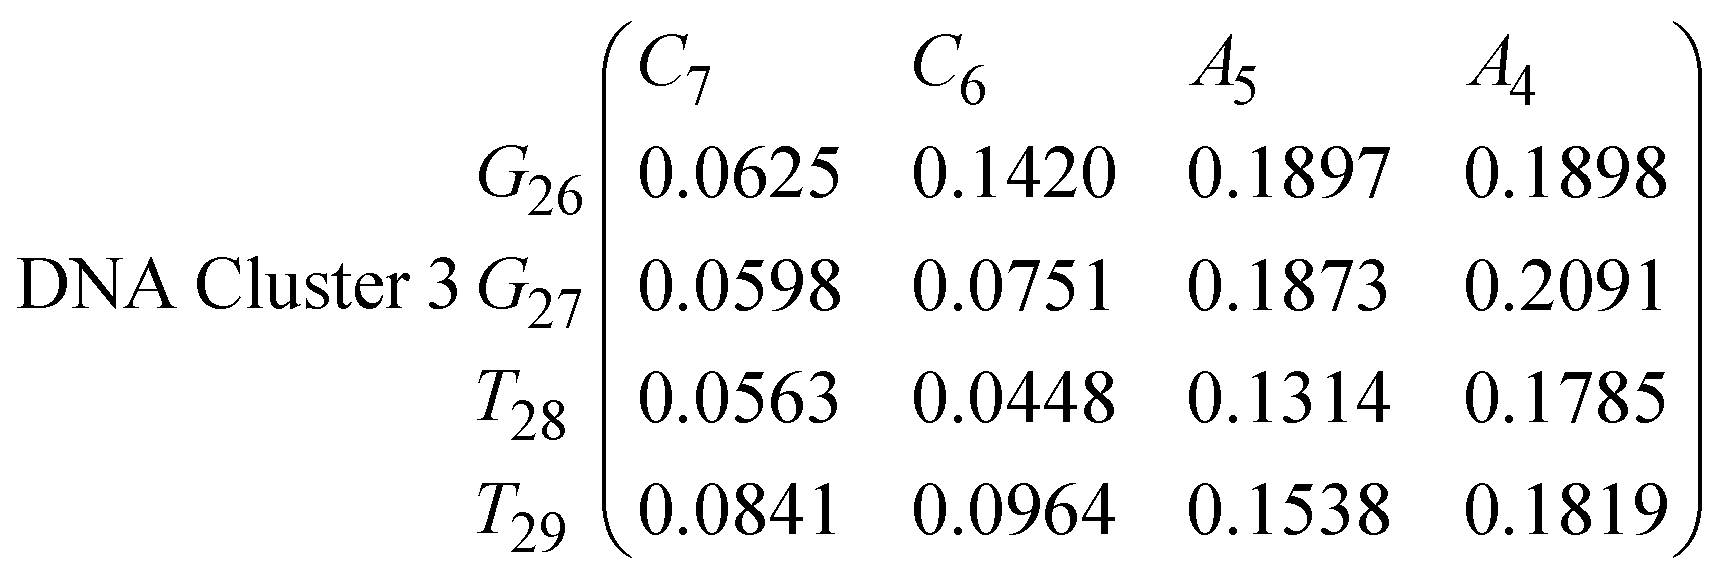
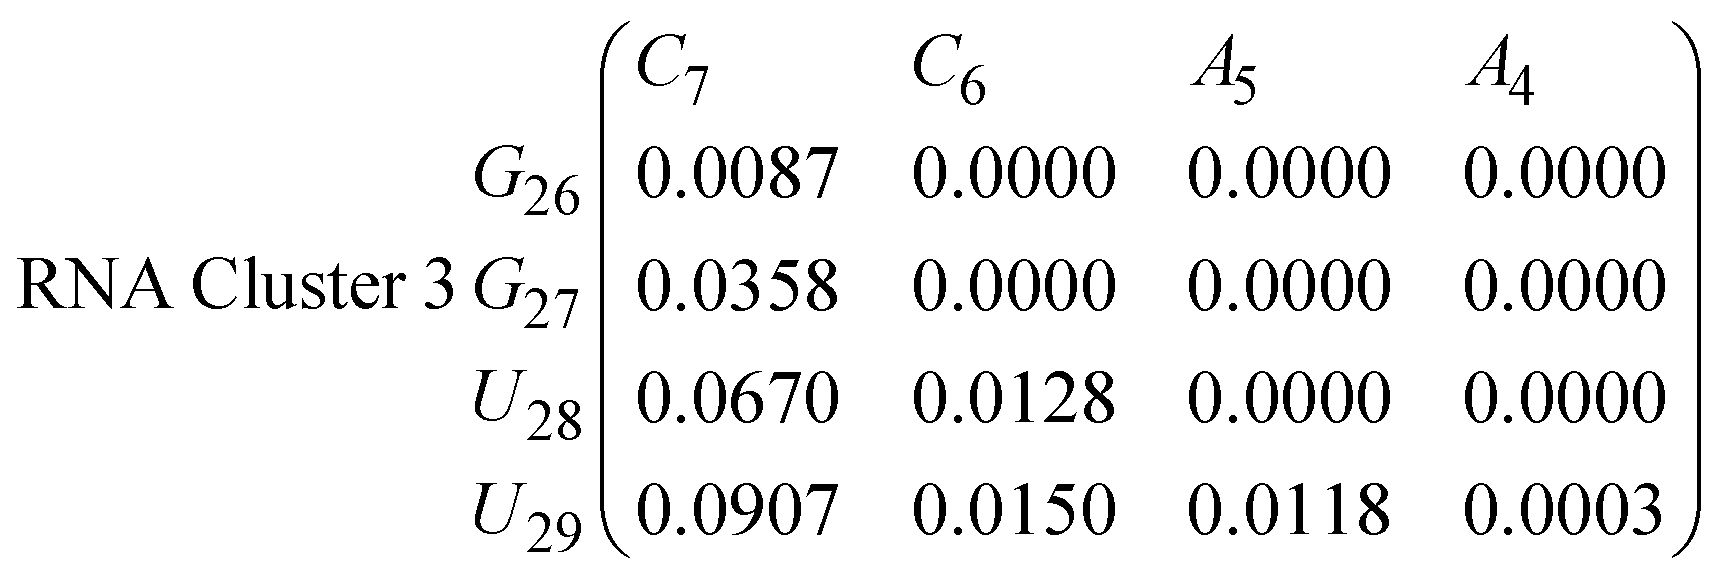
In Fig. 8 we show the mean smallest distance between residue pairs. We also give the probability of binding between the residue pairs within the stem region of the hairpin for DNA in eqn (9) and RNA in eqn (10). The mean distance matrix in Fig. 8 and probabilities in eqn (9) and (10) give us an understanding as to types of hairpin loop structures formed by these two analogous nucleic acid sequences. The probabilities, on the most part, are higher for RNA in this stem region compared to DNA, with the GC pairs appearing more favourable. The off-centre elements of Fig. 8 are not symmetrical in these systems, which comes as no surprise given the ideal structures theorised in Fig. 1, where the stem region is not between the end residues but instead there is a tail of 3 residues at the 5′ end.
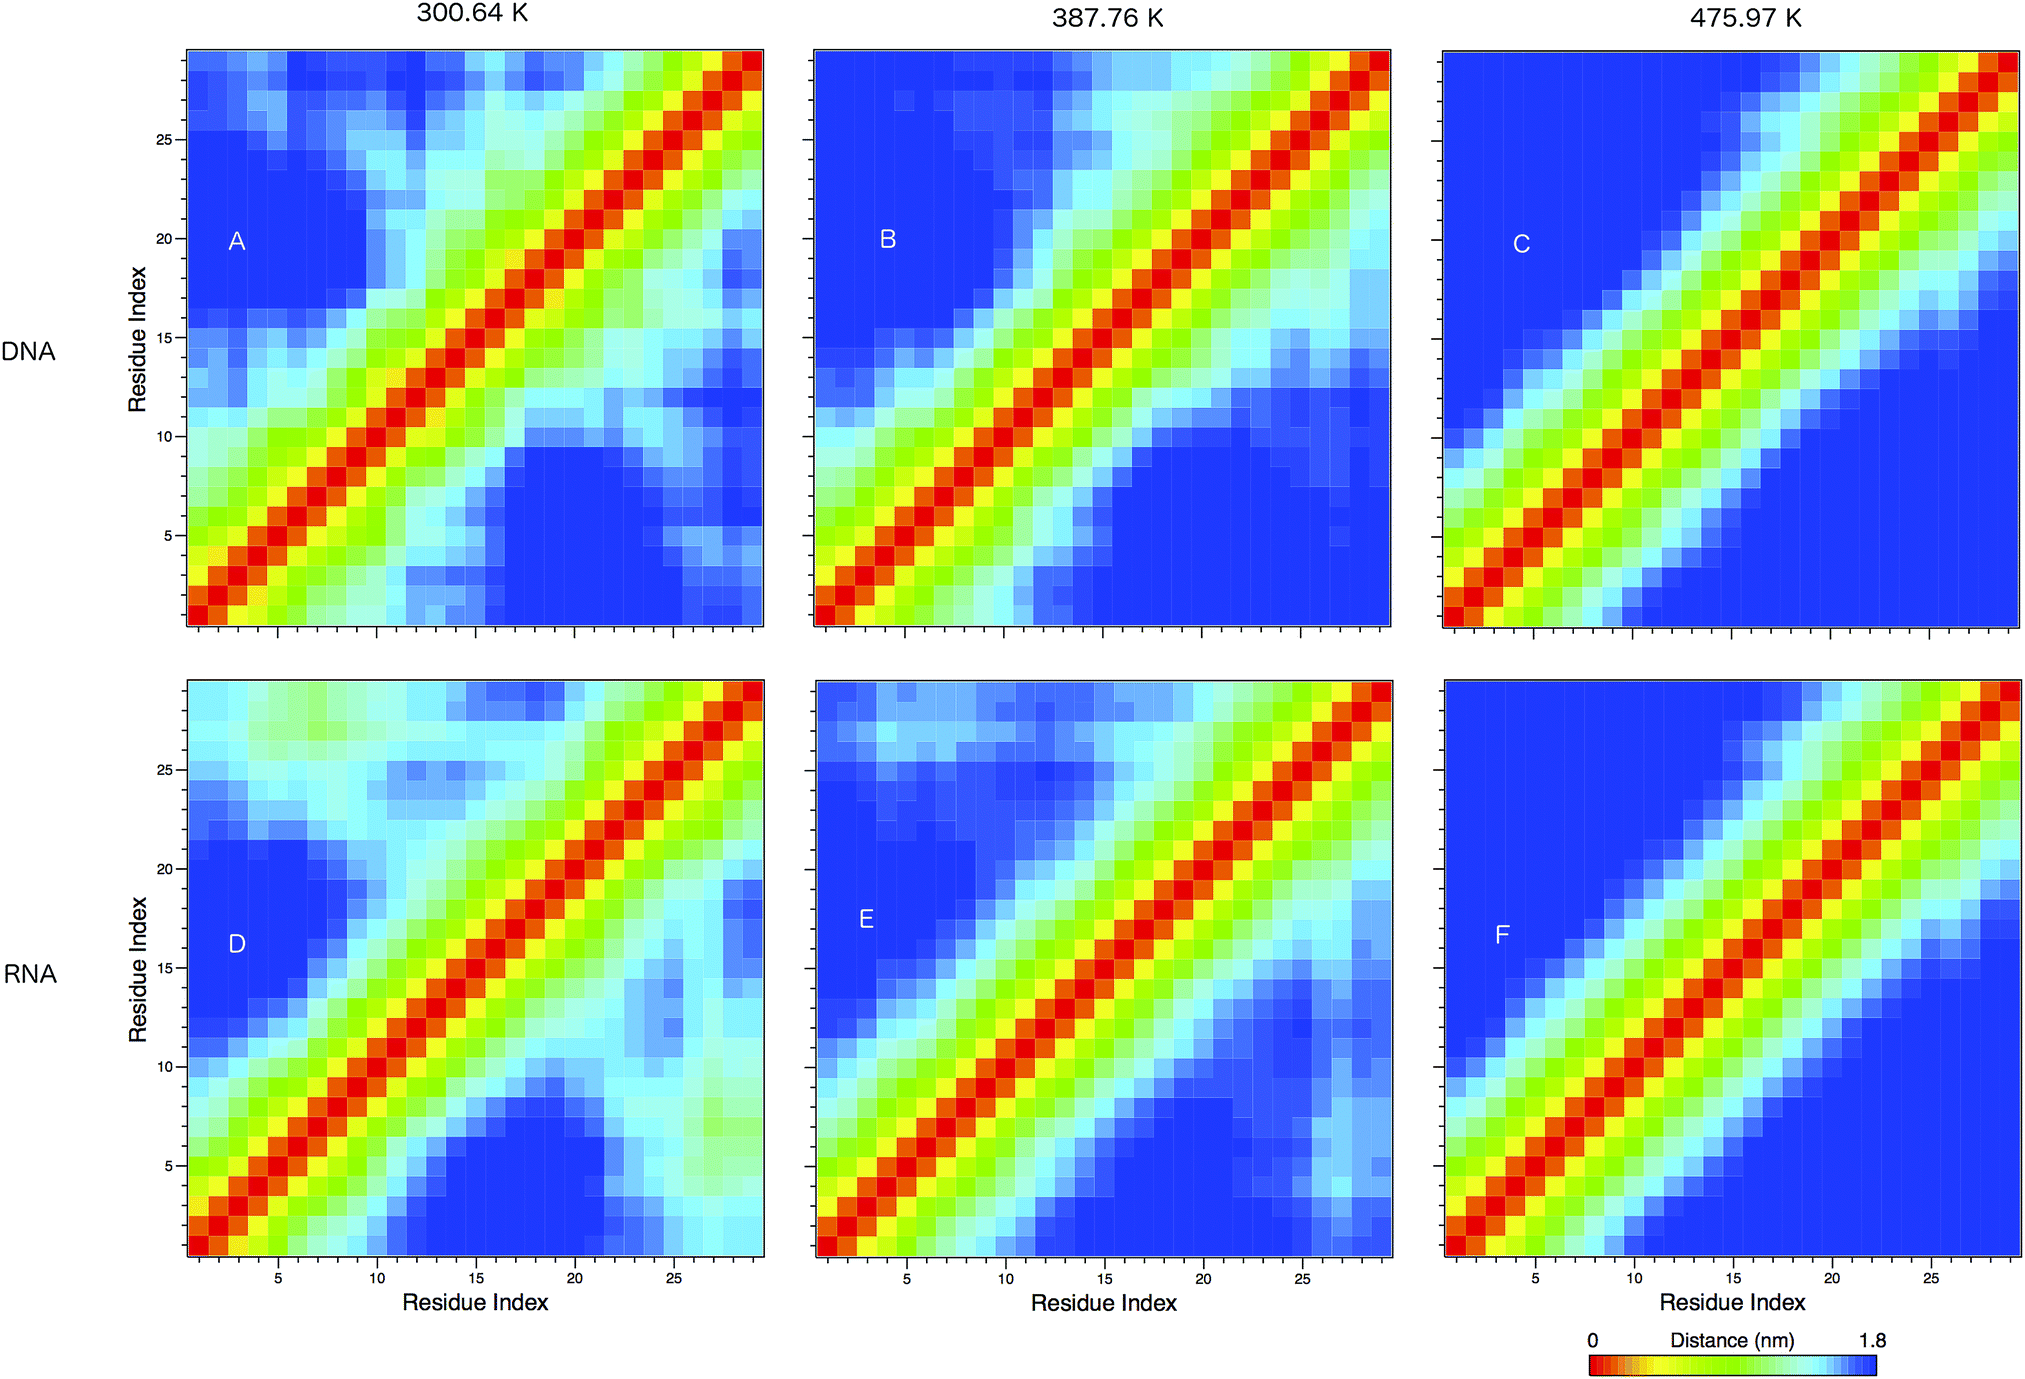 | ||
| Fig. 8 The mean smallest distance between residue pairs in (A–C) DNA and (D–F) DNA, shown at 300.64, 387.76 and 475.97 K. The red elements show the same residue, and yellow elements show adjacent residues. Islands of colour in the bottom right and upper left portions of the matrices show likely secondary structural motifs, such as the formation of the hairpin loop. | ||
3.3 Local structure effects on persistence length
Persistence length gives us information on how flexible the nucleic acid polymer chain is in nucleic acids. The persistence lengths of the DNA and RNA sequence in this study have been calculated and shown in Fig. 9. Fig. 9(A) displays the average persistence length at each temperature. It appears that temperature has little influence on persistence length, with both DNA and RNA reduced in length by 0.025 nm over 225 K. The distribution of persistence lengths given in Fig. 9(B) indicates that DNA has a shorter length than RNA, the same trend that has been observed by transient electric birefringence methods.40 The origins of this added stiffness are due to the 2′-OH group which can form a hydrogen bond with the O4′ atom of the neighbouring 3′ ribose, which stabilises and stiffens the structure.1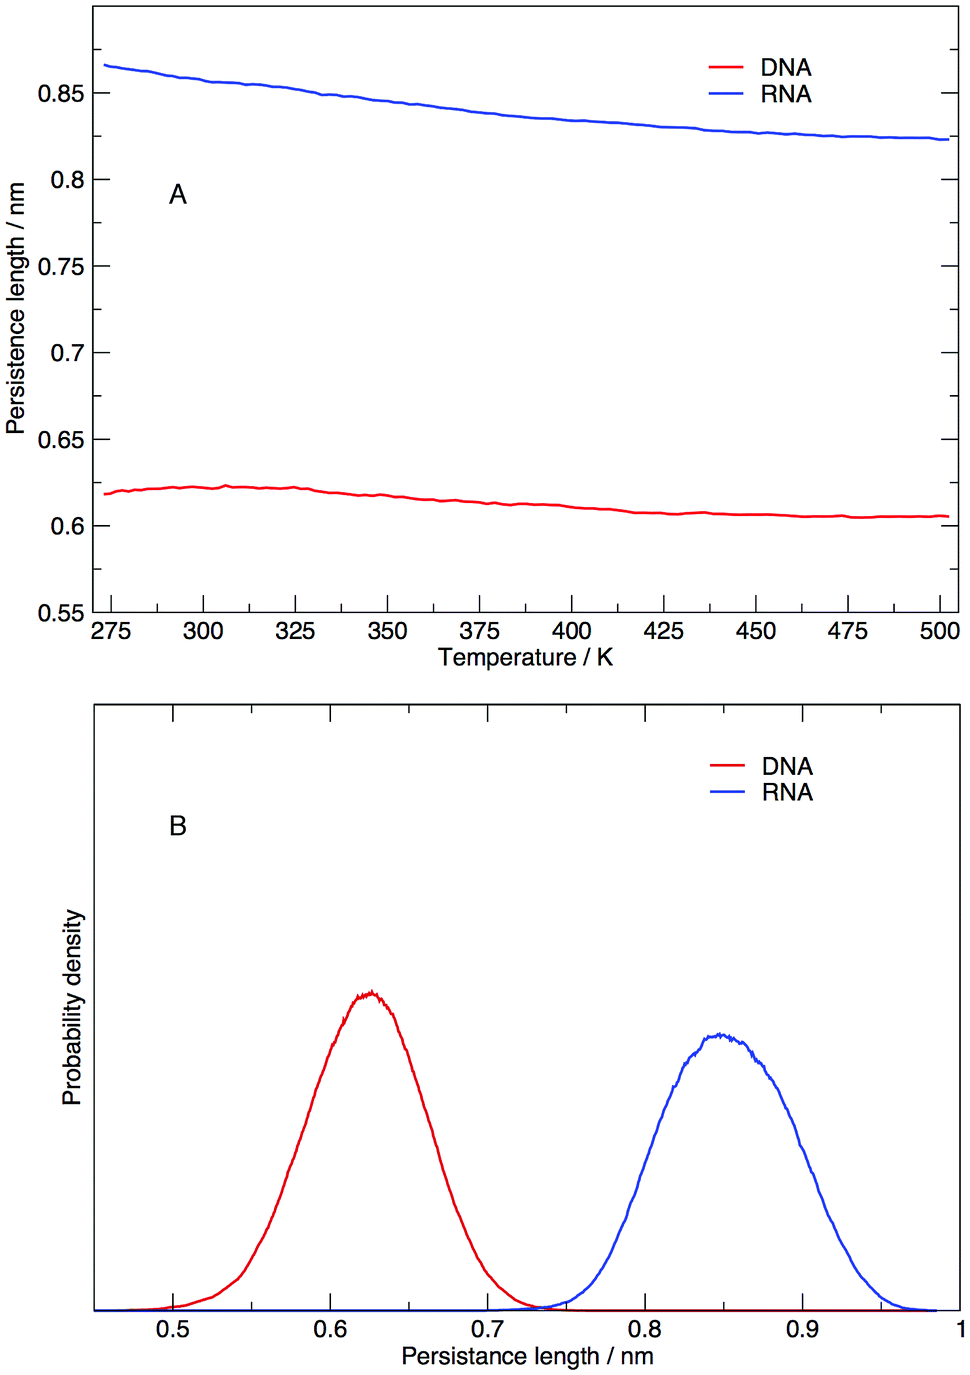 | ||
| Fig. 9 (A) Average persistence lengths or DNA and RNA at each temperature and (B) distribution of persistence lengths at 273.00 K. | ||
3.4 Identification of representative structures at ambient temperature
The results hereinafter represent the DNA and RNA hairpin loops at 300.64 K. To peer more closely at the diversity of structures shown in the free energy landscapes in Fig. 7, we separate all of the structures in to groups of similar structures using k-means RMSD clustering (with a cluster radius of 15 Å). In both RNA and DNA systems the clustering process identified three major cluster groups. The clusters are numbered in ordered of smallest average radius of gyration to largest. The populations of the three structural clusters for DNA and RNA are given in Table 1. The three clusters for DNA are almost equally populated but for RNA Cluster 1 is dominant and the population of Cluster 3 is minor. This also indicates that RNA is more confined in a smaller conformational space. We plotted the first two principal components of motion for DNA and RNA using a concatenated trajectory of backbone atoms so that we could project the trajectory on to the same eigenvectors, making the axes in Fig. 10(A and B) comparable. The projections were identified as belonging to one of the structural clusters and coloured accordingly. Fig. 10 shows three distinct clusters for both DNA and RNA.| DNA cluster | Population |
|---|---|
| 1 | 0.2942 |
| 2 | 0.3265 |
| 3 | 0.3793 |
| RNA cluster | Population |
|---|---|
| 1 | 0.6263 |
| 2 | 0.2850 |
| 3 | 0.0891 |
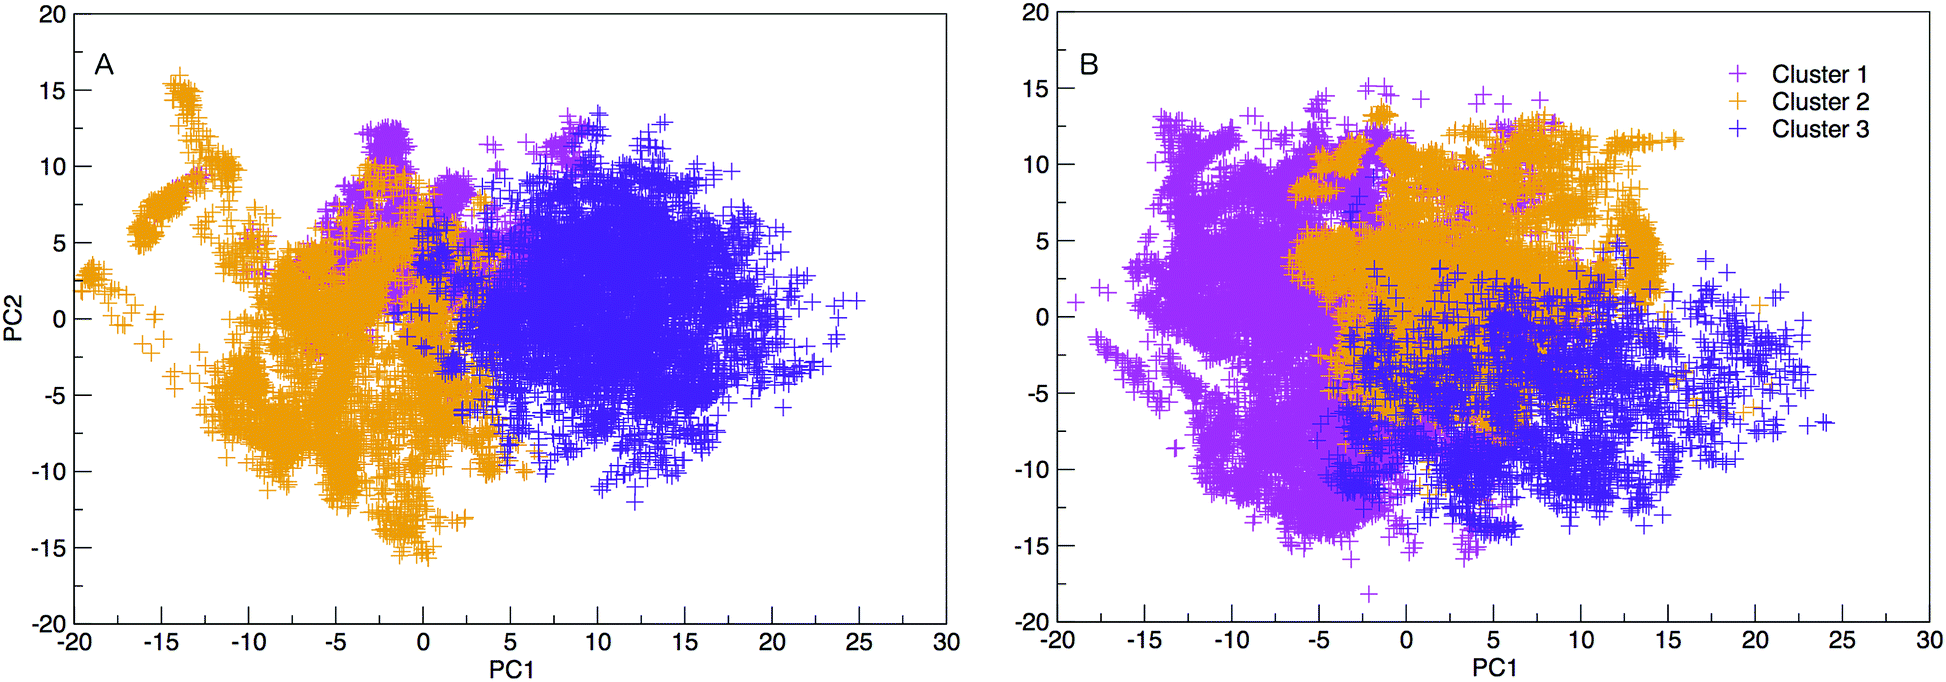 | ||
| Fig. 10 2D projection of trajectory on eigenvector 1 and 2 (PC1 and PC2), coloured according to cluster categorisation for DNA and RNA. The variance of eigenvalues of the covariance matrix are 18.016 and 11.470% for PC1 and PC2. | ||
Each cluster has been shown as the contribution to the distribution of radius of gyration in Fig. 11, along with the total distribution. The integrated values compare directly to the cluster populations given in Table 1.
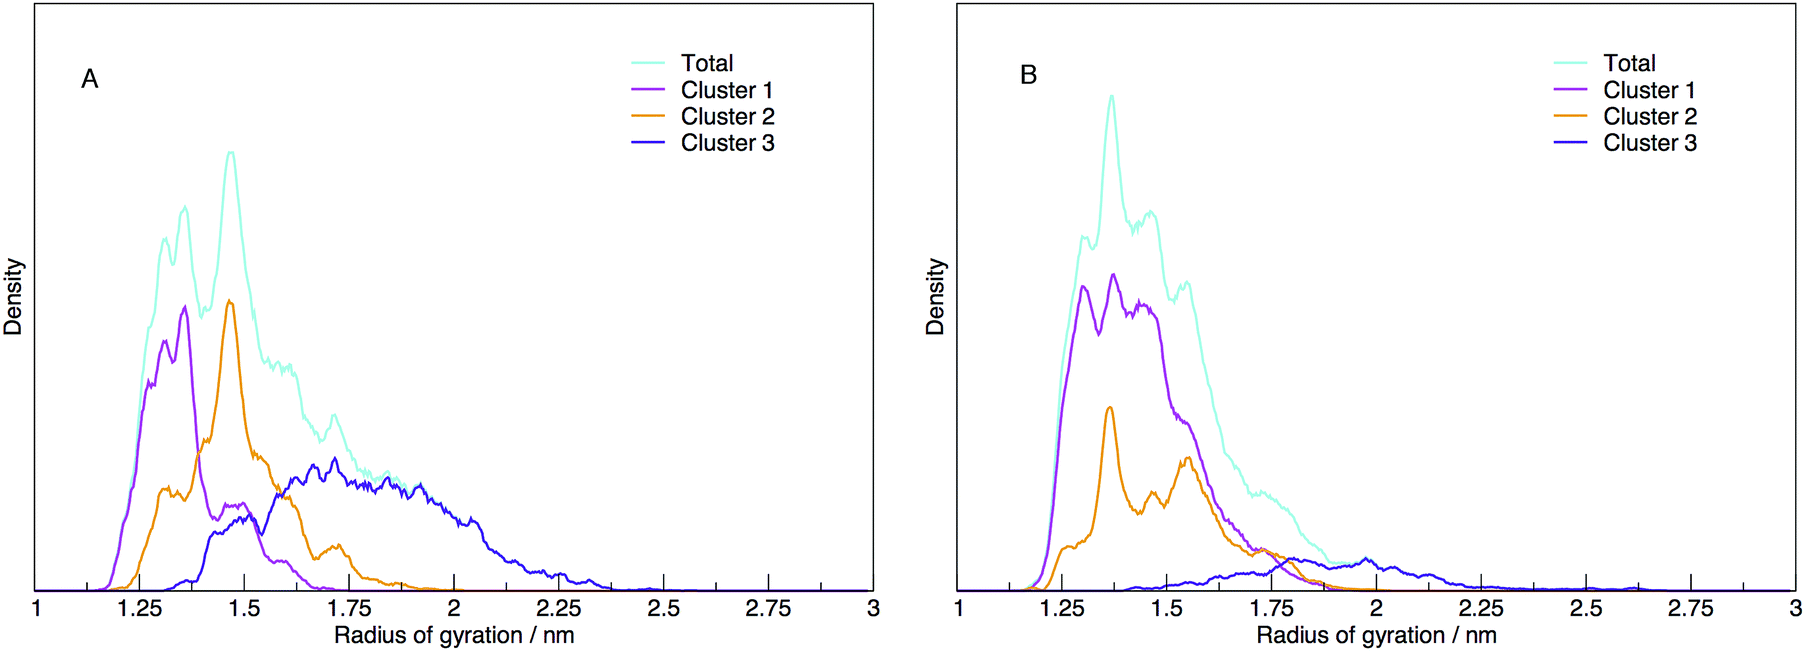 | ||
| Fig. 11 The distribution of radii of gyration shown as the total density (cyan) and the contribution to the density of structures identified as belonging to three distinct clusters (magenta, orange and violet for Cluster 1, 2 and 3), for (A) DNA and (B) RNA. DNA exhibits a number of well defined peaks in the total distribution indicating that DNA has a number of stable structures. The clustering of the DNA structures reveals three distinct clusters that map well on to the radius of gyration. Alternatively, RNA shows a broader distribution of gyration which does not appear to be correlated to the radius of gyration. | ||
The structure that has the lowest root mean-squared deviation from the centre of the cluster is shown in Fig. 12. The three structures displayed for DNA and RNA in Fig. 12 are representative structures of each cluster, which we refer to as the ‘best member’.
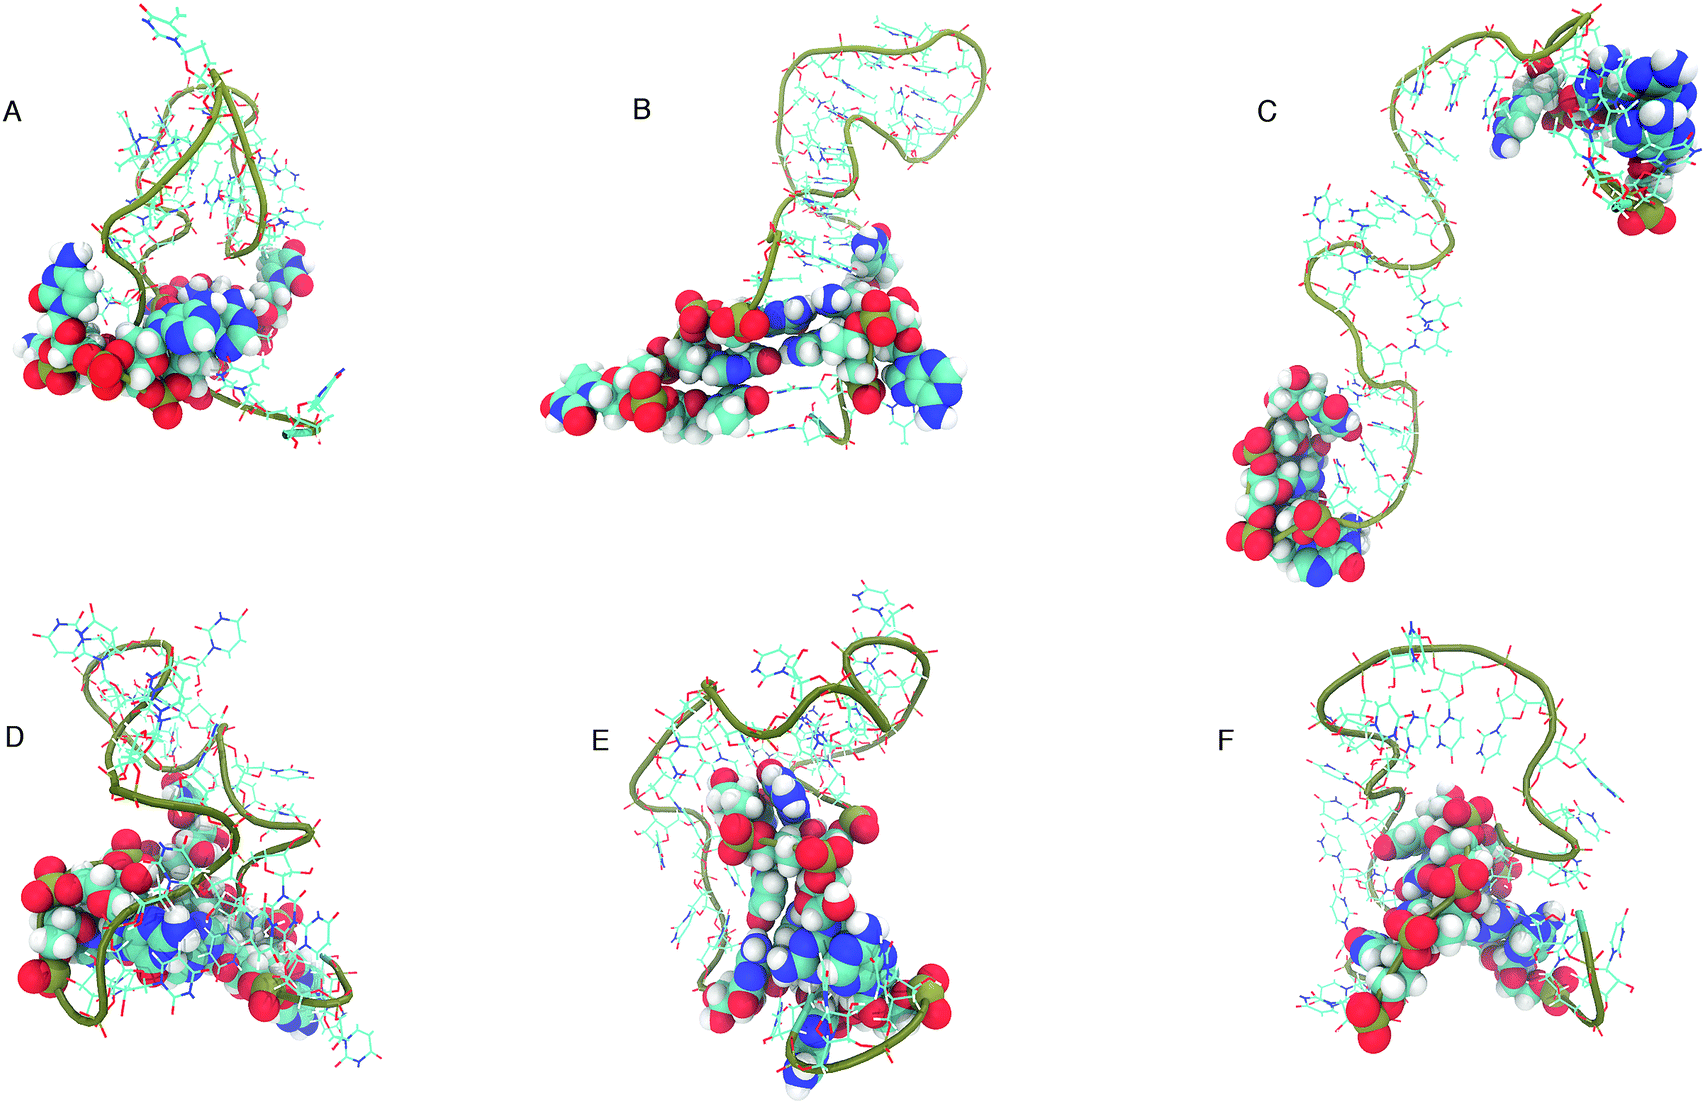 | ||
| Fig. 12 “Best member” structures, which correspond to the structure with the lowest RMSD from the centre of the cluster, for DNA (A–C) and RNA (D–F). Cluster 2 of DNA (B above) shows the structure closest to the ideal structure shown in Fig. 1. Cluster 3 of DNA (C) shows an unfolded/elongated structure. Atoms belonging to base residues in the four stem region pairs have been displayed as van der Waals radii, and phosphate backbone displayed as a tube. | ||
The clusters in Fig. 12 for DNA show far more distinct (non-overlapping) clusters than for RNA. This suggests that the formation of the aforementioned folded and unfolded structures are coupled to the radius of gyration of DNA, but less so for RNA. The ideal structure of the hairpin loops sequences we are studying here have been identified theoretically based on the base pairing and secondary structural prediction41 using the mfold web server.24 The theoretical secondary structure can be seen in Fig. 1. Both DNA and RNA hairpin loops exhibit a loop region consisting of 18 uracil or thymine bases, stabilised by a four base pair stem. Each structure has a tail of three bases at the 5′ end of the strand.
The best member conformations shown in Fig. 12 give us a much better view of the conformations formed by these nucleic acid sequences than the theorised ideal structure. This provides realistic high-resolution structures that can add insight into experimentally derived structures using X-ray crystallography to compliment FRET studies. As shown by the structure of Cluster 3 (Fig. 12 and Table 1), there is a significant population of completely unfolded structure even at room temperature, which may be related to the fact that DNA Cluster 1 is less stabilised by hydrogen bonds. On the other hand, RNA is confined to a more compact structure, which is stabilised by base pairing.
In eqn (9) and (10) we tabulate the probability of binding between residue pairs in the stem region of the hairpin loop (see Fig. 1 for numbering scheme). The values were calculated as the probability of the two residues being within 1.2 nm distance of one another, for example, the probability of C7 and G26 binding in RNA is 18.42%. Overall, the binding probabilities in RNA are higher than those of DNA, which corroborates the trend in hydrogen bonding we see in Fig. 6 and the difference in melting temperature observed in Fig. 3.
 | (9) |
 | (10) |
 | (11) |
 | (12) |
 | (13) |
 | (14) |
 | (15) |
 | (16) |
In eqn (11)–(16), we calculate the binding probabilities of residue pairs in the stem region for DNA and RNA with each of the structural clusters calculated previously. As shown in Fig. 11, the size of the structures in Cluster 1 are smaller then those in Cluster 3, based on the radius of gyration. This is in agreement with the binding probabilities for Cluster 1 (eqn (11) and (12)), which is higher than Cluster 2 (eqn (13) and (14)) and than Cluster 3 (eqn (15) and (16)). The binding probabilities follow the trend Cluster 1 > Cluster 2 > Cluster 3.
Eqn (12) shows significantly large “off diagonal” probabilities, which suggest existence of multiple energy minima in the RNA hairpin within confined native state, represented by Cluster 1. In contrast, the DNA hairpin has a broader conformational distribution even in the native state as shown in Table 1. One possible reason for this is that DNA can form less base pairs, as shown in eqn (11) and is less stabilised enthalpically compared to the RNA hairpin.
4 Conclusions
In this work, we have investigated the temperature-dependent conformation of DNA and RNA hairpin loops by temperature REMD. Although both DNA and RNA clearly exhibit two-state-like temperature transitions, as indicated by the radius of gyration and virtual FRET intensity, the actual conformational ensembles contain significantly different structures, even at room temperature (see Fig. 12). The local structure of the DNA polymer is more curved, as shown by the shorter persistence length compared to RNA, however, DNA adopts larger structures which contain conformations with many different sizes, even at room temperature. In contrast, local structure of RNA is less curved, but it adopts a more compact form at room temperature. This feature may be important if RNA has enzymatic function because structure specificity is an essential feature for substrate specificity. Another important feature identified for RNA is multiple conformational substates in the native state. In the case of proteins, transitions among conformational substates are thought to be essential for function.42–44 This work shows that RNA is similar to protein in this regard.Given the binding probabilities and the identified cluster structures, plus the distribution of persistence length, it is likely that the hairpin formation in RNA is stabilised by the formation of base pairing in the stem region, whereas the formation of a hairpin structure in DNA is formed because of the mechanical rigidity of the polymer. This would corroborate the difference in melting temperature between DNA and RNA, where a higher number of hydrogen bonds would need to broken within the stem region of RNA, meaning higher temperatures are needed to break up the bonding network leading to an increase in both end-to-end distance and radius of gyration.
The shorter persistence length in DNA generates a helical structure that we are more used to seeing in duplex DNA. The helical structure we can observe in the best member structures for DNA in Fig. 12B and C exhibit a right handed B-form which we can see from the incline of the base pairs to the axis (−1.2°), the number of base pairs per turn (10.5) and the size of the major and minor grooves (22, 12 Å).45 RNA, with its longer persistence length, does not display any A- or B-form helical style, but rather adopts many shorter kinks and grooves (as shown in Fig. 12D–F).
The stiffness of the DNA polymer allows it to form well defined helical structures, ideal for forming complementary duplex structures and conserving base sequence, as well as forming higher level tertiary supercoiled structures.46 The RNA structure, on the other hand is ideal for forming complexly folded conformations for the purpose of carrying out catalytic biochemical processes, i.e. RNA enzymes (ribozymes).15
A popular theory in origins of life studies is the “RNA world hypothesis”,47 in which it is thought that there was a biology based entirely on RNA, with DNA and proteins occurring later on. It is an attractive theory as RNA has the ability to replicate genetic information and catalyse biochemical reactions – the roles of DNA and proteins in modern biology. Our findings suggest that if the RNA world did once exist, DNA may have evolved in such a way as to have a shorter persistence length in order to maintain well defined B-form helical structure to make the duplex form more stable. RNA and proteins, with a longer persistence length, better able to form complex folded tertiary structures which can perform biochemical reactions, such as phosphodiester bond cleavage reactions in the Hammerhead ribozyme.15
Conflicts of interest
There are no conflicts to declare.Acknowledgements
This research was supported by Grant-in-Aid for Scientific Research on Innovative Areas No. 25104002 and 15H04357 to A. K. and No. 23107732 to K. I. and No. 25104005 to T. T. from Japan Society for the Promotion of Science and The Ministry of Education, Culture, Sports, Science and Technology (MEXT) of Japan. This research was also supported by MEXT as “Priority Issue on Post-K Computer” (Building Innovative Drug Discovery Infrastructure Through Functional Control of Biomolecular Systems) to A. K. The computations were partly performed using the supercomputers at Institute of Solid State Physics, The University of Tokyo and the Research Center for Computational Science, The National Institute of Natural Science.References
- M. Daune, Molecular biophysics: structures in motion, Oxford University Press, 1999 Search PubMed.
- M. J. Fedor and J. R. Williamson, Nat. Rev. Mol. Cell Biol., 2005, 6, 399 CrossRef CAS PubMed.
- J. D. Watson and F. H. Crick, et al. , Nature, 1953, 171, 737–738 CrossRef CAS PubMed.
- Ø. Olsvik, J. Wahlberg, B. Petterson, M. Uhlen, T. Popovic, I. Wachsmuth and P. Fields, J. Clin. Microbiol., 1993, 31, 22–25 Search PubMed.
- E. Pettersson, J. Lundeberg and A. Ahmadian, Genomics, 2009, 93, 105–111 CrossRef CAS PubMed.
- P. Balbás, X. Soberón, E. Merino, M. Zurita, H. Lomeli, F. Valle, N. Flores and F. Bolivar, Gene, 1986, 50, 3–40 CrossRef.
- J. Zhao, A. Bacolla, G. Wang and K. M. Vasquez, Cell. Mol. Life Sci., 2010, 67, 43–62 CrossRef CAS PubMed.
- D. Bikard, C. Loot, Z. Baharoglu and D. Mazel, Microbiol. Mol. Biol. Rev., 2010, 74, 570–588 CrossRef CAS PubMed.
- H. Kurahashi, H. Inagaki, T. Ohye, H. Kogo, T. Kato and B. S. Emanuel, Cell Cycle, 2006, 5, 1297–1303 CrossRef CAS PubMed.
- M. Zannis-Hadjopoulos, W. Yahyaoui and M. Callejo, Trends Biochem. Sci., 2008, 33, 44–50 CrossRef CAS PubMed.
- F. De La Cruz, L. S. Frost, R. J. Meyer and E. L. Zechner, FEMS Microbiol. Rev., 2009, 34, 18–40 CrossRef PubMed.
- S.-E. Behrens, L. Tomei and R. De Francesco, EMBO J., 1996, 15, 12 CAS.
- P. Svoboda and A. D. Cara, Cell. Mol. Life Sci., 2006, 63, 901–908 CrossRef CAS PubMed.
- T. A. Steitz, RNA recognition by proteins, Cold Spring Harbor Laboratory Press, Cold Spring Harbor, 1999, pp. 427–450 Search PubMed.
- J. B. Swadling, D. W. Wright, J. L. Suter and P. V. Coveney, Langmuir, 2015, 31, 2493–2501 CrossRef PubMed.
- P. V. Coveney, J. B. Swadling, J. A. Wattis and H. C. Greenwell, Chem. Soc. Rev., 2012, 41, 5430–5446 RSC.
- J. B. Swadling, P. V. Coveney and H. C. Greenwell, J. Am. Chem. Soc., 2010, 132, 13750–13764 CrossRef CAS PubMed.
- G. Zuo, W. Li, J. Zhang, J. Wang and W. Wang, J. Phys. Chem. B, 2010, 114, 5835–5839 CrossRef CAS PubMed.
- A. E. Garcia and D. Paschek, J. Am. Chem. Soc., 2008, 130, 815–817 CrossRef CAS PubMed.
- S. Kannan and M. Zacharias, Biophys. J., 2007, 93, 3218–3228 CrossRef CAS PubMed.
- K. Ishii and T. Tahara, J. Phys. Chem. B, 2013, 117, 11423–11432 CrossRef CAS PubMed.
- A. V. Orden and J. Jung, Biopolymers, 2008, 89, 1–16 CrossRef PubMed.
- T. J. Macke and D. A. Case, Molecular Modeling of Nucleic Acids, 1998, pp. 379–393 Search PubMed.
- M. Zuker, Nucleic Acids Res., 2003, 31, 3406–3415 CrossRef CAS PubMed.
- H. Berendsen, J. Grigera and T. Straatsma, J. Phys. Chem., 1987, 91, 6269–6271 CrossRef CAS.
- S. Pall, M. J. Abraham, C. Kutzner, B. Hess and E. Lindahl, Solving Software Challenges for Exascale, Springer, 2014, pp. 3–27 Search PubMed.
- S. Pronk, S. Páll, R. Schulz, P. Larsson, P. Bjelkmar, R. Apostolov, M. R. Shirts, J. C. Smith, P. M. Kasson and D. van der Spoel, et al. , Bioinformatics, 2013, btt055 Search PubMed.
- J. A. Maier, C. Martinez, K. Kasavajhala, L. Wickstrom, K. E. Hauser and C. Simmerling, J. Chem. Theory Comput., 2015, 11, 3696–3713 CrossRef CAS PubMed.
- B. Hess, J. Chem. Theory Comput., 2008, 4, 116–122 CrossRef CAS PubMed.
- G. Bussi, D. Donadio and M. Parrinello, J. Chem. Phys., 2007, 126, 014101 CrossRef PubMed.
- M. Parrinello and A. Rahman, J. Appl. Phys., 1981, 52, 7182–7190 CrossRef CAS.
- Y. Sugita and Y. Okamoto, Chem. Phys. Lett., 1999, 314, 141–151 CrossRef CAS.
- A. Patriksson and D. van der Spoel, Phys. Chem. Chem. Phys., 2008, 10, 2073–2077 RSC.
- K. Ishii and T. Tahara, J. Phys. Chem. B, 2013, 117, 11414–11422 CrossRef CAS PubMed.
- T. Otosu, K. Ishii and T. Tahara, Nat. Commun., 2015, 6, 1–9 Search PubMed.
- H. Sahoo, J. Photochem. Photobiol., C, 2011, 12, 20–30 CrossRef CAS.
- B. G. Moreira, Y. You, M. A. Behlke and R. Owczarzy, Biochem. Biophys. Res. Commun., 2005, 327, 473–484 CrossRef CAS PubMed.
- M. Swart, C. Fonseca Guerra and F. M. Bickelhaupt, J. Am. Chem. Soc., 2004, 126, 16718–16719 CrossRef CAS PubMed.
- C. M. Dobson, Nature, 2003, 426, 884–890 CrossRef CAS PubMed.
- P. Kebbekus, D. E. Draper and P. Hagerman, Biochemistry, 1995, 34, 4354–4357 CrossRef CAS PubMed.
- D. H. Mathews, D. H. Turner and R. M. Watson, Current protocols in nucleic acid chemistry, 2007, vol. 67, pp. 11.2.1–11.2.19 Search PubMed.
- H. Frauenfelder, S. G. Sligar and P. G. Wolynes, Science, 1991, 254, 1598–1603 CAS.
- A. Kitao and N. Go, Curr. Opin. Struct. Biol., 1999, 9, 164–169 CrossRef CAS PubMed.
- A. Kitao and K. Takemura, Curr. Opin. Struct. Biol., 2017, 42, 50–58 CrossRef CAS PubMed.
- J. B. Swadling, P. V. Coveney and H. C. Greenwell, Geochim. Cosmochim. Acta, 2012, 83, 360–378 CrossRef CAS.
- A. Bar, A. Kabakçoğlu and D. Mukamel, Phys. Rev. E: Stat., Nonlinear, Soft Matter Phys., 2011, 84, 041935 CrossRef PubMed.
- O. Leslie E, Crit. Rev. Biochem. Mol. Biol., 2004, 39, 99–123 CrossRef PubMed.
Footnote |
| † Electronic supplementary information (ESI) available: Replica temperatures, convergence data and system set-up. See DOI: 10.1039/c7cp06355e |
| This journal is © the Owner Societies 2018 |