 Open Access Article
Angstrom-scale probing of paramagnetic centers location in nanodiamonds by 3He NMR at low temperatures†
Vyacheslav
Kuzmin
 *a,
Kajum
Safiullin
 *a,
Gleb
Dolgorukov
 a,
Andrey
Stanislavovas
 a,
Egor
Alakshin
 a,
Timur
Safin
 a,
Boris
Yavkin
 a,
Sergei
Orlinskii
 a,
Airat
Kiiamov
 a,
Mikhail
Presnyakov
b,
Alexander
Klochkov
 a and
Murat
Tagirov
 ac
ac
aInstitute of Physics, Kazan Federal University, 420008 Kazan, Russian Federation. E-mail: slava625@yandex.ru; kajum@inbox.ru; Fax: +7 843 233 7355; Tel: +7 843 233 7306
bNational Research Centre “Kurchatov Institute”, 123182 Moscow, Russian Federation
cAcademy of Sciences of the Republic of Tatarstan, Institute of Perspective Research, 420111 Kazan, Russian Federation
First published on 5th December 2017
Abstract
In this article a method to assess the location of paramagnetic centers in nanodiamonds was proposed. The nuclear magnetic relaxation of adsorbed 3He used as a probe in this method was studied at temperatures of 1.5–4.2 K and magnetic fields of 100–600 mT. A strong influence of the paramagnetic centers of the sample on the 3He nuclear spin relaxation time T1 was found. Preplating the nanodiamond surface with adsorbed nitrogen layers allowed us to vary the distance from 3He nuclei to paramagnetic centers in a controlled way and to determine their location using a simple model. The observed T1 minima in temperature dependences are well described within the frame of the suggested model and consistent with the concentration of paramagnetic centers determined by electron paramagnetic resonance. The average distance found from the paramagnetic centers to the nanodiamond surface (0.5 ± 0.1 nm) confirms the well-known statement that paramagnetic centers in this type of nanodiamond are located in the carbon shell. The proposed method can be applied to detailed studies of nano-materials at low temperatures.
Introduction
Nanodiamonds are a subject of many recent scientific studies because of their broad spectrum of potential applications, including abrasives or catalysts, biosensors and electrodes.1,2 Nanodiamonds are composed of a crystal core and shell of amorphous layers. The shell of unpurified nanodiamonds can be covered by various functional groups or chemical compositions depending on the application and method of nanodiamond preparation.1 Nowadays the most popular methods to prepare nanodiamond powders are HPHT (high pressure high temperature), CVD (chemical vapor deposition), DND (detonation technique) and milling methods.1 Different types of paramagnetic centers can exist in a diamagnetic matrix of nanodiamonds:1 radical-type centers in the shell, radical-type centers on the surface, various implemented paramagnetic impurities on the surface, NV centers in the nanodiamond core, etc. It is known that purified detonation nanodiamonds contain paramagnetic centers only in the nanodiamond shell.1 The amount and type of paramagnetic center determine the application of nanodiamonds and their commercial value. Usually cw and pulse electron paramagnetic (EPR), electron nuclear double (ENDOR), nuclear magnetic (NMR) and optically detected magnetic (ODMR) resonance methods are used to determine the properties of paramagnetic centers and their possible locations in nanodiamonds.3–7The application of NV centers as nanoscale sensors of the surrounding environment is an actively developing field of research. Shallow NV centers have recently been applied as atomic-sized NMR sensors8 that allow the performance of nanoscale NMR with 1 ppm resolution.9 Experimental realization of the predefined near-surface deposition of NV centers could be done using, e.g. the δ-doping technique which allows one to form arrays of NV centers with exceptional spin coherence properties.10,11 The experimental technique that allows one to determine the actual depth of the NV center deposition inside the nanoparticle is in high demand.
3He is a premium candidate for studies of the magnetic properties of nanosized samples at low temperatures due to the absence of a nuclear quadrupole moment and sufficiently long intrinsic T1 relaxation times. Therefore 3He nuclear magnetic relaxation can be sensitive to the magnetism of the sample. Properties of adsorbed 3He are well understood and it is commonly used as a model system of 2D solids with quantum exchange at low temperatures.12–14 Usually it is assumed that nuclear magnetic relaxation in this system occurs due to dipole–dipole interactions modulated by quantum exchange or thermal 2D motions.14,15 There are also many studies of direct dipole–dipole interactions between adsorbed 3He and nuclear16,17 spins or indirect interactions with electronic spins inside the solids.18,19 Similar direct dipolar couplings were also observed in liquid 3He surrounding solid samples.20,21
In this article we present a new technique that provides detailed information on the magnetic properties of the surface layer of solids and the distribution of paramagnetic impurities in nanodiamonds. It is based on the measurement of relaxation times of adsorbed 3He distant from the sample surface by variable adsorbed layer thickness of noble or inactive gases. The observed minima in T1 temperature dependences provide direct information on correlation times and local magnetic fields.12,22,23 The proposed method allows the variation of the distance between the 3He layer and paramagnetic centers and allows one to obtain information on its distribution in nanoparticles.
Experimental
Detonation nanodiamond powder of 98.3% purity produced by US Research Nanomaterials, Inc. (USA) was used as a sample. The declared by manufacturer particle size of the powder is 3–10 nm and the average particle density ρ ≈ 3.18 g cm−3. The powder was rammed down while placed into a 6 mm i.d. experimental Pyrex cell sealed to the 3He gas managing system via the capillary. The 180 mg sample is 12 mm in length which corresponds to a sample porosity of 83%. Before every experiment the experimental cell was flushed several times with helium-4 at 95 °C temperature and then pumped out.Pulsed 3He NMR experiments were performed at 1.5–4.2 K temperatures and in the range of resonance frequencies f0 = 5–19 MHz using a laboratory made NMR spectrometer24 with a glass cryostat. The purity of 3He used in the NMR experiments was better than 99.99%. The 3He spin–lattice relaxation time T1 was measured by a saturation-recovery technique. The 3He nuclei transverse magnetization relaxation time T2 was obtained by a standard Hahn echo sequence.
Some experiments were performed with the sample surface covered by a certain amount of solid N2 layers. The presence of nitrogen nuclei (14N I = 1) with a quadrupole moment does not have an influence on 3He nuclei magnetization relaxation as the corresponding cross-relaxation process is expected at lower NMR frequencies (≈3.48 MHz).25 Careful annealing of nitrogen layers was done in order to prevent any effects of nonuniformity of the N2 layers. For this purpose the sample was connected to a large volume balloon where a necessary amount of N2 gas was introduced at room temperature and then the sample temperature was slowly lowered down to 4.2 K. In order to achieve homogenous nitrogen distribution on the sample surface and create proper nitrogen layers we fulfilled the following conditions during nitrogen adsorption. During a slow temperature decrease the nitrogen gas pressure was carefully managed to be significantly below saturated vapor pressure values26 that excluded capillary condensation. According to estimates these measures prevent any undesirable effects of capillary condensation in the pores of nanodiamond powder larger than a few nanometers in diameter.
Sample characterization
XRD measurements
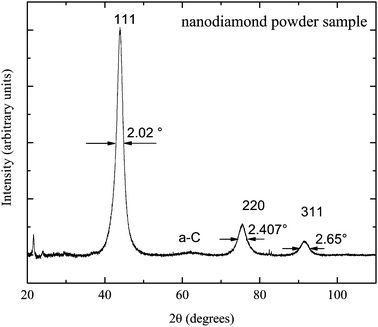
The nanodiamond powder properties were studied by X-ray diffraction experiments on a Bruker D8 Advance diffractometer at Kazan Federal University. The obtained X-ray diffraction pattern is presented in Fig. 1. Three main peaks (111), (220) and (311) of the pattern are attributed to the crystal structure of the nanodiamond core. The pattern shows the absence of a graphite phase in the sample: there is no visible corresponding broad line near 2θ = 25°.27,28 The low-intensity broad line near 2θ = 63° is known to represent the amorphous a-C phase of sp2-carbon.29 This verifies that nanodiamond particles are composed of diamond cores and of amorphous carbon layers on the top of the core.1Implementation of the Scherrer equation for a spherical shape of nanodiamonds allows us to estimate the average diamond core diameter dcore: dcore = 0.9λ/(β![[thin space (1/6-em)]](https://www.rsc.org/images/entities/char_2009.gif) cos
cos![[thin space (1/6-em)]](https://www.rsc.org/images/entities/char_2009.gif) θ), where the X-ray wavelength λ = 0.154 nm and β is the FWHM of the peak at θ. The dcore estimates made for three pattern peaks give almost the same values with the average dcore = 4.24 ± 0.06 nm.
θ), where the X-ray wavelength λ = 0.154 nm and β is the FWHM of the peak at θ. The dcore estimates made for three pattern peaks give almost the same values with the average dcore = 4.24 ± 0.06 nm.
TEM measurements
Transmission electron microscopy (TEM) was performed on a Titan 80-300 S/TEM (FEI, USA) at the Probe and Electron microscopy RC “NANOPROBE”, National Research Center “Kurchatov Institute”, Moscow. The typical nanodiamond powder sample image obtained by transmission electron microscopy at an accelerating voltage of 300 kV is shown in Fig. 2. The image clearly demonstrates the crystal structure of the diamond core covered by the shell of two–three amorphous carbon layers for every particle. The measured interplanar distance of the crystal core planes is 2.1 Å which corresponds to a diamond structure1 (interplanar distance 2.06 Å in a diamond). The measured interplanar distances of the shell layers are close to 3.6–3.7 Å, which are typical for amorphous carbon onion layers.30 Analysis of particle size distributions was performed using ImageJ software on a few TEM images and the following average diameter is d = 6.7 ± 1.7 nm. The average shape of the nanodiamond particles is close to spherical (obtained circularity factor of 0.98 ± 0.09). The simulations of the corresponding X-ray diffraction pattern for the obtained nanodiamond size distributions with an average shell thickness of 0.9 ± 0.3 nm agree with the widths of the peaks from the measured XRD pattern.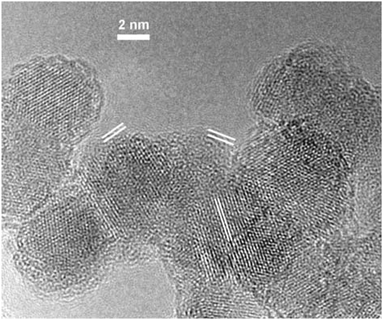 | ||
| Fig. 2 The TEM image of the nanodiamond powder sample. The interplanar distance between the core planes is 2.1 Å and between the shell layers is 3.6–3.7 Å (both are highlighted by white lines). | ||
EPR measurements
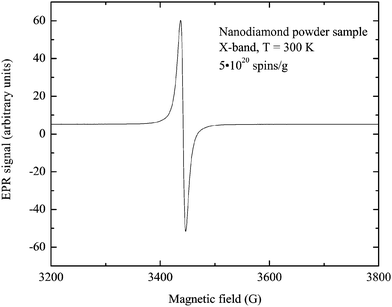
EPR experiments were carried out on a Bruker Elexsys E680 spectrometer at 9.7 and 94 GHz. The room temperature cw EPR spectrum consists of a single Lorentzian line with g = 2.0044 and HWHM = 0.85 mT (Fig. 3). Usually the similar lineshape and linewidth of the EPR signal correspond to the free radical-type center of the purified detonation nanodiamonds located in the diamond shell or on the surface.1 Contribution of another type of paramagnetic center was detected using W-band echo-detected EPR, although its intensity did not exceed 10% of the total concentration, thus it was omitted during interpretation of the results. The signal of the N0 centers was not observed. The only noticeable difference between the X and W-band EPR spectra was a twofold increase in linewidth.The concentration of the paramagnetic centers in the nanodiamond sample is 5 × 10²⁰ spin per g as was determined in the X-band at room temperature using a Cu2+(DETC)2 sample with a known number of spins.
Spin–spin (Te2) and spin–lattice (Te1) relaxation times of the paramagnetic centers were measured at the W-band using Hahn echo decay and inversion-recovery pulse sequences, respectively. Relaxation curves were fitted by a single exponential function. The relaxation measurements were performed in the range of temperatures from 300 down to 8 K. Spin–lattice relaxation time Te1 slowly increases from 20 to 60 μs with a decrease in temperature, whereas Te2 remains almost constant at a value of 300 ns. The spin–lattice relaxation is almost independent at temperatures below 50 K, possibly due to a strong spin–spin interaction between near-surface paramagnetic centers (similar to the case of NV centers in the diamond31), therefore we expect Te1 on the order of 100 microseconds at temperatures of the 3He NMR experiments.
Adsorption isotherms
The sample in the NMR experiments was either preliminary covered by a number of nitrogen layers N or not covered (N = 0). The Brunauer–Emmett–Teller (BET) analysis32 of the measured nitrogen adsorption isotherm at 77 K provides the specific surface area of the sample of S = 342.8 ± 3.9 m2 g−1. The measured nitrogen adsorption isotherm allowed us to estimate the gas amount that is required to cover our nanodiamond powder with numbers of nitrogen layers close to one, two and four (N = 0.96; 2.15; 3.69).Since all NMR experiments were performed with adsorbed 3He accurate measurements of 3He adsorption isotherms were done at a temperature of 4.2 K for all N values. The monolayer capacities of adsorbed 3He on the sample surface were obtained by point A33,34 technique. The found 3He monolayer stp quantity for N = 0 is Vads = 24.1 ± 1.6 cm3. Following the surface helium capacities,35,36 the corresponding specific surface area of our sample is 342.0 ± 22.2 m2 g−1 (3He), which agrees well with the results of N2 BET analysis.
With the assumption of non-porous spherical particles, the obtained specific surface area value provides the estimated average particle diameter:28d = 6/(ρS) = 5.51 ± 0.21 nm. This is in good agreement with XRD and TEM results.
Similar 3He adsorption isotherms were measured for N = 0.96, 2.15 and 3.69 and the following 3He monolayer capacities were obtained: 18.15 ± 0.19 cm3, 14.40 ± 0.18 cm3, and 12.11 ± 0.14 cm3, respectively. All obtained 3He monolayer values were used in further NMR experiments to adjust the 3He adsorbed monolayer coverage fraction and to determine the exact number of nitrogen layers.
Results
In this work NMR measurements were performed in adsorbed 3He with the fraction x3 = 0.45; 0.6; 0.8 and 1.0 of the monolayer on the nanodiamond surface with/without nitrogen coverage. Here x3 denotes the amount of adsorbed 3He in the fractions of monolayer capacity, and x4 is defined in the same way for adsorbed 4He. 3He gas was injected into the cell at 4.2 K and then the 3He adsorbed layer was annealed for about 1 h before NMR experiments.All measured 3He longitudinal magnetization recovery and transverse magnetization decay curves in this work are well described by a single exponential function. In the case of the sample not preplated with N2 (N = 0) the relaxation rate is quite fast; T1 is on the order of milliseconds, which is unusually short compared with the adsorbed 3He spin–lattice relaxation on various diamagnetic samples.37–39
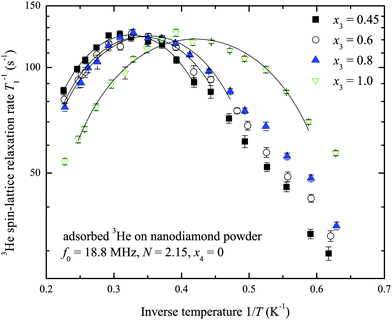
A set of temperature dependences of the 3He longitudinal magnetization recovery times T1 were measured for various 3He adsorbed layer coverages of the sample with and without nitrogen preplate. Typical measured T1−1 temperature dependences are presented in Fig. 4. All measured temperature dependences of T1 and T2 for various N and x3 are presented in a log scale in the ESI.† The obtained temperature dependences have a parabolic shape versus inverse temperature. For convenience T−1,max1 and Tmax will denote the maximum spin–lattice relaxation rate and the corresponding temperature in the mentioned dependences. Tmax decreases as the 3He coverage fraction x3 increases (Fig. 5). Especially, Tmax shifts at complete 3He monolayer surface coverages x3 = 1.0.
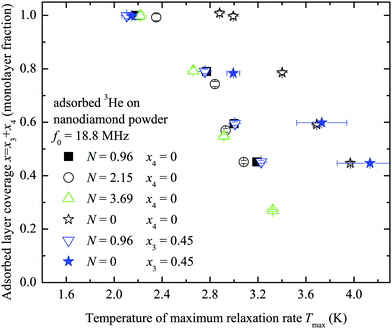 | ||
| Fig. 5 The relation between the temperature of the 3He spin–lattice relaxation maximum rate T−1,max1 (Fig. 4) and the adsorbed 3He coverage fraction x for performed experiments of adsorbed 3He on the nanodiamond powder sample with the number of preplated nitrogen layers N = 0; 0.96; 2.15; 3.69. | ||
The maximum values T−1,max1 of the 3He spin–lattice relaxation rate are slower for the case of the sample preliminarily covered by nitrogen layers. The obtained relation between T−1,max1 and the number of nitrogen layers on the sample surface is displayed in Fig. 6 for various x3 values. Clearly, the 3He relaxation rate strongly depends on the number of nitrogen layers and rapidly decreases with N. T−1,max1 is almost independent of x3 except when N = 0.
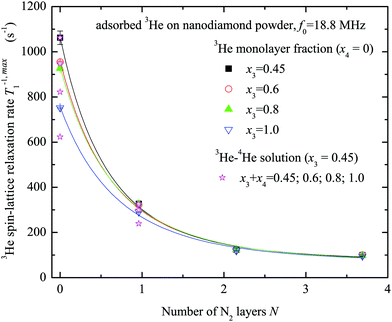 | ||
| Fig. 6 Dependence of the 3He spin–lattice relaxation rates T−1,max1 at x3 = 0.45, 0.6, 0.8 and 1.0 monolayer coverage of the nanodiamond powder sample on the number of preplated nitrogen layers N (x4 = 0). Results of 3He–4He experiments are shown as supplementary data (x3 = 0.45) (ESI†). Solid lines represent the fits by the relaxation model (see Appendix) and the following d0 values are obtained: 0.43 ± 0.06; 0.49 ± 0.08; 0.54 ± 0.08; 0.61 ± 0.10 nm for x3 = 0.45; 0.6; 0.8; 1.0, correspondingly. | ||
Similar experiments were performed with a partial substitution of adsorbed 3He with 4He atoms for N = 0 and N = 0.96. The x3 = 0.45 amount of 3He was adsorbed on the sample surface and then we increased the adsorbed layer density with x4 amounts of 4He to obtain similar layer coverages x = x3 + x4 = 0.45; 0.6; 0.8; 1.0 as before. In these experiments the observed Tmax (x = x3 + x4) values are the same (within experimental error) as those in pure 3He experiments (x4 = 0) with N = 0.96 (see Fig. 5 and 6), but the 3He spin–lattice relaxation rate slows down within 5–20% in general compared to that for x4 = 0. The observed Tmaxvs. x for N = 0 does not coincide with the one of pure 3He experiments (Fig. 5).
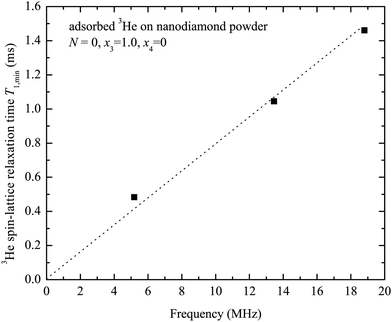
Fig. 7 shows the measured frequency dependence of the 3He spin–lattice relaxation time T1,min (corresponds to T−1,max1) for a complete 3He monolayer (x3 = 1.0, N = 0). The observed 3He relaxation time linearly increases with the Larmor frequency ω.
The temperature dependences of spin–spin relaxation times T2 of the adsorbed 3He were also measured at various x3 coverages (x4 = 0, see ESI†). The typical T2 temperature dependences are presented in Fig. 8 for the sample with nitrogen preplate N = 0.96. T2 values decrease as the temperature T decreases and a small T2 deviation is observed between x3 coverages.
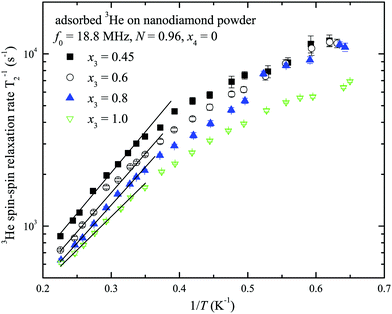 | ||
| Fig. 8 The temperature dependences of 3He spin–spin relaxation times T2 at x3 = 0.45, 0.6, 0.8 and 1.0 monolayer coverage of the nanodiamond powder sample preplated with one nitrogen layer nanodiamond powder sample (N = 0.96, x4 = 0). The solid lines represent the fits by eqn (3) and (4) (see Discussion). | ||
Discussion
The observed extremes in temperature dependence of 3He relaxation rates T1−1(T) provide information on the correlation times τ of fluctuating magnetic fields causing relaxation as well as values of the fluctuating magnetic fields themselves. Matsushita et al.23 registered T1 minima in 3He adsorbed in the nanochannels of porous silicate powder and reported on the decrease of Tmax temperature with an x3 increase. Their findings were similar to our results, however they did not consider the influence of possible paramagnetic impurities and attribute this effect solely to 3He movements in flat 2D films13 as was done earlier by Cowan and Crane for boron nitride samples.40,41Firstly, we shall check whether intrinsic dipole–dipole interactions in the 3He film could be responsible for the observed relaxation. At the maximum relaxation rate when ωτ ≈ 1 according to a simple three dimensional picture for the BPP (Bloembergen–Purcell–Pound) model one has:
| T1,min ≈ ω(γI2〈Bloc2〉)−1, | (1) |
Assuming that 3He–3He dipole–dipole interactions are responsible for relaxation the estimates of a standard deviation of a fluctuating magnetic field (eqn (1)) lie within 1–3 mT depending on the number of nitrogen layers on the ND surface. These estimates of fluctuating magnetic field are too high compared to ones previously reported for a 3He ensemble (0.1 mT as found for x3 = 0.32 at 3.26 MHz and 1.8 K by Lusher et al.22). On the other hand the temperatures Tmax depend on 3He coverage x3 (Fig. 5), but T−1,max1 remains the same for a fixed N (Fig. 4). All these facts additionally point out that observed 3He relaxation is not governed by 3He–3He dipole–dipole coupling but involves an external magnetic reservoir.
The temperatures Tmax for a given x3 in pure 3He experiments do not vary with the number of nitrogen layers when N ≥ 1 (Fig. 5). This means that Tmax strongly depends on the surface diffusive motion which is linked with the 3He total density x3. The observed Tmax(x) for N = 0 differs from N ≥ 1 because 3He motion on a non-preplated surface is distinct. The Tmax(x) and T−1,max1(N) relations in 3He–4He experiments (N ≥ 1) are similar to the ones of pure 3He because 3He atom mobility does not change as 4He replaces 3He (Fig. 5 and 6).
The decrease of T−1,max1 with N (see Fig. 6) unambiguously indicates that relaxation depends on the distance from the adsorbed 3He to the nanodiamond surface. The data for 3He–4He presented on the same figure demonstrate similar relaxation rates and reflect the same tendency. Possibly the relaxation process involves paramagnetic centers, the concentrations of which are about 5 × 10²⁰ spin per g. The 3He amounts in our experiments do not exceed n3 = 6 × 10²⁰ spins at most, whereas the number of paramagnetic centers is about nPC = 9 × 10¹⁹ (according to the sample weight), so for all experimental conditions we have:
| nPCγS(Te1)−1 ≫ n3γIT−1,max1. | (2) |
The condition of relaxation rate maximum (ωτ ≈ 1) gives estimates for τ ≈ 8.5 ns. This time scale is much shorter than the measured spin–lattice relaxation time of paramagnetic centers Te1 in nanodiamonds at low temperatures (≈300 μs), and is also shorter than the spin–spin relaxation time Te2 ≈ 300 ns. Obviously Te2 is not a correlation time for 3He nuclear relaxation because the correlation time has an activation nature at low temperature and depends on the amount of 3He (see Fig. 8). The found correlation time is likely associated with the 3He surface diffusion that has either an activation nature (Arrhenius-like) or quantum tunneling between adsorption sites. Thermal motional averaging is indicated by the measured 3He free induction decay characteristic time T2* that is proportional to the temperature: T2*[μs] = (85.9 ± 1.7)·T [K] in the 1.5–4.2 K range for x3 = 1.0. Let us assume that correlation time is the time needed for a 3He atom to diffuse from one paramagnetic center to another near the surface. Assuming D ∼ 10−7 cm2 s−1 in the 3He layer at low temperatures42 and that the paramagnetic centers are located in the nanodiamond shell near the surface with a mean distance between them d ≈ 0.9 nm (corresponds to the surface mean density in assumption of surface paramagnetic centers), we get τ = d2/4D ∼ 20 ns which agrees with observed correlation times.
Thus, the relaxation occurs through surface diffusional motions of nuclear spins in the magnetic fields mainly created by paramagnetic centers. This allows one to find the average distance from paramagnetic centers to the surface by applying the relaxation model described in the Appendix. This model implies the relaxation of nuclear longitudinal magnetization through paramagnetic centers distributed near the surface and intrinsic dipolar relaxation in the 3He film. The observable longitudinal magnetization recovery is a single exponential because of the 3He surface diffusive motion. This is different from the reported multiexponential processes of magnetization relaxation of immobile 1H and 19F nuclei spins at the surface of nanodiamonds7,43 or 13C inside the nanodiamonds.44 A more detailed theory of nuclear magnetic relaxation in 2D fluids due to 3He–3He and 3He–paramagnetic center dipole–dipole interactions mediated by 2D motions is given by Satoh and Sugawara.45 Although we consider in details in Appendix the case of fixed nuclei and paramagnetic centers it gives the same distance dependence for longitudinal relaxation rates on the distance a from the 3He film to paramagnetic centers (T1−1 ∝ a−4 in 2D case). Another possible mechanism of nuclear magnetic relaxation in that system is considered by Kondo et al.46 and Lusher et al.47 The authors of these works suggested that relaxation occurs due to fast spin exchange between the bulk (liquid or gas) and solid adsorbed layer where strong local magnetic fields Bloc are almost constant during the 3He short stay in the adsorbed layer. In that case the correlation time stands for the inversed exchange frequency and the longitudinal relaxation rate is proportional to 〈Bloc2〉 averaged over the surface. Therefore the longitudinal relaxation rate has the same distance dependence as in our model. Thus, independent of the details of relaxation mechanisms, the distance dependence for longitudinal relaxation is similar and that allows us to determine distance from the fits.
The fits of experimental data by eqn (9) and (12) (see Fig. 6) yield the average distance from paramagnetic centers to the nanodiamond surface d0 = 0.5 ± 0.1 nm. Here it was assumed that the distance between adsorbed N2 layers dN2–N2 is the same between each adjacent atomic N2 layer and is equal to 3.1 Å, as determined in numerous studies of adsorbed N2 structure at low temperatures (see for instance the work of Golebiowska et al.48). The distance between the first adsorbed layer and the nanodiamond surface d1 was also taken to be equal to 3.1 Å for the sake of simplicity (close to estimates for 3He on Grafoil reported by Joly et al.49). The diameter of the nanoparticle was fixed to d = 5.51 nm, but we found that the fitting parameters are almost independent of d if the latter is chosen in the range 3–10 nm. In this fit we use an N-independent relaxation rate T−1,dd1 which is attributed to the self 3He–3He dipole–dipole relaxation in the adsorbed 3He layer (eqn (12)) and has been under study for a long time (see all references from here regarding 3He experiments). The obtained Tdd1 ≈ 14 ± 2 ms from the fits is short compared to those usually observed in 3He adsorbed on various amorphous non-magnetic materials such as aerogels and Vycor (0.1–1 seconds)36,37 and crystal powders,40 but similar to those observed in FSM (Folded Sheet Mesoporous materials).23
The application of eqn (7) and (9) with d0 = 0.5 nm provides a satisfactory agreement of the model relaxation time TPC1(N = 0) = 4.1 ms (the case of fixed spins is applied for the sake of simplicity) with the experimental T1 ≈ 1 ms at a frequency of 18.8 MHz. In this estimate we assumed the average number of paramagnetic centers in each particle NPC = 139 which corresponds to that defined above the mean diameter of nanoparticles and the total number of paramagnetic centers nPC. Note that the measured value of T1 ≈ 1 ms can be obtained within this model for d0 = 0.3 nm which is also close to the determined above average d0.
Possibly, the applied technique for distance measurement can be implemented for the determination of types of paramagnetic centers and their location in nanodiamonds by selective 3He relaxation measurements using the fact that paramagnetic centers of a different nature have different dynamic parameters. As the interaction between 3He and paramagnetic centers is mutual, a similar idea can be applied for the same purpose by means of selective Te1 measurements with a variable thickness of solid layers of nitrogen (or noble gas atoms) on the nanodiamond surface isolating nuclear and paramagnetic center systems. The measured single line of the EPR spectra in our sample is accumulated for a relatively broad nanodiamond size distribution. It is known that for particles smaller than 80 nm the concentration of paramagnetic centers strongly depends on the particle size.50 In addition, the number of paramagnetic spins is very high and the paramagnetic spin system is strongly coupled. Therefore it makes it impossible to distinguish different types of paramagnetic centers by means of EPR and 3He NMR. Such a type of experiment can be carried out in nanodiamonds with a lower concentration of paramagnetic centers and a narrow size distribution, which is not the case for our sample.
Temperature dependences of 3He transverse relaxation clearly show an exponential decrease of relaxation times T2 with inverse temperature 1/T (Fig. 8). The observed relaxation time values and temperature behaviour are similar to that of reported 2D films of 3He.23,45,46 Additionally we found a weaker dependence of T2 than of T1 on the number of nitrogen layers (see ESI†). This points out that the influence of intrinsic dipole–dipole relaxation in the 3He film on transverse 3He relaxation is stronger (eqn (13)). Moreover we note that relaxation time T2 in 2D is always much shorter than T1 in dipolar coupled systems (nuclear–nuclear and/or nuclear–electron) due to peculiarities of dipolar correlation functions in reduced dimensions.13,45
At low temperatures (below 2 K) T2 is independent on temperature and indicates crossover from thermally activated motion to quantum tunneling as is known, for instance, from studies of 3He in Vycor.36 A commonly used rule-of-thumb for motionally narrowed 3D systems reads:
| T2−1 = τM2, | (3) |
| τ−1 ∝ exp(−Ea/kT). | (4) |
Conclusions
We have performed NMR measurements of adsorbed 3He in nanodiamond powders in the 1.5–4.2 K temperature range. The observed maxima in T1−1 temperature dependences are clearly interpreted by the suggested relaxation model via paramagnetic impurities. The 3He relaxation rates strongly depend on the distance from the 3He layer to the nanodiamond surface and are governed by fluctuating fields experienced by diffusing nuclear spins. These fields are created by paramagnetic centers and are modulated by 3He thermal and quantum tunneling surface motions. The suggested relaxation model allows the quantitative determination of the location of near-surface paramagnet centers in the nanodiamond sample with angstrom precision. The same experimental technique and relaxation model could prospectively be used to distinguish the core paramagnetic centers in nanodiamond samples with a reduced amount of surface paramagnetic centers. The distance dependence of the 3He relaxation rate (T1−1 ∝ a−4 for 2D case) is not sensitive to the details of the system (2D solid, 2D fluid or gas–solid with fast exchange). The observed large difference between T1 and T2 is explained by the difference in dominating mechanisms responsible for longitudinal and transverse relaxation: 3He–paramagnetic centers and 3He–3He dipolar interactions, correspondingly. The determined average distance from the paramagnetic centers to the nanodiamond surface of 0.5 ± 0.1 nm shows that these paramagnetic centers are located in the nanodiamond shell. This is consistent with the well-known information on nanodiamond structures and the EPR measurements. The proposed technique to probe the location of the paramagnetic centers that uses adsorbed 3He and N2 layers can be applied to studies of various nanosized samples with paramagnetic impurities. The demonstrated method can also be performed with adsorbed layers of noble gases instead of nitrogen.Author contributions statement
V. K., K. S. and A. Kl. designed and performed the NMR experiments and contributed to the analysis of experimental results and to the discussion. G. D., A. S. and E. A. also conducted NMR and gas adsorption experiments, and participated in sample preparation. T. S. contributed to low-temperature experimental equipment assembly. B. Y. and S. O. performed EPR experiments and contributed to the discussion, A. K. performed XRD measurements and M. P. performed TEM imaging. M. T. defined the original research objectives and contributed to the experiment design. All authors contributed to manuscript writing.Conflicts of interest
There are no conflicts of interest to declare.Appendix: relaxation model
For simplicity we shall consider an ideal spherical nanoparticle in which the paramagnetic centers are distributed in the surface layer on the same distance from the surface d0 (Fig. 9). According to different physical models of 3He longitudinal relaxation through paramagnetic centers described in the Discussion section, we can write:| Γ1 ∝ 〈Bloc2〉, | (5) |
 | (6) |
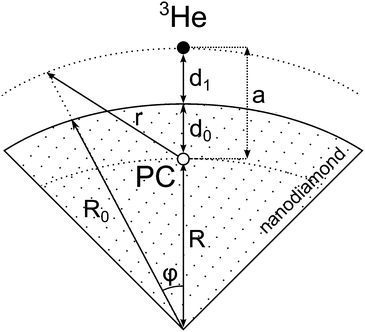 | ||
| Fig. 9 An illustration of the developed relaxation model of 3He adsorbed on the nanodiamond surface. | ||
Note that for the fixed spins:51
 | (7) |
Let us assume that the paramagnetic center is located at a distance d0 from the surface, 3He is at a distance d1 from the surface, R0 is the radius of nanoparticle and R = R0 − d0 and a = d0 + d1. Then one can get:
 | (8) |
 | (9) |
 | (10) |
The result given by eqn (9) can be applied to a nanoparticle preplated with nitrogen layers. For that case d1 should be substituted in eqn (10) by:
| d2 = d1 + NdN2–N2, | (11) |
Note that in the case of large nanoparticles (ξ ≪ 1, in another words a ≪ R) one has T−1,PC1 ∝ a−4 dependence of relaxation rate on the distance from paramagnetic centers to the 3He layer as it follows from eqn (9).
In addition to this relaxation mechanism described above one has to take into account intrinsic dipolar relaxation in 3He films (Tdd1). Thus, the observable longitudinal relaxation time of adsorbed 3He can be described by the following equation:
 | (12) |
 | (13) |
Acknowledgements
This work was financially supported by the Russian Science Foundation (grant RSF 16-12-10359). The experimental part of this work was partially done on equipment of the RC of Probe and EM (Kurchatov Complex of NBICS-Technologies, NRC “Kurchatov Institute”).References
-
O. A. Shenderova, Detonation nanodiamonds: science and applications, Pan Stanford Publishing, 2014 Search PubMed
.
-
S. Koizumi, C. Nebel and M. Nesladek, Physics and applications of CVD diamond, John Wiley & Sons, 2008 Search PubMed
.
- B. Yavkin, G. Mamin and S. Orlinskii, J. Magn. Reson., 2016, 262, 15 CrossRef CAS PubMed
.
- B. V. Yavkin, V. A. Soltamov, R. A. Babunts, A. N. Anisimov, P. G. Baranov, F. M. Shakhov, S. V. Kidalov, A. Y. Vul', G. V. Mamin and S. B. Orlinskii, Appl. Magn. Reson., 2014, 45, 1035 CrossRef CAS
.
- S. B. Orlinskii, R. S. Bogomolov, A. M. Kiyamova, B. V. Yavkin, G. M. Mamin, S. Turner, G. Van Tendeloo, A. A. Shiryaev, I. I. Vlasov and O. Shenderova, Nanosci. Nanotechnol. Lett., 2011, 3, 63 CrossRef CAS
.
- A. M. Panich, A. Altman, A. I. Shames, V. Y. Osipov, A. E. Aleksenskiy and A. Y. Vul, J. Phys. D: Appl. Phys., 2011, 44, 125303 CrossRef
.
- A. M. Panich, Crit. Rev. Solid State Mater. Sci., 2012, 37, 276 CrossRef CAS
.
- T. Staudacher, F. Shi, S. Pezzagna, J. Meijer, J. Du, C. A. Meriles, F. Reinhard and J. Wrachtrup, Science, 2013, 339, 561 CrossRef CAS PubMed
.
- N. Aslam, M. Pfender, P. Neumann, R. Reuter, A. Zappe, F. Fávaro de Oliveira, A. Denisenko, H. Sumiya, S. Onoda, J. Isoya and J. Wrachtrup, Science, 2017 DOI:10.1126/science.aam8697
.
- F. Fávaro de Oliveira, S. A. Momenzadeh, D. Antonov, J. Scharpf, C. Osterkamp, B. Naydenov, F. Jelezko, A. Denisenko and J. Wrachtrup, Nano Lett., 2016, 16, 2228 CrossRef PubMed
.
- T. Rendler, J. Neburkova, O. Zemek, J. Kotek, A. Zappe, Z. Chu, P. Cigler and J. Wrachtrup, Nat. Commun., 2017, 8, 14701 CrossRef CAS PubMed
.
- B. Cowan, L. A. El-Nasr, M. Fardis and A. Hussain, Phys. Rev. Lett., 1987, 58, 2308 CrossRef CAS PubMed
.
- B. P. Cowan, J. Phys. C: Solid State Phys., 1980, 13, 4575 CrossRef CAS
.
- H. Godfrin and H.-J. Lauter, Prog. Low Temp. Phys., 1995, 14, 213 CAS
.
- N. S. Sullivan, J. Low Temp. Phys., 1976, 22, 313 CrossRef CAS
.
- L. J. Friedman, T. J. Gramila and R. C. Richardson, J. Low Temp. Phys., 1984, 55, 83 CrossRef CAS
.
- D. R. Swanson, D. Candela and D. O. Edwards, J. Low Temp. Phys., 1988, 72, 213 CrossRef CAS
.
- A. Schuhl, S. Maegawa, M. W. Meisel and M. Chapellier, Phys. Rev. Lett., 1985, 54, 1952 CrossRef CAS PubMed
.
- S. Saito, Phys. Rev. Lett., 1976, 36, 975 CrossRef CAS
.
- A. Egorov, F. Aukhadeev, M. Tagirov and M. Teplov, JETP Lett., 1984, 39, 480 CAS
.
- A. V. Egorov, D. S. Irisov, A. V. Klochkov, A. V. Savinkov, K. R. Safiullin, M. S. Tagirov, D. A. Tayurskii and A. N. Yudin, JETP Lett., 2007, 86, 416 CrossRef CAS
.
- C. P. Lusher, J. Nyéki, D. Shvarts, B. P. Cowan, J. Saunders and D. E. W. Vaughan, J. Low Temp. Phys., 2004, 134, 619 CrossRef CAS
.
- T. Matsushita, R. Kawai, A. Kuze, M. Hieda and N. Wada, J. Low Temp. Phys., 2014, 175, 407 CrossRef CAS
.
- E. Alakshin, R. Gazizulin, A. Klochkov, V. Kuzmin, A. Sabitova, T. Safin and M. Tagirov, Magnetic Resonance in Solids, 2013, 15, 13104 Search PubMed
.
- F. V. Keuls, T. Gramila, L. Friedmant and R. Richardson, Phys. B, 1990, 165, 717 CrossRef
.
-
M. Malkov, Handbook on the Physicotechnical Fundaments of Deep Cooling [Spravochnik po fiziko-tehnicheskim osnovam glubokogo ohlazhdeniya], Gosenergoizdat, Moscow, 1963 Search PubMed
.
- Z. Qiao, J. Li, N. Zhao, C. Shi and P. Nash, Scr. Mater., 2006, 54, 225 CrossRef CAS
.
- V. Pichot, M. Comet, E. Fousson, C. Baras, A. Senger, F. L. Normand and D. Spitzer, Diamond Relat. Mater., 2008, 17, 13 CrossRef CAS
.
- A. K. Arora, T. Ravindran, G. Reddy, A. K. Sikder and D. Misra, Diamond Relat. Mater., 2001, 10, 1477 CrossRef CAS
.
- O. O. Mykhaylyk, Y. M. Solonin, D. N. Batchelder and R. Brydson, J. Appl. Phys., 2005, 97, 074302 CrossRef
.
- A. Jarmola, V. M. Acosta, K. Jensen, S. Chemerisov and D. Budker, Phys. Rev. Lett., 2012, 108, 197601 CrossRef CAS PubMed
.
- S. Brunauer, P. H. Emmett and E. Teller, J. Am. Chem. Soc., 1938, 60, 309 CrossRef CAS
.
- P. H. Emmett and S. Brunauer, J. Am. Chem. Soc., 1937, 59, 1553 CrossRef CAS
.
- M. Bretz, J. G. Dash, D. C. Hickernell, E. O. McLean and O. E. Vilches, Phys. Rev. A: At., Mol., Opt. Phys., 1973, 8, 1589 CrossRef CAS
.
- J. G. Daunt and E. Lerner, J. Low Temp. Phys., 1972, 8, 79 CrossRef CAS
.
-
J. G. Daunt and E. Lerner, Monolayer and Submonolayer helium films, Springer, 1973 Search PubMed
.
- A. V. Klochkov, V. V. Kuz'min, K. R. Safiullin, M. S. Tagirov, D. A. Tayurskii and N. Mulders, JETP Lett., 2008, 88, 823 CrossRef CAS
.
- D. J. Creswell, D. F. Brewer and A. L. Thomson, Phys. Rev. Lett., 1972, 29, 1144 CrossRef CAS
.
- D. P. Grimmer and K. Luszczynski, J. Low Temp. Phys., 1978, 30, 153 CrossRef CAS
.
- T. P. Crane and B. P. Cowan, Phys. Rev. B: Condens. Matter Mater. Phys., 2000, 62, 11359 CrossRef CAS
.
- T. Crane and B. Cowan, Phys. B, 2000, 284–288(Part 1), 230 CrossRef CAS
.
- B. Cowan, M. Fardis, T. Crane and L. Abou-El-Nasr, Phys. B, 1990, 165-166, 707 CrossRef
.
- A. M. Panich, H.-M. Vieth, A. I. Shames, N. Froumin, E. Osawa and A. Yao, J. Phys. Chem. C, 2010, 114, 774 CAS
.
- A. M. Panich, N. A. Sergeev, A. I. Shames, V. Y. Osipov, J.-P. Boudou and S. D. Goren, J. Phys.: Condens. Matter, 2015, 27, 072203 CrossRef CAS PubMed
.
- K. Satoh and T. Sugawara, J. Low Temp. Phys., 1980, 38, 37 CrossRef CAS
.
- Y. Kondo, T. Mizusaki, A. Hirai, Y. Hirayoshi and K. Eguchi, J. Low Temp. Phys., 1989, 75, 289 CrossRef CAS
.
- C. P. Lusher, M. F. Secca and M. G. Richards, J. Low Temp. Phys., 1988, 72, 25 CrossRef CAS
.
- M. Golebiowska, L. Firlej, B. Kuchta and R. Fabianski, J. Chem. Phys., 2009, 130, 204703 CrossRef CAS PubMed
.
- F. Joly, C. Lhuillier and B. Brami, Surf. Sci., 1992, 264, 419 CrossRef CAS
.
- B. Yavkin, G. Mamin, M. Gafurov and S. Orlinskii, Magnetic Resonance in Solids, 2015, 17, 15101 Search PubMed
.
-
A. Abragam, The principles of nuclear magnetism, Oxford university press, 1961 Search PubMed
.
Footnote |
| † Electronic supplementary information (ESI) available. See DOI: 10.1039/c7cp05898e |
| This journal is © the Owner Societies 2018 |

