 Open Access Article
Creative Commons Attribution 3.0 Unported Licence
Monitoring photo-induced population dynamics in metastable linkage isomer crystals: a crystallographic kinetic study of [Pd(Bu4dien)NO2]BPh4†
Lauren E.
Hatcher
 *a,
Jonathan M.
Skelton
 *a,
Mark R.
Warren
 b,
Clare
Stubbs
 a,
E. Lora
da Silva
 a and
Paul R.
Raithby
 *a
*a
aDepartment of Chemistry, University of Bath, Bath, BA2 7AY, UK. E-mail: l.e.hatcher@bath.ac.uk; j.m.skelton@bath.ac.uk; p.r.raithby@bath.ac.uk
bDiamond Light Source Ltd., Diamond House, Harwell Science and Innovation Campus, Didcot, Oxfordshire OX11 0DE, UK
First published on 31st January 2018
Abstract
We present a detailed kinetic study of photo-induced solid state linkage isomerism in the compound [Pd(Bu4dien)NO2]BPh4 (Bu4dien = N,N,N′,N′-tetrabutyldiethylenetriamine) using in situ photocrystallographic techniques. We explore the key variables that influence the photoconversion and develop a detailed kinetic model for the excitation and decay processes and the temperature dependence of the conversion rates. We show that by varying the temperature the lifetime of the excited state can be varied over orders of magnitude, making these systems ideal test cases for the development of new time-resolved X-ray diffraction methods. The kinetic model is used to build a numerical-simulation tool, which we use to explore the practicalities of pump–probe single-crystal diffraction experiments with minute and second time-resolution.
Introduction
Photo-switchable materials, which display a change in bulk properties in response to irradiation, are of interest for a wide variety of real-world applications. These range from “smart” materials including photo-responsive coatings, opto-electronic memories and light-driven molecular machines, to biomedical solutions such as photo-dynamic therapies.1,2 Materials that switch in the solid state are particularly desirable, as these are most conveniently developed into viable device media. Many photo-switching applications require two-way operation, and so candidate materials are often based around bi-stable, reversible photochemical phenomena. Reversible switching is conveniently achieved when the photo-induced state is metastable, i.e. when the excited state is maintained, at a consistent occupancy, for a set period of time before decaying back to the initial ground state (GS). A fundamental understanding of the nature of the metastable state, in particular its lifetime and the factors that influence it, is therefore imperative to optimise many device parameters, including stability, operating limits and durability/cycleability.Photo-switchable linkage isomers are a class of metastable molecular materials that have been extensively studied using photocrystallographic methods.3 Photocrystallography allows the full three-dimensional structures of photo-excited species to be determined by in situ X-ray diffraction,4 and the technique is particularly advantageous for the study of molecular systems, for which structural information can be obtained to better than atomic resolution. The earliest photocrystallographic studies with linkage isomers were carried out on metal–nitrosyl complexes, including seminal work by Coppens et al. on sodium nitroprusside.5 Since then, several linkage isomer switches have been studied using photocrystallographic methods, including nitrosyl,6–9 sulfur dioxide10–13 and nitrite14–19 compounds.
A viable solid state photo-switch requires maximum, preferably 100%, conversion between its GS and metastable state (MS). Much of the recent work on nitrite linkage isomer switches has aimed to maximise the overall level of photo-activation that can be achieved in a single crystal, with the first 100% conversion between a GS nitro-(η1-![[N with combining low line]](https://www.rsc.org/images/entities/char_004e_0332.gif) O2) and MS endo-nitrito-(η1-
O2) and MS endo-nitrito-(η1-![[O with combining low line]](https://www.rsc.org/images/entities/char_004f_0332.gif) NO) isomer reported for [Ni(dppe)(NO2)Cl] (dppe = 1,2-bis(diphenylphosphino)ethane).14 Building on this success, several other metal–nitrite systems are now known to undergo 100% conversion to metastable nitrito-(η1-
NO) isomer reported for [Ni(dppe)(NO2)Cl] (dppe = 1,2-bis(diphenylphosphino)ethane).14 Building on this success, several other metal–nitrite systems are now known to undergo 100% conversion to metastable nitrito-(η1-![[O with combining low line]](https://www.rsc.org/images/entities/char_004f_0332.gif) NO) isomers.17,18,20
NO) isomers.17,18,20
Another important consideration is the temperature range over which the excited state (ES) can be stabilised, as this necessarily dictates the operating temperature of a potential photo-switch. Steady-state photocrystallographic studies aimed at determining the 3D structure of MS linkage isomers are conducted at sufficiently low temperature (typically <150 K) to ensure that the MS lifetime is longer than the duration of the X-ray experiment. The term “metastable limit” is used frequently in the literature to describe a critical temperature above which the ES lifetime is shorter than the measurement timescale, and the MS isomer is then no longer observed. However, it has been shown that the rate of decay is strongly temperature dependent, with the ES lifetime increasing continuously as the measurement temperature is reduced.17 As such, the historical use of the term “metastable limit” can be misleading, since the values quoted are heavily dependent on the time resolution of the photocrystallographic method in use to determine it.
The rates of the forward GS → MS excitation and reverse MS → GS decay transformations throughout the bulk crystal are also important application parameters, as these set a limit on the rise and fall times of the photo-switch, respectively. As such, a good kinetic model of both switching pathways is crucial for the development of new linkage isomer crystals with properties tailored towards specific applications.
In order to follow the population dynamics of the GS ⇌ MS conversion in real time, there is a need to develop robust methodologies to experimentally determine solid state kinetic parameters. There are several studies utilising spectroscopic and thermal analysis techniques to infer reaction kinetics in photo-active linkage isomer complexes,21–24 but comparatively few employing X-ray diffraction methods. In principle, in situ photocrystallographic techniques can provide kinetic data on the linkage isomerism process, along with unambiguous three-dimensional structural information at all stages of the solid state transformation, which can ultimately deliver valuable mechanistic insight. Of the small number of reported X-ray kinetic studies on photo-active crystals, the majority focus on irreversible changes such as photo-dimerization reactions.25–28
Recently, we have measured kinetic parameters for the forwards nitro → nitrito and reverse nitrito → nitro processes in a small number of metal–nitrite linkage isomer crystals using preliminary photocrystallographic kinetic methods.16,17,20 We now report a further refinement of these techniques towards a robust method for the analysis of solid state kinetics from in situ X-ray diffraction data. For a model linkage isomer system, we explore the key variables of temperature and irradiation time and obtain detailed information on the excitation and decay processes, including reaction rates, activation energies and the temperature-dependent lifetimes of the MS population in the single crystal. The kinetic model is used to develop a numerical-simulation tool that allows the population dynamics in the linkage isomer system to be modelled under a broad range of scenarios, and we apply this technique to explore the feasibility of crystallographic pump–probe measurements in the future.
Experimental
A. Model solid state linkage isomer complex
Photocrystallographic studies were carried out on the Pd(II)–nitrite system [Pd(Bu4dien)(NO2)]BPh4 (1; Bu4dien = N,N,N′,N′-tetrabutyldiethylenetriamine). Crystals of the THF solvate, 1·THF, undergo photo-switching between GS nitro-(η1-![[N with combining low line]](https://www.rsc.org/images/entities/char_004e_0332.gif) O2) and MS endo-nitrito-(η1-
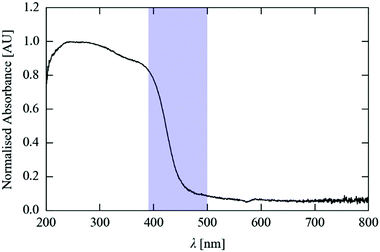
O2) and MS endo-nitrito-(η1-![[O with combining low line]](https://www.rsc.org/images/entities/char_004f_0332.gif) NO) isomers on irradiation at λ = 400 nm (Fig. 1).201·THF crystals achieve the fastest 100% GS → MS photo-conversion yet reported for a single-crystal linkage isomer. They are highly robust, surviving many repeated exposures to both light and X-ray irradiation with little evidence of degradation. These factors make 1·THF a promising test system for the development of photocrystallographic kinetic methods. Full details of the preparation of 1 and 1·THF can be found elsewhere,20 and full X-ray datasets for the GS and MS isomers of 1·THF are given in the ESI.†
NO) isomers on irradiation at λ = 400 nm (Fig. 1).201·THF crystals achieve the fastest 100% GS → MS photo-conversion yet reported for a single-crystal linkage isomer. They are highly robust, surviving many repeated exposures to both light and X-ray irradiation with little evidence of degradation. These factors make 1·THF a promising test system for the development of photocrystallographic kinetic methods. Full details of the preparation of 1 and 1·THF can be found elsewhere,20 and full X-ray datasets for the GS and MS isomers of 1·THF are given in the ESI.†
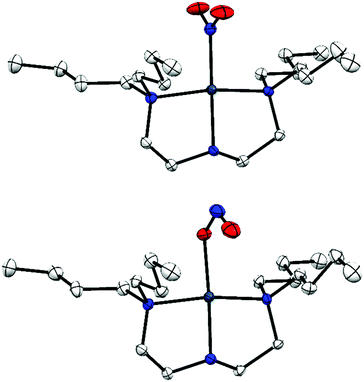 | ||
Fig. 1 Single-crystal X-ray structure of the photo-active cation in 1·THF, with thermal ellipsoids at 50% probability and hydrogen atoms removed for clarity. Top: Ground state (GS) nitro-(η1-![[N with combining low line]](https://www.rsc.org/images/entities/char_004e_0332.gif) O2) isomer; bottom: metastable state (MS) nitrito-(η1- O2) isomer; bottom: metastable state (MS) nitrito-(η1-![[O with combining low line]](https://www.rsc.org/images/entities/char_004f_0332.gif) NO) isomer.20 NO) isomer.20 | ||
B. Single-crystal X-ray crystallography
Single-crystal X-ray data were collected at the University of Bath using a dual-source Rigaku Oxford Diffraction Gemini A Ultra diffractometer equipped with an Atlas CCD detector, and an Oxford Cryosystems CryojetXL system for temperature control. Single-crystal X-ray data were also collected at Diamond Light Source (DLS) Beamline I19, using a four-circle Newport diffractometer equipped with a Pilatus 300 K detector and an Oxford Cryosystems 700 Series system for temperature control. At both locations, data were indexed and integrated using the Rigaku Oxford Diffraction software CrysAlis Pro.29 Structures were solved by dual-space methods using SHELXT30 and refined by full-matrix least-squares on F2 using SHELXL.31On DLS Beamline I19, crystals were illuminated at 410 nm using a Vibrant (He) 355, 10 Hz pulsed laser (5 ns pulse duration) from Opotek. The laser was defocused to produce a 4 × 4 mm (FWHM) beam at the target position, ensuring good overlap between the laser spot and sample. The laser power at the sample position was adjusted to 15 mW using a Leysop high-power laser attenuator.
To study the photo-excitation process, a crystal mounted on the lab setup was flash-cooled to the target temperature, ensuring zero initial excitation, and irradiated using the LED ring array at full brightness for a total of 160 s, whilst the crystal was continuously spun about the phi axis. During this period, the irradiation was paused at intervals of 10, 20, 40, 80 and 160 s, and single-crystal X-ray datasets were collected. This process was then repeated between 100 and 200 K at 20 K intervals. Since the excited state is metastable over this temperature range,20 this procedure allows the GS → MS conversion to be measured as a function of temperature and irradiation time/fluence.
To measure the MS decay, a single-crystal was irradiated in situ on the diffractometer for 15 min at 200 K. At 200 K the excited state is metastable, and an initial dataset recorded at this temperature confirmed that a consistent 100% MS occupancy was achieved on both setups. The cryostream was then adjusted to the target decay temperature, and further datasets were recorded continuously until the initial MS population was deemed to have fully decayed and the GS population stabilised to a constant value. This process was then repeated across a range of suitable measurement temperatures (lab source: 212.5–230 K, synchrotron: 230–255 K).
C. Solid state kinetic modelling
We,16,17,20 and others,25–28 have previously shown that the Johnson,33 Mehl, Avrami34–36 and Kolmogorov37 (JMAK) model provides a good fit to single-crystal-to-single-crystal photo-transformation data. JMAK theory is based on a geometrical nucleation and growth model,38 and has been used successfully to model a variety of solid state phase transformations.39–41
The fraction of a growing phase α at time t is given by:
| α(t) = 1 − e−ktn | (1) |
| α(t) = e−ktn | (2) |
| D = 1 − n | (3) |
| αMS(t) = α∞MS + (α0MS − α∞MS)e−ktn | (4) |
Finally, we find that the temperature dependence of the JMAK rate constant is well fitted by the Arrhenius law:
 | (5) |
Under the assumption that the Avrami exponent n remains constant with temperature, this expression allows additional kinetic parameters – principally an activation energy for the rate-limiting process – to be extracted from a set of excitation or decay measurements made over a range of temperatures.
The shape of the JMAK function (eqn (4)) is very sensitive to the values of k and n, and we found that the best fits could be obtained by imposing the constraint that n be the same for all datasets in a given set of experiments. Given that n is expected to be a material parameter – at least to first approximation – and therefore should not be strongly temperature dependent, we consider this to be a reasonable assumption.
To avoid the optimisation finding local minima, for each dataset we swept a range of initial guesses for k spanning 102 to 10−8 s−n, and selected the guess with the smallest initial RMS error as input to the optimisation routine. The rate constants k obtained from the variable temperature decay and photo-excitation experiments were fitted to eqn (5) using the least-squares polynomial-fitting routines in the NumPy library.45 Our data-fitting and analysis code has been made available online as a small Python library.46
Results and discussion
A. Preliminary experiments
To accurately follow linkage isomer switching as a function of temperature and time, it was first necessary to identify, optimise and ultimately to control other external variables that could strongly influence the conversion process. For the forward photo-excitation reaction, it is in principle important to choose an optimum LED wavelength, and also to tightly control the output from the excitation source to ensure that the sample receives a consistent level of illumination. Furthermore, the crystal size is expected to influence both the forward excitation and reverse decay processes, as this could affect both the penetration depth of the light and the ability of the cryostream flow to maintain an even temperature across the sample. To investigate these variables, and to optimise the conditions required for the full kinetic experiments, a series of preliminary tests were first carried out on 1·THF.Fig. 3 shows the conversion levels achieved as a function of (estimated) fluence. At 100% duty cycle, based on the emittance angle of the LEDs, the distance to the sample, and the 120 s exposure time, we estimate a fluence of 224 J cm−2, which is scaled by the chosen waveform duty cycle. The key result from these tests is that the conversion is non-linear with illumination level, at least over the range tested here, which is to be expected if the photo-excitation kinetics follow a JMAK-like model (eqn (4)). Fig. 3 also shows that above a certain illumination power the excitation will saturate. A consequence of this is that there will be a cut-off point where stronger illumination levels provide little or no improvement in excitation speed; in fact, higher illumination levels could even be detrimental to the excitation level and/or damaging to the sample due to heating. It is particularly interesting that this limit is apparently close to being reached with a relatively low-power LED array, given that photocrystallographic studies regularly utilise laser sources that provide much stronger illumination.
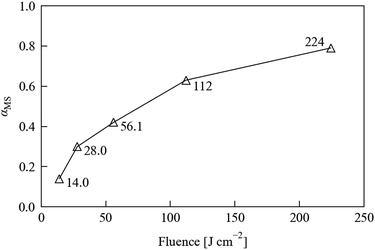 | ||
| Fig. 3 MS occupancy αMS in a 1·THF crystal, refined from single-crystal X-ray datasets recorded after 120 s irradiation using an LED array with estimated fluences ranging from 14 to 224 J cm−2. | ||
Nonetheless, at the largest fluence our array achieves a higher excitation level in 120 s of illumination than at any of the reduced fluences, and we observed no degradation of the test crystal during this set of experiments, indicating that using our laboratory setup at full brightness does not cause appreciable damage to the sample. Based on these considerations, we opted to leave the array at full brightness for the subsequent experiments.
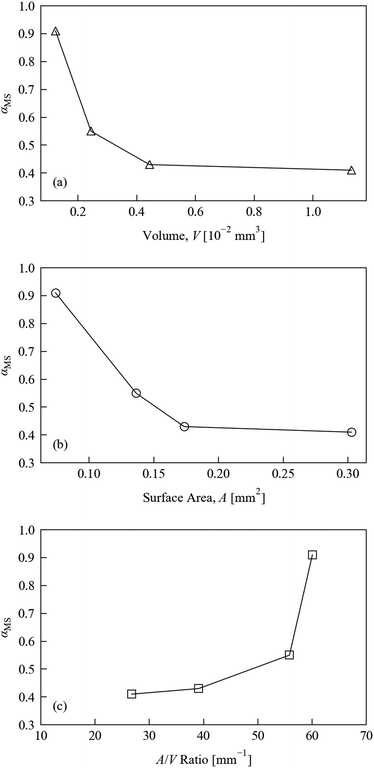
Four crystals of 1·THF of varying dimensions were chosen within the limits of those suitable for study using the laboratory set-up. Each crystal was flash-cooled to 100 K before being subject to 120 s of irradiation with the LED array at 25% duty cycle (56 J cm−2 fluence). The reduced illumination level was chosen based on the results of the previous tests, to intentionally prevent 100% conversion and thus make it easier to identify trends.
Fig. 4 displays the variation in MS occupancy obtained under these conditions with respect to (a) crystal volume V, (b) crystal surface area A, and (c) surface-area-to-volume ratio A/V. There is a marked reduction in the excitation level with increasing crystal volume. The excitation level with respect to surface area shows similar behaviour, while comparison of the excitation fraction to the surface-area-to-volume ratio shows the reverse trend. We note, however, that the non-linear excitation observed during the illumination level tests would make it difficult to extract meaningful relationships, and so we only discuss these trends qualitatively.
The surface-area-to-volume ratio plot suggests that the crystal shape could in principle be optimised to maximise the photo-conversion level: taken at face value, the larger excitation level obtained for crystals with larger A/V ratios suggests that crystals with plate-like morphologies are preferable to block-shaped samples for achieving fast photo-excitation. This interpretation is further qualified by visual inspection of the four crystals used in these tests, images of which are included in the ESI† (Fig. S3). This cannot be completely confirmed from the present tests, however, since it is impossible to obtain crystals which differ only in one variable, but given that the penetration of light into the crystal is known to be a limiting factor in the photo-excitation process, this conclusion makes intuitive sense. However, it should be noted that this type of morphology is generally not favourable for single-crystal X-ray studies, since thin, plate-like crystals tend to show reduced diffraction intensity. As such, in practice a compromise is needed between the optimum dimensions for illumination and X-ray diffraction.
These preliminary size test results do unambiguously highlight the importance of keeping the crystal morphology as consistent as possible during photo-kinetic studies. Indeed, the ideal situation from this point of view would be to conduct as many comparable experiments as possible on the same single-crystal. Of course, this may not always be practical, especially for systems where exposure to X-rays or high-intensity illumination causes degradation over time.
B. Nitro-to-nitrito photo-excitation kinetic studies
Quantitative kinetic analysis of the forwards nitro → nitrito photo-isomerisation process can provide key information on real-world properties, in particular the “rise time” of a potential photo-switch. The procedure used to follow the photo-isomerisation in 1·THF with respect to time is outlined in the Experimental section, and the results of these experiments are presented in Table 1 and Fig. 5.| T [K] | α 0MS | α ∞MS | k [10−2 s−n] | n | RMS [%] |
|---|---|---|---|---|---|
| 100.0 | 0.00 | 1.00 | 1.53 | 1 | 0.68 |
| 120.0 | 0.00 | 1.00 | 2.11 | 2.33 | |
| 140.0 | 0.00 | 1.00 | 2.48 | 3.23 | |
| 160.0 | 0.00 | 1.00 | 2.81 | 2.60 | |
| 180.0 | 0.00 | 1.00 | 3.15 | 1.76 | |
| 200.0 | 0.00 | 1.00 | 3.28 | 3.87 |
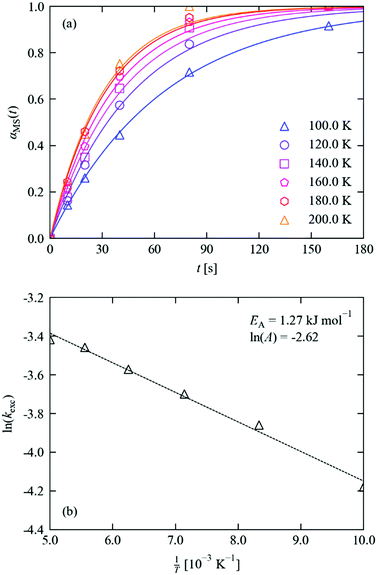 | ||
| Fig. 5 (a) MS population in 1·THF as a function of irradiation time at 100–200 K. Markers show the refined occupations, solid lines indicate fits to the JMAK model (eqn (4)), with parameters given in Table 1. (b) Fit of the extracted rate constants to the Arrhenius equation (eqn (5)), with parameters as marked. | ||
The excitation profiles in Fig. 5a were fitted to eqn (4), which provided a good fit to all six datasets with a typical RMS deviation between the measured and fitted occupations of <2%. By fitting the Avrami constant, we obtained a value of n = 1.18, which points towards zero-dimensional growth of the incipient MS phase and suggests that irradiation leads to a homogeneous spread of nucleation sites for the photoexcited state throughout the bulk. The value of n ≈ 1 is also consistent with other photo-kinetic studies on linkage isomer systems.16,17,20 Since, as noted above, the fit is very sensitive to the values of k and n, and requiring n to be an integer value is intuitive given its physical interpretation as a dimensionality of growth, we also performed fits with the Avrami constant fixed to n = 1. We obtained fits of similar quality (RMS < 4%), and therefore opted to work with the latter set of fits in our analysis. Table 1 lists the fitted initial and final MS occupations and kinetic parameters for the datasets, and fits obtained without fixed n are shown in the ESI† for comparison.
We also note that, although there is precedent for modelling photo-excitation curves with JMAK kinetics,25–28 the physical interpretation of the rate constant k is not straightforward. A JMAK equation with n = 1 and α0MS = 0, i.e. αMS(t) = α∞MS(1 − e−kt) is effectively equivalent to the simple exponential fitting function Hinf(Q) = Htot(1 − e−Q/Q0) applied in the work in ref. 24. Furthermore, a derivation based on first-order excitation kinetics with a Beer–Lambert attenuation of the light intensity from the surface to the centre of the crystal (see ESI,† Section S5) yields a more complex functional form with a striking resemblance to the JMAK model (Fig. S4, ESI†). However, in this model the rate constant depends on the crystal volume, the incident photon flux, and the attenuation with depth; although entirely intuitive, this highlights the point that the effective rate constants derived from this fitting procedure are unlikely to be transferrable between different crystal morphologies and/or excitation sources, the former of which was borne out during our preliminary tests on crystal size. In the present study, we therefore restrict ourselves to a consistent crystal size and shape and quote the rate constant as a fitting parameter rather than attempting to interpret its value in terms of underlying molecular processes.
The constant k increases with temperature, for which the Arrhenius expression (Fig. 5b) with a small activation energy and prefactor of EA = 1.27 kJ mol−1 and ln![[thin space (1/6-em)]](https://www.rsc.org/images/entities/char_2009.gif) A = −2.62 yields a good fit.
A = −2.62 yields a good fit.
This “activation energy” is significant enough that the excitation is noticeably faster at higher temperatures over the 100–200 K range covered by our measurements. Although, as for the rate constants, we must be cautious of assigning a physical interpretation to the fitting parameters, there are intuitive physical explanations for why the observed excitation rate might be weakly temperature dependent. Since the isomerisation reaction requires the movement of three individual atoms per asymmetric unit of the crystal, thermal crystal expansion of the crystal with temperature may facilitate the atomic rearrangement and thus promote faster switching at higher temperature. Alternatively, it is also possible that the absorption cross section and/or attenuation of light towards the centre of the crystal may change slightly with temperature.
We also note that the barrier is much smaller than the approx. 3.1 eV (300 kJ mol−1) energy of the exciting photons, which implies that the initial electronic excitation is followed by a separate rate-limiting process. This is in-line with other studies into the mechanisms of linkage isomer conversion.49,50
Previous studies have highlighted the influence that the surrounding crystalline environment can have on the progress of the photoreaction.9,20,51 Intermolecular interactions involving the isomerising ligand are particularly influential, as these must be broken and/or (re)formed to facilitate the atomic rearrangements necessary for photoswitching to occur. Our recent work has highlighted the important effect that hydrogen bonding to the nitrite ligand can have on the nitro ⇌ nitrito process,19,51 leading us to consider how intermolecular interactions can influence the photoswitching kinetics in 1.
The crystal packing arrangement in the GS of 1 at 100 K has been reported previously,20 and the molecular arrangement remains largely unchanged on heating, aside from the expected thermal expansion of the crystal. In particular, no strong classical hydrogen bonds involving the nitro group are observed in the GS structures of 1 at any of the temperatures studied. However, the nitro ligand does form several weaker C–H⋯O interactions with neighbouring molecules. At 100 K, six independent C–H⋯O contacts to NO2 can be identified, with H⋯O distances ranging from 2.610–3.073 Å and a mean length of 2.853 Å. At 200 K, the same six C–H⋯O contacts are retained, but the bond lengths increase to 2.627–3.190 Å (mean value of 2.904 Å). This provides a potential rationale for the small apparent temperature dependence of the photo-isomerisation rate: the longer C–H⋯O contacts suggest an overall slightly weaker set of interactions, which are overcome more easily and thus promote faster nitro → nitrito conversion. The measured C–H⋯O contact distances at 100 and 200 K are tabulated in the ESI.†
Our previous work also highlights the use of the “reaction cavity” concept52–54 to rationalise the progress of single-crystal-to-single-crystal linkage isomer conversion. The reaction cavity is defined as the volume encapsulating the photoactive fragment in the crystal, and an assessment of its size can be made using the void space analysis routines in the CCDC software Mercury.55 Reaction cavity analyses on the GS of 1 at 100 and 200 K shows a small increase in the size of the reaction cavity on heating, from 1.08% of the volume per molecule to 1.15%, suggesting there is more space available for the nitro nitrito conversion at higher temperature (see ESI†). This provides further rationale for the small temperature dependence of the photo-isomerization. Again, however, we note that the interpretation of the Arrhenius-like temperature dependence of the observed excitation rate may include factors not accounted for in this analysis.
C. Nitrito-to-nitro decay kinetic studies
The reverse nitrito → nitro decay process sets not only the “fall time” of a potential photo-switch, but also the lifetime and stability of the photo-induced metastable state. As for the excitation, the MS → GS decay in crystals of 1·THF was followed in situ by single-crystal X-ray diffraction following the procedure outlined above.Fitting of the decay profiles with a variable Avrami exponent yielded a value of n = 0.85, which is on the same order as that obtained from the photo-excitation kinetic studies and is again indicative of zero-dimensional (uncooperative) decay. Fixing the exponent to an integer value produced similar fits (max. RMS error of 3.2% vs. 2.6%), and yielded a similar activation energy when the rate constants were fit to an Arrhenius equation (60.3 vs. 58.5 kJ mol−1); we therefore opted to use the fixed-n results in our analysis (Fig. 6 and Table 2), but we include the variable-n results in the ESI† for comparison. As evident in the measured decay curves, the large activation barrier results in a strongly temperature-dependent decay rate.
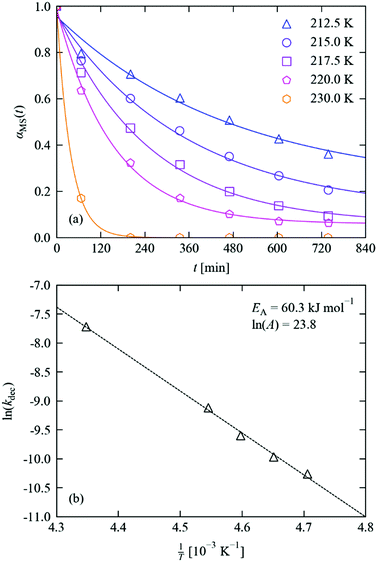 | ||
| Fig. 6 (a) MS population in 1·THF as a function of time during decay studies performed at 212.5–230 K. Markers show the refined occupations, solid lines indicate fits to the JMAK model (eqn (4)), with parameters given in Table 2. (b) Fit of the extracted decay rate constants to the Arrhenius equation (eqn (5)), with parameters as marked. | ||
| T [K] | α 0MS | α ∞MS | k [10−5 s−n] | n | RMS [%] |
|---|---|---|---|---|---|
| 212.5 | 0.96 | 0.22 | 3.49 | 1 | 3.17 |
| 215.0 | 0.96 | 0.11 | 4.68 | 2.65 | |
| 217.5 | 0.97 | 0.06 | 6.77 | 2.20 | |
| 220.0 | 0.99 | 0.06 | 10.96 | 1.24 | |
| 230.0 | 1.00 | 0.00 | 44.49 | 0.18 |
It is instructive to further explore the relation between the kinetic parameters and the temperature dependence of the MS lifetime. Assuming a 100% initial MS occupation, from eqn (2) the time tx required for the occupation to fall to αx is derived as:
 | (6) |
Combining eqn (6) with the Arrhenius model (eqn (5)) affords an expression for the explicit temperature dependence of tx:
 | (7) |
From eqn (7), we can extract three observations: (1) larger activation energies increase tx for a given temperature, T; (2) the lifetime of the MS is a continuous function of temperature; and (3) higher-dimensional growth (i.e. larger values of n) lead to accelerated decay. The first observation is easily appreciated from the Arrhenius equation. The second observation is more interesting, as it reinforces the point that the “metastable limit” – which has historically been used as a figure-of-merit to compare the stability of the photo-excited state in linkage isomer systems3,8,17,20 – is dependent on the timescale of experiment method in use. The third observation is perhaps also intuitive, as it indicates that a cooperative switching process will lead to faster conversion rates. However, this could in principle be harnessed as an additional means of tuning the linkage isomerism kinetics: coupling individual photo-active species to make the excitation and/or decay cooperative.
This in turn suggests that new approaches to design cooperative linkage isomer systems may produce photo-switches with faster kinetics, whereas strategies aimed at reducing the activation barrier may yield diminishing returns, particularly with respect to the already-small apparent barrier to excitation. Conversely, however, the most successful route to high photo-conversion reported to-date has been the engineering of large reaction cavities in which the isomerisation can take place with little steric constraint,3,14,20 and this strategy favours the photo-active species being well separated from one another, ruling out cooperativity by design.
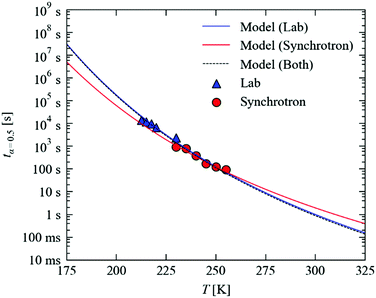
Fig. 7 plots the temperature dependence of tx=0.5, using the Arrhenius parameters in Fig. 6b and n = 1, from 175–325 K. Over this temperature range, tx=0.5 is predicted to range from around 107 s (115 days) to 100 ms, spanning some eight orders of magnitude.
On our lab source, a full data collection requires around two hours. With the much higher X-ray flux and state-of-the-art detector technology available at synchrotron facilities, the same experiments can easily be performed in minutes. To assess the predictive capability of our model, we performed additional decay measurements at higher temperatures on Beamline I19 of the DLS facility (Fig. 7; the decay curves, data fitting and parameters are given in the ESI†).
We find that the faster decay kinetics are still a good fit to the JMAK expression in eqn (4), and the temperature dependence of the rate constant is well fit by the Arrhenius law in eqn (5). With the Avrami exponent n fixed to 1, we obtain kinetic parameters of EA = 51.6 kJ mol−1 and ln(A) = 19.7, which are not too far removed from the values obtained from experiments on the lab source. On the other hand, if n is allowed to vary, we obtain somewhat different values of EA = 37.4 kJ mol−1, ln(A) = 13.7 and n = 0.8. Despite the large differences, however, the fit parameters obtained with n fixed to 1 differ only slightly in the maximum RMS error (1.3 vs. 3.1%), which further highlights the sensitivity of the fitting and thus the need for careful measurements. In the present set of experiments, we put the discrepancy between the laboratory and synchrotron measurements down to experimental factors, in particular (1) the significantly different crystal sizes required for the two sets of measurements, which could, as noted in Section A.3 above, allow for more efficient temperature regulation, and (2) the much higher X-ray flux used in these experiments, which may lead to faster crystal damage and/or accelerated decay. Nonetheless, we find that for both sets of fitting parameters the tx=0.5 values predicted using laboratory model are within a factor of 2 (<10 K; see ESI†) which we consider to be useful accuracy.
Fig. 7 shows that, as expected, the different kinetic parameters obtained from the faster measurements predict a different temperature dependence of the MS lifetimes, with the offset between the two curves reaching an order of magnitude at large extrapolations. By fitting both sets of data simultaneously, we obtain kinetic parameters of EA = 60.5 kJ mol−1 and ln(A) = 24.0, which are virtually identical to the laboratory results and hence, as can be seen in Fig. 7, predict a similar temperature dependence.
These results demonstrate that reasonable extrapolation of the laboratory measurements may provide a usable indication of the temperatures required to access the faster timescales that can be probed at a synchrotron source. The simple analysis developed here is therefore a valuable tool for designing and optimising time-resolved X-ray experiments, and the strong temperature dependence of the MS lifetime highlights the utility of linkage isomers as model systems for such endeavours.
D. Numerical simulations and photostationary steady-state occupations
In the previous two subsections, we studied the kinetics of the photo-excitation and decay processes independently. If the sample is illuminated continuously, at a temperature where the timescales of both processes are comparable, the MS population will reach a photostationary equilibrium (i.e. a steady-state, which is also sometimes referred to as a pseudo-steady-state in the photocrystallographic literature). There is no simple analytical form using the JMAK and Arrhenius equations to predict the steady-state occupation at a given temperature. However, given kinetic models of the excitation and decay processes, the time evolution of the MS population and its equilibrium value under a given set of conditions can be modelled by numerical simulation.To do this, we separate time into discrete steps Δt, and make the approximation that all kinetic processes act independently over this interval. At time t, we use the MS population αMS(t) to calculate an “effective time” t′ defining the progress of the transformation with respect to each kinetic process, and hence evaluate the change in αMS over the interval t → t + Δt. αMS(t + Δt) is then obtained from αMS(t) by summing the changes due to all the independent processes, and clamped to the range [0,1]. Given the exponential change in αMS with time, it is sensible to use a variable time step for accuracy and computational speed; in our implementation, the step is continually adjusted so that the fastest process leads to a maximum change in αMS of 10−4 (0.01%), up to a ceiling of Δt = 1 s.
As for the data fitting, the simulator was implemented in Python 3, and our code is available online as part of the same package.44 The simulator can be operated in one of two ways. Firstly, simulations can be run with fixed kinetic parameters until αMS stabilises from an initial value to within a set threshold. This allows the model to predict excitation and decay curves, as well as the steady-state occupation αSS reached under continuous illumination at higher temperatures, when both processes are active. Secondly, simulations can be run under variable conditions, e.g. time-dependent excitation with background decay, which allows the evolution of αMS(t) during hypothetical pump–probe experiments to be studied.
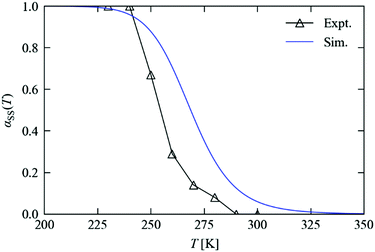
Fig. 8 compares the measured and predicted temperature-dependence of the steady-state occupation, αSS, between 200 and 350 K. From the measurements, the occupation falls from 100% to 0% over a window of around 225–300 K. The temperature dependence predicted from the simulations covers a broader range of approx. 225–325 K, with a maximum offset on the order of 20 K. If the parameters from the variable-n fits are used instead of fixing n = 1, the offset is reduced to around 10 K (see ESI†). For the kinetic model to predict steady-state behaviour to this level of accuracy, at temperatures significantly above those where it was parameterised, is remarkable, and lends a high level of confidence to both the model and to this simulation technique.
We next set out to explore the practicalities of single-crystal pump–probe X-ray diffraction measurements on minute-to-millisecond timescales. Fig. 9 shows the time evolution of αMS through a series of simulated excitation-pulse sequences in which the excitation is switched on for texc = 2 min and the photo-generated MS population is subsequently allowed to decay for tdec = 20 min. At all temperatures bar the lowest 250 and 255 K tested, during the excitation period the system attains a steady-state population αSS, which is then removed entirely during the 20 minute decay period. The value of αSS attained and the time required for the excitation and decay processes to go to completion fall rapidly with temperature, such that at 280 K the αSS attainable under the illumination conditions used in this study is predicted to be 26%, but the excitation and decay complete in 33 and 45 s, respectively.
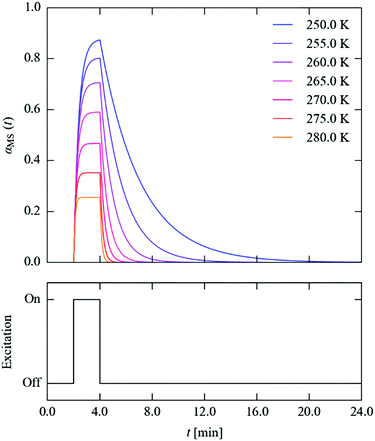 | ||
| Fig. 9 Time evolution of the metastable-state population αMS(t) (top panel) through a simulated excitation-decay pulse sequence (lower panel) at seven measurement temperatures from 250–280 K. | ||
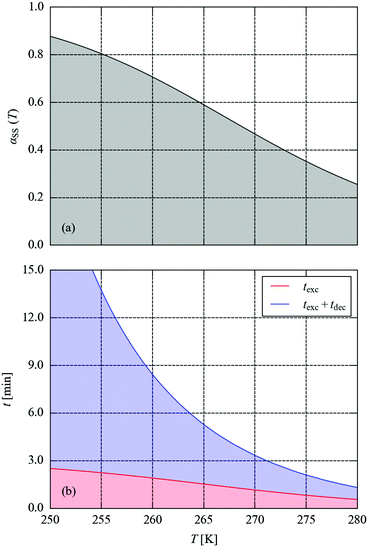
To explore this more systematically, we used the simulations to estimate the excitation and decay times required to attain the predicted maximum αSS and to subsequently remove it, over the temperature range of 250–280 K. In this window, αSS ranges from 88 to 26% (Fig. 10a). The combined texc + tdec required to attain this occupation to within 10−3 (0.1%) and to subsequently decay to <0.1% occupation ranges from 23 min at 250 K to just over a minute at 280 K (Fig. 10b). The 0.1% threshold was taken as a value below which any MS occupation could not be reliably refined crystallographically. These predictions reinforce the flexibility of these systems as a model for developing time-resolved photocrystallographic techniques: at 250 K, the decay curve could be comfortably measured in a sequence of full data collections at a synchrotron source, whereas measurements at 280 K would require an LED pump/X-ray probe setup.
An issue highlighted in Fig. 10 is the clear trade-off between the excitation/decay time and the steady-state αSS attainable at full excitation. The latter effectively sets the “dynamic range” ΔαMS for the measurements (i.e. the difference in the measured MS occupation between the initial and pumped states), which should ideally be maximised for a given timescale. Since the excitation and decay are both exponential in nature, it follows that it may be possible to achieve a higher ΔαMS by allowing for incomplete excitation and/or decay.
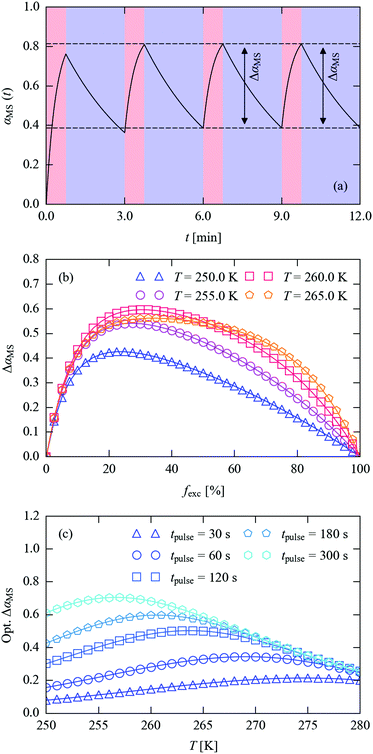
Fig. 11a illustrates this concept. With a pump–probe sequence in which the excitation and decay times do not allow either process to go to completion, after a short number of cycles the processes reach a state where ΔαMS remains constant. This comes about because the excitation and decay depend on the level of photo-excitation; with incomplete decay sequential pulses yield less additional excitation (despite delivering the same amount of illumination), while an increased excitation level at the end of a pump leads to greater decay in the following decay period, causing the system to converge towards a consistent time-dependent behaviour. We note in passing that if measurements are performed over a period significantly longer than the pump–probe cycle, an average αMS would be measured, which would be lower than the steady-state occupation achievable by continuous illumination. In the previous literature, this situation has been typically described as the “pseudo-steady-state” photocrystallographic method.17,56
For a fixed total pulse time and measurement temperature, the numerical simulations can be used to estimate the attainable ΔαMS as a function of the fraction of the time used for excitation, fexc, and hence to optimise the excitation and decay timings (Fig. 11b). Alternatively, given a target pulse time, the simulations can be used to estimate the largest ΔαMS attainable as a function of temperature (Fig. 11c).
For a 180 s total (texc + tdec) pulse period at 250 K, the optimum fexc is 0.22 (texc = 39 s), increasing to 0.25 and 0.28 (45/51 s) at 255 and 260 K, respectively (Fig. 11b). As the temperature is increased, the maxima in the ΔαMS/fexc curves become increasingly broad, and at 265 K the decay is sufficiently fast that the dynamic range begins to be limited by the maximum ΔαMS attainable with the excitation setup. This implies that, at or above this temperature, a shorter pulse time could be employed without loss of dynamic range.
Comparing the 250 K curve to the others in Fig. 11b shows that the balance of excitation and decay rates results in a higher achievable dynamic range at the higher temperatures for the 180 s pulse period. This is more clearly shown by the simulations in Fig. 11c, where the best achievable dynamic range shifts systematically towards higher temperatures as the length of the pulse is decreased.
We also used the simulations to find the highest dynamic range achievable with the constraint of complete MS decay between cycles at the five pulse times in Fig. 11c (see ESI†). This comparison illustrates clearly that the strategy shown in Fig. 11a can allow for a much higher dynamic range at lower measurement temperatures and for short pulses. At 250 K, the decay is too slow reach 10−3 (0.1%) occupancy from a measurable initial MS population at any of the five pulse lengths modelled, whereas allowing for incomplete decay yields ΔαMS values from 8% (64 ↔ 57%) with a 30 s pulse length to 61% (83 ↔ 22%) with a 300 s pulse length. As expected, the difference narrows at higher temperatures, although incomplete decay allows for 5.6× larger ΔαMS at 280 K for 30 s pulses, and a 2× larger range up to 260 K for 300 s pulses.
These points are all considerations that are likely to prove invaluable in designing single-crystal X-ray pump–probe experiments. Much of this analysis and discussion is of course at this stage hypothetical, but these tools provide clear predictions that can be verified experimentally, with the opportunity for continuous feedback between the kinetic model and experimental results, and thus for systematic, on-the-fly optimisation of experiment design.
Conclusions
This study has outlined the design and development of robust new methods to extract quantitative kinetic information from single-crystal X-ray diffraction data, and builds directly on the preliminary kinetic investigations reported in previous photocrystallographic studies on linkage isomers.17,20,57 The results illustrate that in situ X-ray diffraction methods can be easily adapted to follow both the photo-excitation and decay processes in real time and with variable temperature.The preliminary experiments reported here provide a thorough investigation of several key factors generally thought to affect linkage isomerism in the solid state, including the crystal size and shape, the choice of excitation wavelength and the illumination level. To the authors’ knowledge, this is the first study to explicitly address all these key factors together, and should be particularly informative to those conducting experiments in this new and challenging area.
The effective rate of the photo-excitation process is found to be weakly temperature dependent, a possible explanation for which is the effect of the crystal environment on the isomerisation. In contrast, kinetic studies following the reverse decay process indicate a large activation energy and a strong temperature dependence, leading to MS lifetimes that are tuneable through several orders of magnitude by careful temperature control. This property makes solid state linkage isomer crystals an ideal test-case system for pump–probe diffraction experiments: by varying the experiment temperature, it should be possible to “dial up” an MS lifetime to suit the parameters of the time-resolved set-up.
Finally, we have developed a numerical-simulation code based on our kinetic model that is both highly flexible and usefully accurate in its predictions of the evolution of the MS population under a variety of simulated experimental conditions. Preliminary exploration of potential pump–probe experiments highlights the trade-off that must be made between temperature, pump–probe cycle time and the “dynamic range” between the initial and pumped states, and we propose a strategy for increasing the dynamic range for low measurement temperatures and short timescales.
We envisage that this tool will be a powerful aid in designing and optimising new time-resolved photocrystallographic studies across a range of timescales, potentially making the complex preparation for pump–probe X-ray diffraction studies at synchrotron and X-FEL sources much easier and facilitating the best possible outcomes from the limited experiment time available at these facilities.
Data-access statement
Crystal structures of the ground and metastable state (GS/MS) forms of 1·THF are available from the Cambridge Crystallographic Data Centre under CCDC refcodes WABGUE and WABHAL. Our data-fitting and numerical-simulation codes are available online as an open-source Python library.44 The repository includes the data and scripts used to perform the analysis in this paper as examples. Any other data may be obtained from the authors on request.Conflicts of interest
There are no conflicts to declare.Acknowledgements
LEH and PRR are grateful for support from the UK Engineering and Physical Sciences Research Council (EPSRC; grant no. EP/K004956/1). JMS is also supported by the EPSRC (EP/K004956/1, EP/P007821/1). We are also grateful to the Diamond Light Source for support and the EPSRC through grants associated with the Research Complex at Harwell (RCaH) (EP/M010481/1 and EP/I01974X/1).Notes and references
- K. Lang, D. Buzek, J. Zelenka, P. Ulbrich, T. Ruml, I. Krizova, J. Lang, P. Kubat, J. Demel and K. Kirakci, J. Mater. Chem. B, 2017, 5, 1815–1821 RSC.
- J. Liu, L. Zhang, J. Lei, H. Shen and H. Ju, ACS Appl. Mater. Interfaces, 2017, 9, 2150–2158 CAS.
- L. E. Hatcher and P. R. Raithby, Acta Crystallogr., Sect. C: Cryst. Struct. Commun., 2013, 69, 1448–1456 CrossRef CAS PubMed.
- P. Coppens, Angew. Chem., Int. Ed., 2009, 48, 4280–4281 CrossRef CAS PubMed.
- M. D. Carducci, M. R. Pressprich and P. Coppens, J. Am. Chem. Soc., 1997, 119, 2669–2678 CrossRef CAS.
- P. Coppens, D. V. Fomitchev, M. D. Carducci and K. Culp, Dalton Trans., 1998, 865–872 RSC.
- D. V. Fomitchev, T. R. Furlani and P. Coppens, Inorg. Chem., 1998, 37, 1519–1526 CrossRef CAS.
- P. Coppens, I. Novozhilova and A. Kovalevsky, Chem. Rev., 2002, 102, 861–884 CrossRef CAS PubMed.
- B. Cormary, S. Ladeira, K. Jacob, P. G. Lacroix, T. Woike, D. Schaniel and I. Malfant, Inorg. Chem., 2012, 51, 7492–7501 CrossRef CAS PubMed.
- A. Y. Kovalevsky, K. A. Bagley, J. M. Cole and P. Coppens, Inorg. Chem., 2002, 42, 140–147 CrossRef PubMed.
- K. F. Bowes, J. M. Cole, S. L. G. Husheer, P. R. Raithby, T. L. Savarese, H. A. Sparkes, S. J. Teat and J. E. Warren, Chem. Commun., 2006, 2448–2450 RSC.
- A. E. Phillips, J. M. Cole, T. d’Almeida and K. S. Low, Phys. Rev. B: Condens. Matter Mater. Phys., 2010, 82, 155118 CrossRef.
- S. O. Sylvester and J. M. Cole, Adv. Mater., 2013, 25, 3388 CrossRef CAS.
- M. Warren, S. Brayshaw, A. Johnson, S. Schiffers, P. Raithby, T. Easun, M. George, J. Warren and S. Teat, Angew. Chem., Int. Ed., 2009, 121, 5821–5824 CrossRef.
- L. E. Hatcher, M. R. Warren, D. R. Allan, S. K. Brayshaw, A. L. Johnson, S. Fuertes, S. Schiffers, A. J. Stevenson, S. J. Teat, C. H. Woodall and P. R. Raithby, Angew. Chem., Int. Ed., 2011, 50, 8371–8374 CrossRef CAS PubMed.
- S. E. Bajwa, T. E. Storr, L. E. Hatcher, T. J. Williams, C. G. Baumann, A. C. Whitwood, D. R. Allan, S. J. Teat, P. R. Raithby and I. J. S. Fairlamb, Chem. Sci., 2012, 3, 1656–1661 RSC.
- L. E. Hatcher, J. Christensen, M. L. Hamilton, J. Trincao, D. R. Allan, M. R. Warren, I. P. Clarke, M. Towrie, D. S. Fuertes, C. C. Wilson, C. H. Woodall and P. R. Raithby, Chem. – Eur. J., 2014, 20, 3128–3134 CrossRef CAS PubMed.
- M. R. Warren, T. L. Easun, S. K. Brayshaw, R. J. Deeth, M. W. George, A. L. Johnson, S. Schiffers, S. J. Teat, A. J. Warren, J. E. Warren, C. C. Wilson, C. H. Woodall and P. R. Raithby, Chem. – Eur. J., 2014, 20, 5468–5477 CrossRef CAS PubMed.
- L. E. Hatcher, E. J. Bigos, M. J. Bryant, E. M. MacCready, T. P. Robinson, L. K. Saunders, L. H. Thomas, C. M. Beavers, S. J. Teat, J. Christensen and P. R. Raithby, CrystEngComm, 2014, 16, 8263–8271 RSC.
- L. E. Hatcher, CrystEngComm, 2016, 18, 4180–4187 RSC.
- D. Schaniel, T. Woike, C. Merschjann and M. Imlau, Phys. Rev. B: Condens. Matter Mater. Phys., 2005, 72, 195119 CrossRef.
- M. S. Lynch, M. Cheng, B. E. Van Kuiken and M. Khalil, J. Am. Chem. Soc., 2011, 133, 5255–5262 CrossRef CAS PubMed.
- T. Woike, W. Krasser, H. Zöllner, W. Kirchner and S. Haussühl, Z. Phys. D: At., Mol. Clusters, 1993, 25, 351–356 CrossRef CAS.
- D. Schaniel, T. Woike, B. Delley, C. Boskovic, D. Biner, K. W. Kramer and H.-U. Gudel, Phys. Chem. Chem. Phys., 2005, 7, 1164–1170 RSC.
- J. B. Benedict and P. Coppens, J. Phys. Chem. A, 2009, 113, 3116–3120 CrossRef CAS PubMed.
- D.-K. Cao, T. V. Sreevidya, M. Botoshansky, G. Golden, J. Brown Benedict and M. Kaftory, J. Phys. Chem. A, 2010, 114, 7377–7381 CrossRef CAS PubMed.
- R. More, G. Busse, J. Hallmann, C. Paulmann, M. Scholz and S. Techert, J. Phys. Chem. C, 2010, 114, 4142–4148 CAS.
- K. Konieczny, J. Bąkowicz and I. Turowska-Tyrk, J. Chem. Crystallogr., 2016, 46, 77–83 CrossRef CAS.
- CrysAlis Pro, Rigaku Oxford Diffraction Data Collection and Data Reduction GUI, Version 171.38.43.
- G. Sheldrick, Acta Crystallogr., Sect. A: Found. Adv., 2015, 71, 3–8 CrossRef PubMed.
- G. Sheldrick, Acta Crystallogr., Sect. C: Struct. Chem., 2015, 71, 3–8 CrossRef PubMed.
- S. K. Brayshaw, J. W. Knight, P. R. Raithby, T. L. Savarese, S. Schiffers, S. J. Teat, J. E. Warren and M. R. Warren, J. Appl. Crystallogr., 2010, 43, 337–340 CrossRef CAS.
- W. A. Johnson and R. F. Mehl, Metall. Mater. Trans. A, 2010, 41A, 2713–2775 Search PubMed.
- M. Avrami, J. Chem. Phys., 1939, 7, 1103–1112 CrossRef CAS.
- M. Avrami, J. Chem. Phys., 1940, 8, 212–224 CrossRef CAS.
- M. Avrami, J. Chem. Phys., 1941, 9, 177–184 CrossRef CAS.
- A. N. Shiryayev, in Selected Works of A. N. Kolmogorov: Volume II Probability Theory and Mathematical Statistics, ed. A. N. Shiryayev, Springer Netherlands, Dordrecht, 1992, pp. 188–192 Search PubMed.
- A. Khawam and D. R. Flanagan, J. Phys. Chem. B, 2006, 110, 17315–17328 CrossRef CAS PubMed.
- M. Bertmer, R. C. Nieuwendaal, A. B. Barnes and S. E. Hayes, J. Phys. Chem. B, 2006, 110, 6270–6273 CrossRef CAS PubMed.
- M. Fanfoni and M. Tomellini, Nuovo Cimento D, 1998, 20, 1171–1182 CrossRef.
- Y. Pang, D. Sun, Q. Gu, K.-C. Chou, X. Wang and Q. Li, Cryst. Growth Des., 2016, 16, 2404–2415 CAS.
- Python3: Python Software Foundation, Python 3, http://https://www.python.org, accessed on 27/07/2017.
- S. G. Nash, SIAM J. Numer. Anal., 1984, 21, 770–788 CrossRef.
- SciPy: E. Jones, E. Oliphant and P. Peterson, et al., SciPy: Open Source Scientific Tools for Python, 2001, http://www.scipy.org, accessed on 27/07/2017 Search PubMed.
- S. v. d. Walt, S. C. Colbert and G. Varoquaux, Comput. Sci. Eng., 2011, 13, 22–30 CrossRef.
- GitHub, https://github.com/JMSkelton/Linkage-Isomer-JMAK-Kinetics.
- V. Enkelmann, G. Wegner, K. Novak and K. B. Wagener, J. Am. Chem. Soc., 1993, 115, 10390–10391 CrossRef CAS.
- I. Abdelmoty, V. Buchholz, L. Di, C. Guo, K. Kowitz, V. Enkelmann, G. Wegner and B. M. Foxman, Cryst. Growth Des., 2005, 5, 2210–2217 CAS.
- D. Schaniel and T. Woike, Phys. Chem. Chem. Phys., 2009, 11, 4391–4395 RSC.
- G. Gallé, M. Nicoul, T. Woike, D. Schaniel and E. Freysz, Chem. Phys. Lett., 2012, 552, 64–68 CrossRef.
- L. E. Hatcher and P. R. Raithby, CrystEngComm, 2017, 19, 6297–6304 RSC.
- A. Natarajan and B. R. Bhogala, in Supramolecular Photochemistry, John Wiley & Sons, Inc., 2011, pp. 175–228 Search PubMed.
- E. V. Boldyreva, Solid State Ionics, 1997, 101–103(Part 2), 843–849 CrossRef CAS.
- Y. Ohashi, Acc. Chem. Res., 1988, 21, 268–274 CrossRef CAS.
- C. F. Macrae, I. J. Bruno, J. A. Chisholm, P. R. Edgington, P. McCabe, E. Pidcock, L. Rodriguez-Monge, R. Taylor, J. v. d. Streek and P. A. Wood, J. Appl. Crystallogr., 2008, 41, 466–470 CrossRef CAS.
- J. M. Cole, Chem. Soc. Rev., 2004, 33, 501–513 RSC.
- A. G. Jarvis, H. A. Sparkes, S. E. Tallentire, L. E. Hatcher, M. R. Warren, P. R. Raithby, D. R. Allan, A. C. Whitwood, M. C. R. Cockett, S. B. Duckett, J. L. Clark and I. J. S. Fairlamb, CrystEngComm, 2012, 14, 5564–5571 RSC.
Footnote |
| † Electronic supplementary information (ESI) available: Crystallographic data for the GS and MS forms of 1·THF; circuit diagram for the LED ring used to illuminate the sample in the laboratory setup; measurements of photoconversion as a function of LED wavelength; images of the four crystals used in the crystal-morphology tests; derivation of a photo-excitation rate equation assuming first-order kinetics and Beer–Lambert attenuation of incident photon flux; analysis of decay curves collected at Diamond Light Source and a comparison between predicted and measured decay half-lives; comparison of the predicted dynamic range in metastable-state occupation available for a set of pump–probe cycle times with and without the constraint of complete excited-state decay; and fits to experimental data with the JMAK exponent n allowed to vary. See DOI: 10.1039/c7cp05422j |
| This journal is © the Owner Societies 2018 |

