
 Open Access Article
 This Open Access Article is licensed under a Creative Commons Attribution-Non Commercial 3.0 Unported Licence
On the structural stability of crystalline ceria phases in undoped and acceptor-doped ceria materials under in situ reduction conditions†
Maged F.
Bekheet
 a,
Matthias
Grünbacher
b,
Lukas
Schlicker
a,
Albert
Gili
a,
Andrew
Doran
c,
Jan Dirk
Epping
d,
Aleksander
Gurlo
a,
Bernhard
Klötzer
b and
Simon
Penner
*b
a,
Matthias
Grünbacher
b,
Lukas
Schlicker
a,
Albert
Gili
a,
Andrew
Doran
c,
Jan Dirk
Epping
d,
Aleksander
Gurlo
a,
Bernhard
Klötzer
b and
Simon
Penner
*b
aFachgebiet Keramische Werkstoffe/Chair of Advanced Ceramic Materials, Institut für Werkstoffwissenschaften und -technologien, Technische Universität Berlin, Hardenbergstr. 40, 10623 Berlin, Germany
bInstitute of Physical Chemistry, University of Innsbruck, Innrain 52c, A-6020 Innsbruck, Austria. E-mail: simon.penner@uibk.ac.at; Tel: +43 512 507 58003
cAdvanced Light Source, Lawrence Berkeley National Laboratory Berkeley, California 94720, USA
dFakultät II : Mathematik & Naturwissenschaften, Institut für Chemie, Technische Universität Berlin, Hardenbergstr. 40, 10623 Berlin, Germany
First published on 3rd December 2018
Abstract
The reduction of pure and Sm-doped ceria in hydrogen has been studied by synchrotron-based in situ X-ray diffraction to eventually prove or disprove the presence of crystalline cerium hydride (CeHx) phases and the succession of potential structural phase (trans)formations of reduced cerium oxide phases during heating-cooling cycles up to 1273 K. Despite a recent report on the existence of bulk and surface CeHx phases during reductive treatment of pure CeO2 in H2, structural analysis by Rietveld refinement as well as additional 1H-NMR spectroscopy did not reveal the presence of any crystalline CeHx phase. Rather, a sequence of phase transformations during the re-cooling process in H2 has been observed. In both samples, the reduced/defective fluorite lattice undergoes at first a transformation into a bixbyite-type lattice with a formal stoichiometry Ce0.583+Ce0.424+O1.71 and Sm0.153+Ce0.393+Ce0.464+O1.73, before a transformation into rhombohedral Ce7O12 takes place in pure CeO2. This phase is clearly absent for the Sm-doped material. Finally, a triclinic Ce11O20 phase appears for both materials, which can be recovered to room temperature, and on which a phase mixture of bixbyite Ce0.663+Ce0.344+O1.67, rh-Ce0.603+Ce0.404+O1.70 and tri-Ce0.483+Ce0.524+O1.76 (for pure CeO2) or bixbyite Sm0.153+Ce0.473+Ce0.384+O1.69 and tri-Sm0.153+Ce0.313+Ce0.544+O1.77 (for Sm-doped CeO2) prevails. The absence of the rhombohedral phase indicates that Sm doping leads to the stabilization of the bixbyite phase over the rhombohedral one at this particular oxygen vacancy concentration. It is worth noting that recent work proves that hydrogen is indeed incorporated within the structures during the heat treatments, but under the chosen experimental conditions it has apparently no effect on the salient structural principles during reduction.
1. Introduction
Ceria (CeO2) and ceria-based oxides are among the most commonly employed promoting catalyst components and support materials for metal particles that can be found in the commercial industrial sector.1 Three-way catalysts for exhaust gas control are based on ceria as the material provides a high oxygen storage capacity.2–4 Supports for catalysts used for hydrocarbon5 or CO (ref. 6) oxidation are often made of ceria. Furthermore, ceria catalysts provide an economic way for the production of PEMFC grade H2via water–gas shift reaction and subsequent processing by the preferential oxidation of CO in a H2-rich atmosphere.7–9 Also, good activity for dehydrogenation/dehydration of alcohols, the decomposition of aldehydes and, recently, the hydrogenation of alkynes to alkenes was attested to ceria catalysts.10–13Doped ceria oxides can also be used in SOFC and SOEC construction. For this purpose, Gd- and Sm-doping is preferred, as it increases the oxide ion conductivity of pure CeO2 significantly.14 Moreover, the efficiency of proton ceramic fuel cells can be increased by expanding the reactive zone for water formation on the cathode side.15 Co-sintering of Gd0.15Ce0.85O2−δ and BaCe0.65Zr0.20Y0.15O3−δ is also possible, enabling the production of mixed protonic and electronic conducting composite ceramics with favourable properties for H2 separation membranes.16
The previous paragraphs list some of the most important applications of ceria and variations of ceria and make it clear that these materials are often in contact with hydrogen at elevated temperatures. Therefore, the system CeO2–H2 attracted a lot of scientific attention in the past. Ex situ X-ray diffraction and elastic neutron scattering were employed to identify and describe the structure of reduced ceria phases.17–21 Meticulous analysis of the acquired data led to the conclusion that many O deficient phases exhibit O vacancy ordering which leads to superstructure reflexes in diffraction patterns.17 The chemical formula of O vacancy ordered phases of reduced ceria obeys a homologous series of the form CenO2n−2.17 An example would be Ce7O12, where O vacancies are ordered along the room diagonal of the stringed unit cells.19,20 Interestingly, the formation of O vacancy ordered phases appears to be common for rare earth oxides such as CeO2−x, PrO2−x and TbO2−x.19 However, most of these results stem from ex situ X-ray diffraction and elastic neutron scattering studies, which do not provide access to the phases formed at different conditions of temperature and atmosphere during the catalytic reactions between the catalyst and the gas phase. Thus, in situ XRD studies are highly required. Interestingly, the Ce7O12 structure has been also prepared recently on a so called “inverse” model catalyst following thermal reduction of CeO2 islands without hydrogen, particularly raising the question what role the hydrogen plays in the reduction process as well as the formation of hydroxyl entities.22
Another aspect to consider in a CeO2–H2 system is the incorporation of hydrogen in the oxide bulk as was shown e.g. in ref. 23. This important question was discussed in the past and many authors contributed to the topic up to the present day, employing different approaches. The existence of bulk-absorbed hydrogen in CeO2 was derived from results acquired by 1H NMR,24 nuclear reaction analysis,13 deuterium–hydrogen exchange,25 infrared spectroscopy,26 inelastic neutron scattering27 and temperature-programmed reduction28 and is supported by theory as well.29,30 While the hydrogen dissolution in CeO2 has been accepted by most authors, the chemical nature of incorporated hydrogen is still under dispute. 1H NMR is a promising method for studying ceria-bonded hydrogen. In a paper by Lyons et al.1H MAS NMR was used to study hydrogen adsorption on nonporous and mesoporous ceria.31 It was shown that ceria is an extremely advantageous oxide for solid state NMR of hydrogen as exceptionally sharp magnetic 1H resonances can be obtained.31 The resolution is even high enough to discern on top and bridged OH groups.31 Also, a combination of thermogravimetry and 1H NMR suggested hydrogen occlusion in CeO2.32
The presence of dissolved hydrogen in ceria and its impact on catalysis has been discussed in the last years. H2-reduced Ni-doped CeO2 (and derived oxides) was shown to hold a catalytically active hydrogen reservoir for hydrogenation of alkenes.33,35 Works like Jolawiecki-Duhamel's aim particularly in the elucidation of the mechanism of reactions involving the catalytic transfer of incorporated hydrogen from ceria.34 The hydrogen reservoirs are speculated to consist of oxyhydrides – which has also been called bronze-like HyCeO2−x in earlier works24,26 – or, alternatively, pure hydrides CeHx as implied by inelastic neutron scattering.27,33 Formation of CeO2Hy entities have also been proposed by Matsukawa et al.36 following hydrogen treatments at very short contact times – necessarily without a high vacancy concentration.
As has been shown, extensive work concerning structural aspects, hydrogen incorporation and catalysis focused on H2-reduced CeO2 has been accumulated over the past years. However, the incorporation of hydrogen in acceptor-doped ceria materials, such as SDC15 (Sm0.15Ce0.85O2−δ) was neglected so far. To the best of our knowledge only one work tested the dissolution of hydrogen in SDC20 by secondary ion mass spectroscopy after annealing the oxides in D2O (and not under reducing conditions).37 Of particular importance is also answering the question, whether on doped ceria materials – in comparison to undoped CeO2 – crystalline cerium or mixed hydride phases are observed. No unambiguous experimental evidence has been found up to now for an oxygen-free CeHx hydride phase.27 As the stability of the hydrides potentially is a strong function of the reduction potential of the gas phase, the present work's first objective was to test the crystallographic impact of oxygen extraction from and hydrogen dissolution in pure CeO2 and Sm-doped ceria – in an H2 atmosphere and at elevated temperatures – by in situ XRD. We chose in situ XRD as the ex situ studies might not provide access to intermediate/metastable phases formed at different conditions of temperature and atmosphere. The in situ synchrotron XRD experiments allow us to follow the crystalline structure of the materials that is a basic feature for chemical and mechanical properties and is therefore of key importance for the oxide's applications.18 The second point of interest is concerned with the elucidation of the occluded hydrogen's chemical nature for which we used solid state 1H NMR.
2. Experimental
Pure and Sm-doped CeO2 micron and nano-powders with a purity of 99.9% were purchased form Alfa Aesar and Sigma-Aldrich, respectively. The Sm-containing sample has a stoichiometry of Sm0.15Ce0.85O2−δ and is subsequently labeled as SDC15. The samples were initially calcined at 1273 K in air, respectively, and afterwards the BET surface area was determined. For SDC15, BET analysis in a surface and pore analyser Nova 2000e from Quantachrome yielded a surface area of 4.7 m2 g−1 after calcination. Structural changes of the oxides that might have been caused by thermal annealing were excluded by ex situ XRD prior to the actual in situ characterization. Accordingly, the samples were not heated above the initial calcination temperature during the experiments.The in situ high-temperatures synchrotron XRD experiments in O2 or H2 were performed at beamline 12.2.2, Advanced Light Source, Lawrence Berkeley National Labs, California. The in situ diffraction patterns were collected in the angle-dispersive transmission mode with a focused 25 keV monochromatic beam (λ = 0.4957 Å/50 μm spot size). The sample powder was heated in 0.7 mm quartz capillaries under a continuous gas flow (O2 or H2) injected through another 0.5 mm capillary with a cut-open end. The capillary is heated in an infrared heated SiC tube furnace as described in elsewhere.38,39 Diffraction patterns were recorded by a PerkinElmer flat panel detector (XRD 1621, dark image and strain correction) every 25 seconds during the heating and cooling cycle. To remove any organic or volatile materials from the samples and ensure identical starting points for the subsequent determination of the oxygen nonstoichiometry, an oxidative pre-treatment in flowing O2 (0.8 mL s−1/1 bar) at 1023 K for 30 min was first employed for all samples. The samples then were reduced in the flowing H2 (1 mL s−1/1 bar) between 300–1273 K with isothermal step at 1273 K for 10 min. Finally, all reduced samples were re-oxidized again in flowing O2 (1.0 mL s−1/1 bar) between 300–1273 K with isothermal step at 1273 K for 10 min. The heating and cooling rates were 25 K min−1 for all experiments. Rietveld refinement was performed using the FULLPROF program.40 The profile function 7 (Thompson-Cox-Hastings pseudo-Voigt convoluted with axial divergence asymmetry function)41 was used in all refinements. The structure parameters of the respective starting model of fluorite CeO2, bixbyite b-Ce2O3+δ′, rh-Ce7O12 and tri-Ce11O20 for Rietveld refinement were taken from literature.18
1H Solid state NMR spectra were recorded with a Bruker Avance 400 MHz spectrometer operating at 399.88 MHz 1H. The NMR experiments were carried out at a MAS rate of 10 kHz using a 4 mm MAS HX double resonance probe. The 1H π/2 pulse length was 5.0 μs and the spectra were measured using a recycle delay of 2 s. All spectra are referenced to external tetramethylsilane (TMS) at 0 ppm using adamantane as a secondary reference.
3. Results and discussion
As shown in Fig. S1 in the ESI,† the XRD pattern of the starting SDC15 and CeO2 specimens before any gas treatment can be fitted well with the calculated pattern corresponding to the fluorite structure of pure CeO2 (Fm![[3 with combining macron]](https://www.rsc.org/images/entities/char_0033_0304.gif) m, No. 225).42 No superstructure reflections are observed in the XRD pattern of SDC15, which suggests a random substitution of Sm3+ cations in the CeO2 lattice. The substitution of larger Sm3+ for smaller Ce4+ cations in the fluorite structure [r (Sm3+) = 1.079 Å, r (Ce4+) = 0.970 Å; all cations are 8-fold coordinated]43 is further confirmed by Rietveld refinement, that reveals an increase in the lattice parameter of SDC15 (a = 5.4269 ± 0.0001 Å) in comparison with that of undoped CeO2 (a = 5.4081 ± 0.0001 Å). The amount of Sm3+ cations x incorporated into the CeO2 lattice, as well as the resulting oxygen vacancies parameter δ in the fluorite-type SmxCe1−xO2−δ structure can be estimated from the difference in the lattice parameter between the undoped and doped CeO2−δ, according the relationship:44
m, No. 225).42 No superstructure reflections are observed in the XRD pattern of SDC15, which suggests a random substitution of Sm3+ cations in the CeO2 lattice. The substitution of larger Sm3+ for smaller Ce4+ cations in the fluorite structure [r (Sm3+) = 1.079 Å, r (Ce4+) = 0.970 Å; all cations are 8-fold coordinated]43 is further confirmed by Rietveld refinement, that reveals an increase in the lattice parameter of SDC15 (a = 5.4269 ± 0.0001 Å) in comparison with that of undoped CeO2 (a = 5.4081 ± 0.0001 Å). The amount of Sm3+ cations x incorporated into the CeO2 lattice, as well as the resulting oxygen vacancies parameter δ in the fluorite-type SmxCe1−xO2−δ structure can be estimated from the difference in the lattice parameter between the undoped and doped CeO2−δ, according the relationship:44 | (1) |
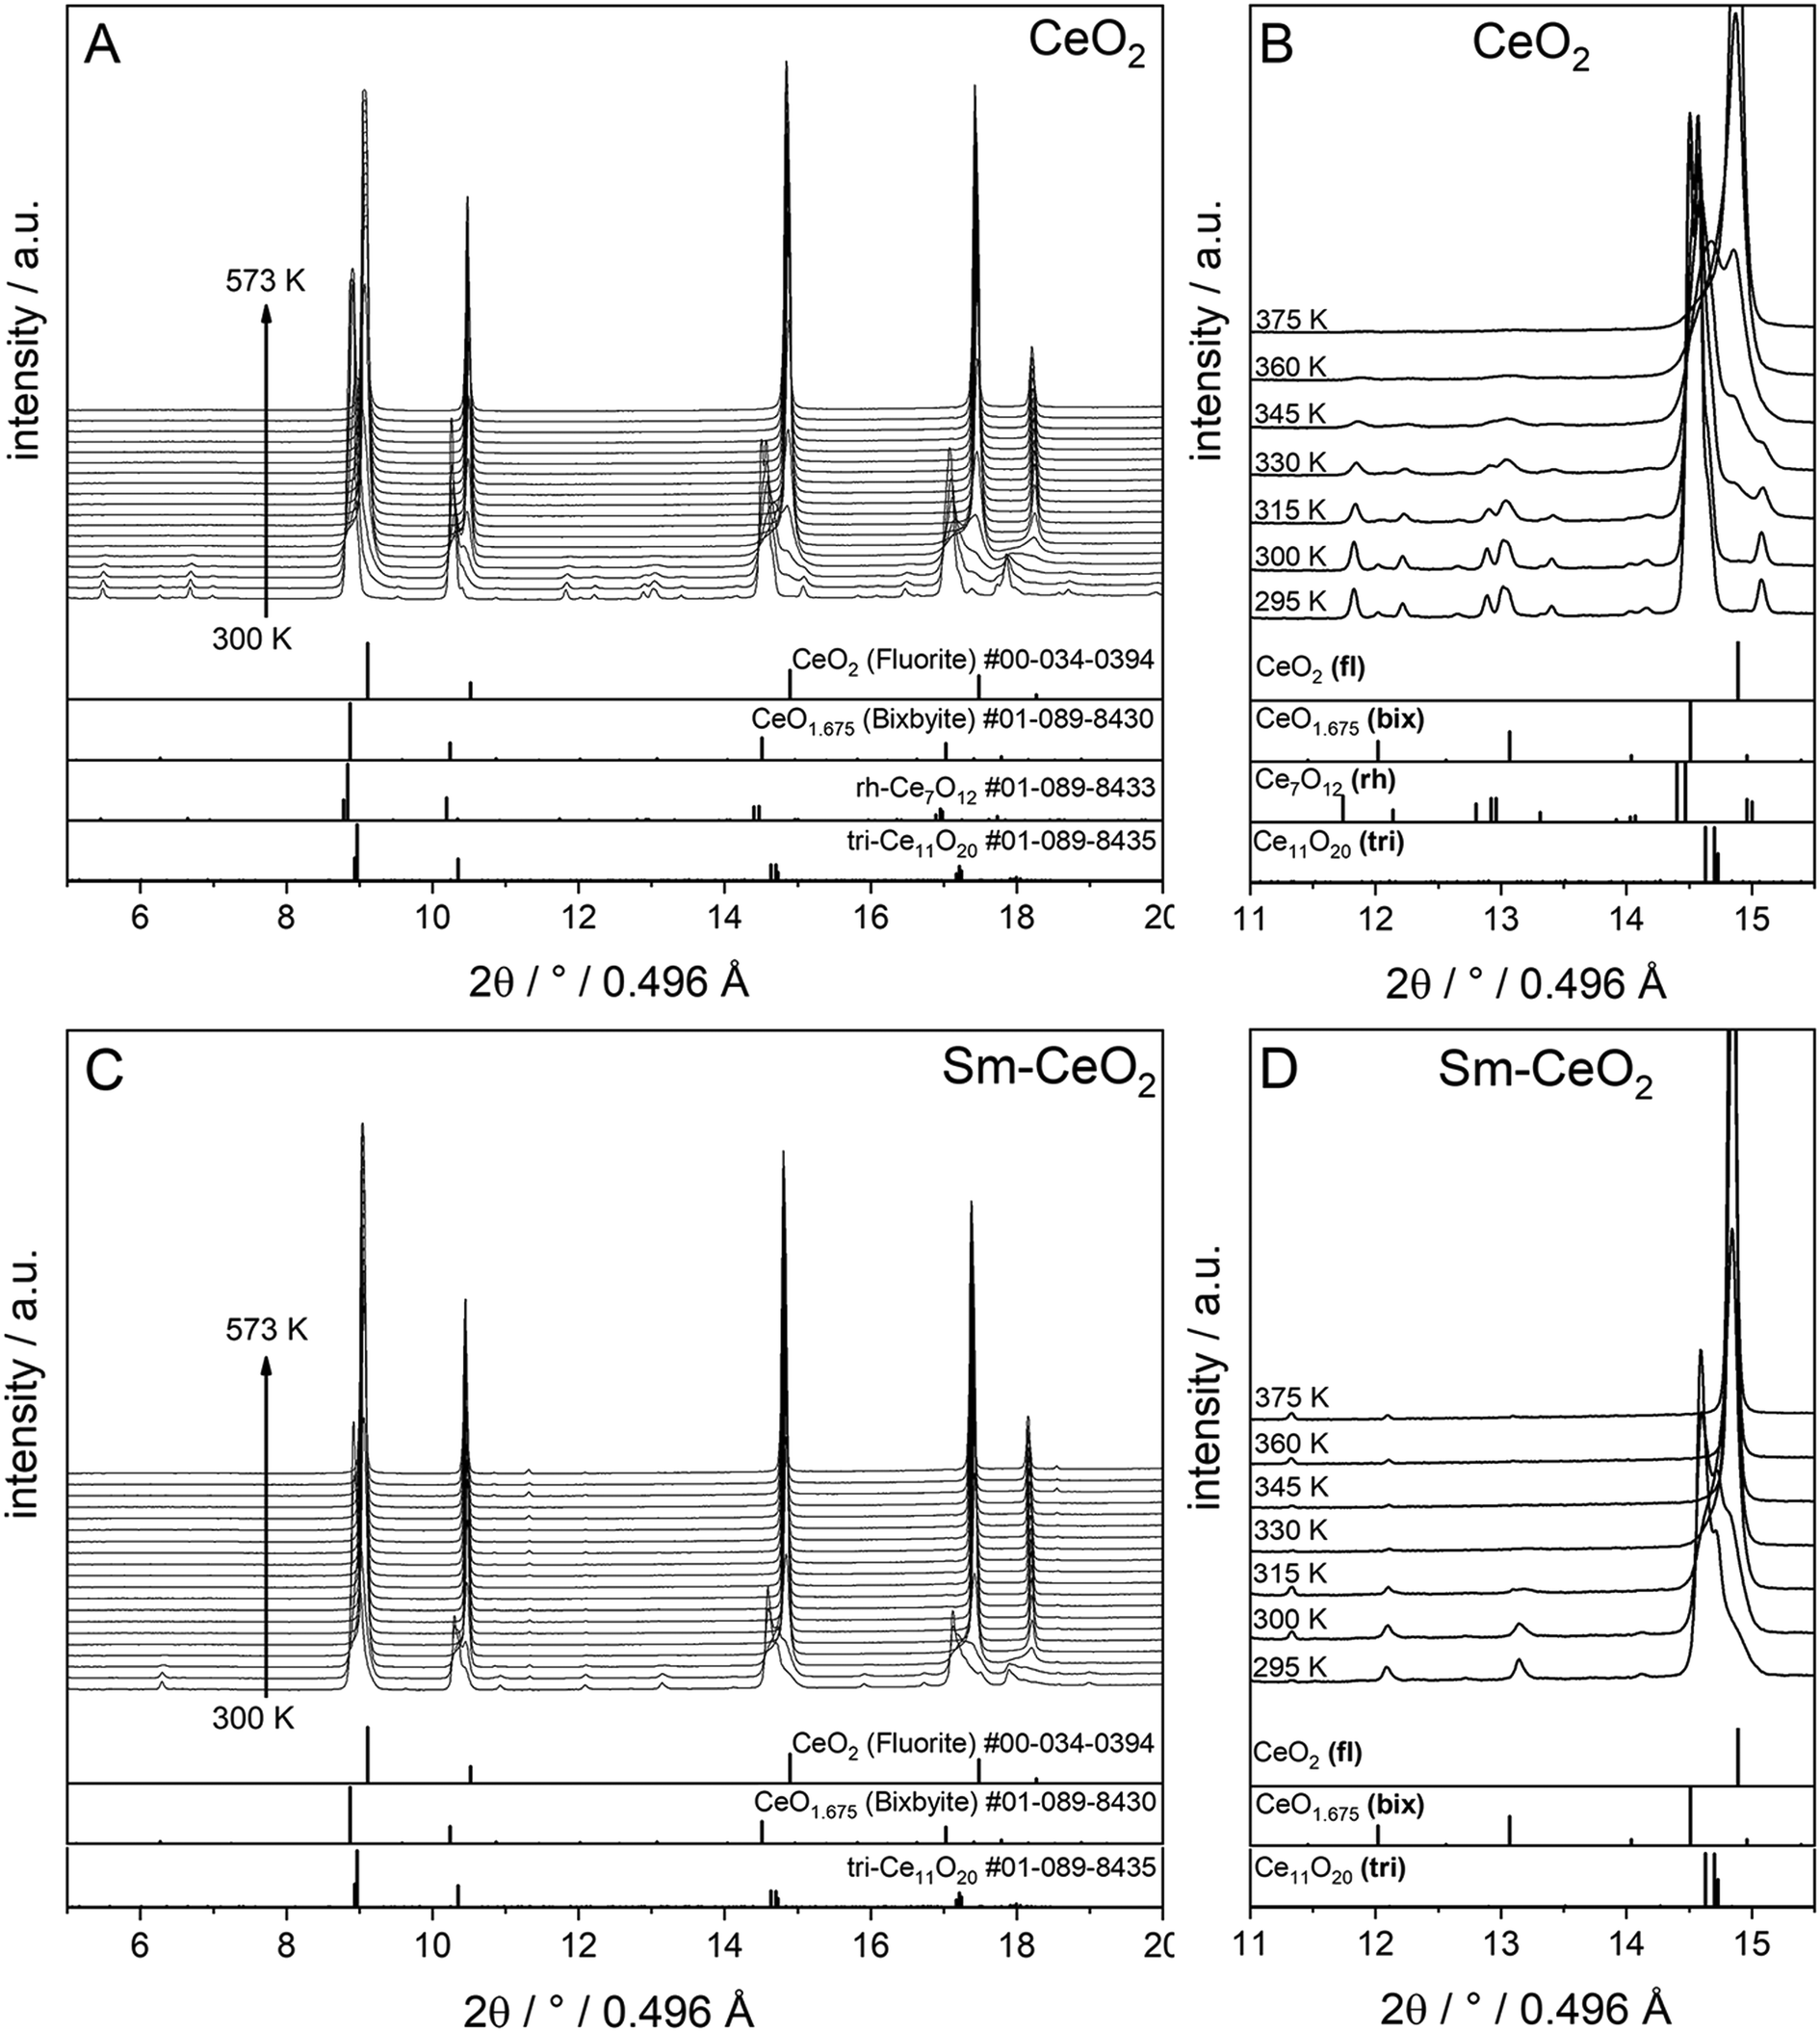
To compare the reduction behaviour of CeO2 and SDC15, temperature-programmed in situ XRD measurements were conducted in flowing hydrogen (Fig. 1). In situ XRD experiments on both specimens were performed first under O2 atmosphere to ensure that the chemical composition and crystal structure are stable before the temperature-programmed reduction step. As shown in Fig. S2 (ESI†), the fluorite structure of both specimens remains stable up to 1023 K under O2 atmosphere. In contrast, despite both samples maintain also the fluorite structure during heating up to 1273 K in H2 atmosphere, several consecutive phase changes are observed during the cooling cycle (Fig. 1). In case of pure CeO2 (Fig. 1A and B), the fluorite structure is first transformed into the bixbyite-type structure b-Ce2O3+δ′ or b-CeO2−δ (PDF-card #01-089-8430) at around 1228 K, which remains stable before transforming partially into rhombohedral rh-Ce7O12 (PDF-card #01-089-8433) at 924 K and then triclinic tri-Ce11O20 (PDF-card #01-089-8435) at 800 K. For the SDC15 specimen (Fig. 1C and D), the fluorite → bixbyite phase transformation is also observed, but at slightly higher temperature (i.e. 1263 K) compared to pure CeO2. Moreover, the bixbyite structure is transformed to only tri-Ce11O20 at 715 K, which is lower than the transition temperature of the same phase transformation observed in the pure CeO2 sample. A more detailed discussion will be provided below.
 | ||
| Fig. 1 In situ XRD patterns (λ = 0.4957 Å) collected during cooling of CeO2 (A and B) and SDC15 (C and D) specimens from 1273 K under hydrogen flow. Panel A and C show the in situ XRD patterns in a broad 2Θ range and in a temperature interval between 300 and 1273 K. Panels B and D focus on a narrower 2Θ window for closer analysis. The calculated diffraction patterns of the fluorite CeO2, bixbyite CeO1.675, rh-Ce7O12 and tri-Ce11O20 structures are shown at the bottom. The arrow in Fig. B and D indicates the reflections of triclinic tri-Ce11O20 phase. The fluorite, bixbyite, rhombohedral and triclinic phases of ceria are abbreviated as fl, bix, rh and tri, respectively, in panel B and D. The structure refinement plots of the XRD patterns in panel B and D are shown in Fig. S3 and S4 in the ESI,† respectively. | ||
The structure refinement of the samples cooled to room temperature reveals that the reduced pure CeO2 sample consists of 12.1(0.7) wt% b-CeO2−δ, 62.4(0.8) wt% rh-Ce7O12 and 25.5(0.6) wt% tri-Ce11O20, while the reduced SDC15 contains only 78.8(0.7) wt% b-CeO2−δ and 21.2(0.6) wt% tri-Ce11O20. The weight fractions of all phases formed at different temperatures during cooling of CeO2 and SDC15 samples in H2 atmosphere are shown in Fig. 2.
 | ||
| Fig. 2 Temperature evolution of weight fraction of different phases formed during cooling of CeO2 (A) and SDC15 (B) specimens from 1273 K in H2 atmosphere. The insets in figure A and B show the weight fraction during the re-oxidation of CeO2 and SDC15, respectively, in flowing O2. | ||
The lattice parameter's temperature dependence of the observed crystalline phases is very important to understand the expansion of the lattice due to thermal influences as well as chemical changes (i.e. removing oxygen from the lattice or reduction of Ce4+ into Ce3+ cations). Accordingly, the lattice parameters of the fluorite phases and the pseudo-cubic lattice parameters of the other phases formed in both CeO2 and SDC15 samples are determined by structure refinement and plotted as function of temperature in Fig. 3A and B. It can be clearly seen, that the temperature dependence of the lattice parameter of the fluorite CeO2 phase in both specimens is linear over the entire temperature range of the experiments during heating and cooling in O2 atmosphere, which can be explained by the linear thermal expansion of both materials. In contrast, the lattice parameter in both specimens heated in H2 exhibits an analogous thermal expansion mediated increase with temperature only up to 800 K, before showing a rapid additional increase with further rising temperature, which indicates the extraction of lattice oxygen from the samples. On the other hand, during cooling in H2 the pseudo-cubic lattice parameter of the bixbyite phases, which is obtained by dividing the lattice parameter of parent bixbyite by 2, shows a linear decrease with temperature down to 810 K and 715 K for pure CeO2 and SDC15, respectively, then it apparently stops to contract, followed by a second decrease below 580 K. Moreover, the pseudo-cubic lattice parameters of the formed rh-Ce7O12 and tri-Ce11O20 phases, which are calculated from the volume of the rhombohedral and triclinic cells, display a linear decrease with temperature as soon as they are formed. The pseudo-cubic lattice parameters can be simply calculated from the unit cell volume of the triclinic and rhombohedral phases. For example, rh-Ce7O12 has 3 unit formulae per unit cell, while fluorite has 4 unit formulae. This means that each unit cell of Ce7O12 has 3 × 7 = 21 Ce, while fluorite has 4 Ce, indicating that the pseudo-cubic cell of rh-Ce7O12 equals the volume of the rh-Ce7O12 cell times 4/21. Then the lattice parameter can be calculated from the cube root of the volume of the obtained pseudo-cubic cell. These results can be explained by the change in oxygen vacancy concentrations and the concomitant change of Ce3+/Ce4+ ratios (for charge compensation) in the samples during the heating/cooling in H2 atmosphere.
 | ||
| Fig. 3 Temperature evolution of the pseudo-cubic lattice parameters (A and B), the oxygen vacancy parameter δ (C and D) and mole fraction y of Ce3+ (E and F) of different phases formed during cooling of CeO2 (A, C and E) and SDC15 (B, D and F) specimens from 1273 K in H2 atmospheres. The oxygen vacancy parameter and mole fraction y of Ce3+ were calculated from the relationship between the amount of oxygen (i.e. 2–δ) in CeO2−δ and the pseudo-cubic lattice parameters a (termed “model 1”), as well as using eqn (2) (termed “model 2”). | ||
In order to confirm these results, the amount of oxygen vacancies δ and mole fraction y of Ce3+ in all phases at given temperature T are determined by using the well-known relationship between the amount of oxygen (i.e. 2–δ) in CeO2−δ and pseudo-cubic lattice parameter a experimentally derived by Ray et al. (henceforth this approach is called model 1).20 The increase in the lattice parameters of fluorite and bixbyite phases due to thermal expansion was determined by the linear fitting of experimental data for the samples heated in O2 atmosphere and extrapolation to higher temperatures. As the pseudo-cubic lattice parameter of rh-Ce7O12 and tri-Ce11O20 phases show an almost linear dependence of temperature during cooling in H2, their thermal expansions were determined from these data. The calculated lattice parameter values were subtracted from the experimental values before calculating the amount of oxygen vacancies δ and the mole fraction y of Ce3+.
As shown in Fig. 3C and D, the amount of the oxygen vacancies (derived by model 1) in the fluorite phases of both samples heated in H2 from room temperature up to 800 K does not change, which suggests that the increase in the lattice parameters in this temperature range is due to the thermal expansion effect. Above 800 K, lattice oxygen release becomes predominant resulting in the generation of more oxygen vacancies and induces the valence decrease of Ce4+ ions for charge compensation. Thus, the lattice parameter of the fluorite structures sharply increases due to the combined thermal and chemical expansion.
The increased oxygen nonstoichiometry δ (derived by model 1) after heating both samples in H2 to 1273 K (δ ≈ 0.28) resulted in the transformation of the fluorite phase into oxygen-deficient bixbyite structures. The determined formulae are Ce0.583+ Ce0.424+O1.71 (derived from pure CeO2) and Sm0.153+Ce0.393+ Ce0.464+O1.73 (derived from SDC15), which form during the cooling routine in H2 at 1228 K and 1263 K, respectively. Below these temperatures and down to 810 K and 715 K for pure CeO2 and SDC15, respectively, no more oxygen vacancies are generated in the bixbyite phases, thus, their lattice parameters decrease linearly with temperature due to the thermal contraction effect. This result is further confirmed by the partial transformation of the bixbyite phase into rhombohedral rh-Ce7O12 (i.e. Ce0.583+ Ce0.424+O1.71) at 924 K in pure CeO2, whereby both phases have the same amount of oxygen vacancies. This agrees also with a previous work18 showing that the difference in oxygen nonstoichiometry between bixbyite and rh-Ce7O12 is very small and the most essential difference between the two structures is the relative orientations of oxygen anions and oxygen vacancies along the [111]-direction. On the other hand, a rh-Ce7O12 type phase is not observed in the SDC15 specimen at any temperature, which indicates that Sm doping leads to the stabilization of the bixbyite phase over the rhombohedral one at this particular oxygen vacancy concentration. In the temperature ranges 810–580 K and 715–580 K for pure CeO2 and SDC15, respectively, the amount of oxygen vacancies and Ce3+ ions increase again in the bixbyite phases, leading to an increase in the lattice parameters that compensates the decrease due to the thermal contraction effect. Therefore, the lattice parameters of the bixbyite phases stay relatively constant in these temperature ranges. As shown in Fig. 2 and 3C–F, this increase in the amount of oxygen vacancies and Ce3+ ions in the bixbyite phases is accompanied by the formation of the tri-Ce11O20 phase (i.e. Ce0.483+Ce0.524+O1.76 and Sm0.153+Ce0.313+Ce0.544+O1.77) at 800 and 715 K for pure CeO2 and SDC15, respectively. The bixbyite phases in the pure ceria and SDC15 samples (at RT after H2 treatment) exhibit the chemical compositions of Ce0.663+Ce0.344+O1.67 and Sm0.153+Ce0.473+Ce0.384+O1.69, respectively. In comparison to the bixbyite phases formed at higher temperatures (i.e. T > 800 K) the RT bixbyite phases of both samples have a slightly higher oxygen vacancy concentration. These results suggest the formation of tri-Ce11O20 from the high-temperature bixbyite phase or rh-Ce7O12 according to the following chemical reactions:
| b-/rh-Ce0.583+Ce0.424+O1.71 → tri-Ce0.483+Ce0.524+O1.76 + b-Ce0.663+Ce0.344+O1.67 |
| b-Sm0.153+Ce0.393+Ce0.464+O1.73 → tri-Sm0.153+Ce0.313+Ce0.544+O1.77 + b-Sm0.153+Ce0.473+Ce0.384+O1.69 |
Additionally, despite of the fact that the fluorite structure of Sm0.15Ce0.85O1.926 has a larger lattice parameter than that of CeO2, the tri-Sm0.153+Ce0.313+Ce0.544+O1.77 phase possesses a smaller lattice parameter than tri-Ce0.483+Ce0.524+O1.76, which agrees with the order of the ion sizes, Ce3+ > Sm3+ > Ce4+. Below 580 K, no significant changes in the oxygen vacancies are observed in all phases, therefore, their lattice parameters decrease linearly with temperature due to the thermal contraction effect. In consequence, the weight fractions of different phases do not change significantly also in both samples below this temperature (cf.Fig. 2). Furthermore, it is noteworthy that the oxygen contents determined in bixbyite and rh-Ce7O12 phases observed in both samples are in good agreement with previous reports on pure CeO2.18,20,45 In contrast, the amounts of oxygen in the tri-Ce11O20 phases (i.e. 1.76–1.77) are found to be slightly lower than those reported in the literature (i.e. 1.80–1.832).18,20,45 Previous single-crystal neutron scattering measurements showed that CeO1.765 is preferentially crystallized in the rhombohedral structure.46 However, all attempts to refine the diffraction pattern of this phase in the rhombohedral structure were unsuccessful, and only using the triclinic structure gave better fitting between the observed and calculated profiles. Interestingly, the oxygen contents determined in the bixbyite and triclinic phases formed in the pure CeO2 sample are found to be very close to those of same phases formed in the SDC15 sample, which indicates that the stabilization of bixbyite and triclinic phases depends on the amount of oxygen vacancies, regardless of Sm doping.
In the next step, the obtained mole fraction y of Ce3+ and the oxygen vacancies parameter δ in the reduced fluorite phases at a given temperature T are calculated by using the relationship23 (which we refer to as model 2):
 | (2) |
Finally, the stabilities of the bixbyite, rh-Ce7O12 and tri-Ce11O20 phases in the recovered samples at RT after H2 pre-reduction were studied by re-heating of the recovered samples in a O2 atmosphere. As shown in Fig. 4, the bixbyite and tri-Ce11O20 phases in both samples are transformed to a fluorite phase at very low temperature (i.e. T < 330 K), while the rh-Ce7O12 phase in the pure CeO2 sample disappears at slightly higher temperature (i.e. 377 K). These results indicate that these oxygen deficient phases are metastable and can be easily oxidized to the stoichiometric fluorite phase at low temperature.
 | ||
| Fig. 4 In situ XRD patterns (λ = 0.4957 Å) collected during re-oxidation of CeO2 (A and B) and SDC15 (C and D) specimens in flowing O2 atmospheres directly after H2 pre-reduction. Panels A and C show in situ XRD patterns in a broad 2Θ range and in a temperature interval between 300 K and 573 K. Panels B and D focus on the some temperature regions to allow for closer analysis in a narrower 2Θ window. The calculated diffraction patterns of the fluorite CeO2, bixbyite CeO1.675, rh-Ce7O12 and tri-Ce11O20 structures are shown at the bottom. The fluorite, bixbyite, rhombohedral and triclinic phases of ceria are abbreviated as fl, bix, rh and tri, respectively, in panel B and D. The structure refinement plots of the XRD patterns in panel B and D are shown in the ESI† as Fig. S5 and S6, respectively. | ||
The sequence of phase transitions in ceria induced by thermal treatment and oxygen non-stoichiometry can be explained as follows. The thermal diffusion and incorporation of hydrogen into CeO2 lattice under hydrogen atmosphere above 900 K results in the formation of oxygen vacancies due to the release of water molecules, which in turn leads to the oxygen deficient fluorite polymorph with a fully disordered network of oxygen vacancies. In contrast, the bixbyite and rhombohedral phases show an ordering of oxygen vacancies.18,47 As the latter is strongly influenced by temperature and stress, during the cooling the disordered oxygen vacancies in the fluorite phase start to be ordered leading to the transformation of disordered fluorite phase into the ordered bixbyite phase and rhombohedral rh-Ce7O12, whereby all three phases have almost the same amount of oxygen vacancies (Fig. 3) and differ only in their ordering. As the diffusion and incorporation of hydrogen into bixbyite lattice is hindered below 800 K, the reduced b-Ce0.583+Ce0.424+O1.71 particles becomes unstable. As a result, the b-Ce0.583+Ce0.424+O1.71 is oxidized into tri-Ce11O20 (i.e. tri-Ce0.483+Ce0.524+O1.76) in the bulk of the particle by accepting oxygen from the outer surface region and forming new bixbyite phase with more oxygen vacancies (i.e. b-Ce0.663+Ce0.344+O1.67). Our finding is in line with a recently proposed mechanism for the transformation of oxygen-deficient fluorite CeO2−x into tri-Ce11O20 and stochiometric CeO2 below 773 K during cooling after heating the sample for 20 hours in hydrogen (3% H2 in N2) atmosphere.48
Revisiting the in situ XRD experiments in brief, and to refocus on the initial research question whether CeHx cerium hydride phases can be detected during the hydrogen treatments as reported previously,27 an intermittent summarizing statement will reveal that under our specific experimental circumstances neither for pure nor for acceptor-doped CeO2 any sign of such a crystalline cerium hydride phase was detected. All patterns can satisfactorily be explained by the aforementioned structures in the Ce–O phase diagram, which strongly contradicts a recent study suggesting the presence of an “oxygen-free” CeHx phase by evaluation of inelastic neutron scattering data.27 Our previous results,23 among other studies, nevertheless clearly prove the presence of dissolved hydrogen e.g. in the defective CeO2−x structure (starting from pure CeO2 as well as Gd- and Sm-doped phases), but the presence of dissolved hydrogen did, at least in our case, not induce hitherto entirely unknown or crystallographically unclear phase changes. The same holds for recently reported hydrogen-containing, but allegedly vacancy-free, HxCeO2 ceria oxyhydroxide phases,36 which were also not detected during our in situ experiments.
In order to shed light on the eventual bonding of hydrogen within the reduced CeO2−x structures, we additionally performed ex situ1H-NMR experiments on hydrogen-treated pure and Sm-doped CeO2 after treating the samples at 1173 K in 1 bar of flowing/dry H2. Solid state 1H-NMR spectroscopy is a well-established tool for the detection of various hydrogen species bound by ceria.24,31,32,49Fig. 5 shows these spectra in a comparative fashion before and after the hydrogen treatments.
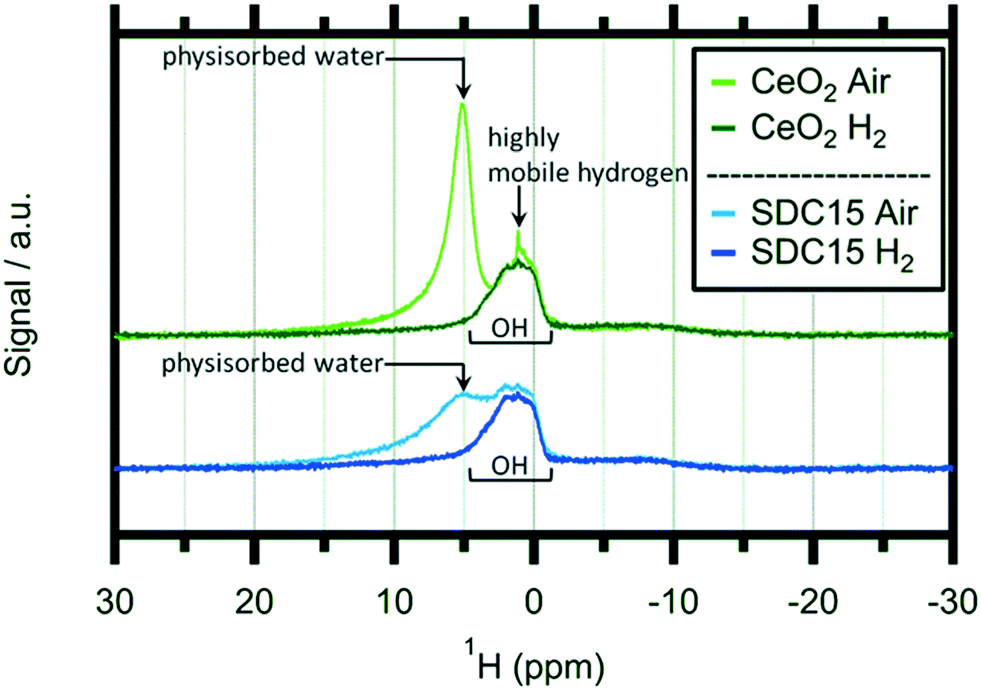 | ||
| Fig. 5 1H-MAS NMR spectra of pure CeO2 (greenish traces) and Sm-doped CeO2 (SDC15) (bluish traces) collected after treatment in air at 1273 K and after a reductive heating–cooling cycle up to 1173 K in 1 bar hydrogen. Important signals have been marked. | ||
At first glance, the features of, and the differences between the spectra of the oxidized and H2-reduced samples appear very similar. For both samples, the oxidized state is characterized by a distinct double peak with, however, variable intensity at higher chemical shifts (around 5 ppm). This peak is subsequently lost during the reduction treatment of both materials and only a pronounced and rather broad proton resonance at ∼2 ppm remains. A similar behaviour was observed for pure CeO2 by Al-Madfaa et al. who reduced CeO2 by H2 and then adsorbed H2O, so generating OH groups which could be detected by 1H MAS NMR.50
Adapting an interpretation of similar spectra collected on commercial and nanoarchitectured ceria materials,47 the vanishing peak can be associated with physisorbed water layers. In contrast, the persisting peak can be associated with very stable OH groups adsorbed on specific crystallite sites. Interestingly, this peak exhibits almost exactly the same appearance for both the pure and the undoped ceria sample. Hence, we can conclude that this specific adsorption is not influenced by acceptor doping. Most importantly, no distinct magnetic 1H resonances of any cerium hydride species – which are expected to show up at lower fields compared to OH (ref. 51) – are detectable.
As the 2 ppm signal of pure CeO2 (air-calcined sample) is investigated, a sharp spike can be found at 1.12 ppm which disappears if the sample is heated in H2 at elevated temperatures. This particular feature can be assigned to highly mobile hydrogen52,53 and is completely missing on air-calcined SDC15. In general the OH signal decreases slightly as hydroxyl groups are removed from the sample by reacting with H2. In summary, the NMR experiments do not bear surprising results in terms of new OH species, but equally, no hidden hydride species are observed either – at least not under the chosen experimental conditions.
4. Conclusions
Through exploitation of in situ X-ray diffraction experiments under strongly reducing conditions we have shown that the formation of cerium hydride phases under the chosen experimental conditions can be excluded. Rather, a succession of different phase transformations in the Ce–O phase diagram has been observed, with a strong dependence on the M3+ doping level of CeO2. The chosen doping level of Sm–CeO2 leads to particular stabilization of a reduced bixbyite b-CeO2−δ phase, which inhibits the intermediate formation of rhombohedral Ce7O12 as observed on pure CeO2. The final structural stage of both ceria materials is a reduced triclinic Ce11O20 phase. On the basis of our experiments, and also under observance of the fact that previous quantitative ex situ experiments have given clear evidence that dissolved hydrogen exists within the reduced ceria structures after the chosen hydrogen treatments, this hydrogen was not detectable in the form of a CeHx cerium hydride compound. As such we conclude that crystalline hydride phases of cerium can hardly play a catalytic role in e.g. hydrogenation reactions or are substantially formed in other H2-containing gas environments.Conflicts of interest
There are no conflicts to declare.Acknowledgements
M. Grünbacher and S. Penner acknowledge funding from the Austrian Science Fund (FWF) within the SFB project F4503-N16 “Functional Oxide Surfaces and Interfaces”. The work was performed within the framework of the research platform “Materials- and Nanoscience” and the special PhD program “Reactivity and Catalysis” at the University of Innsbruck. L. Schlicker appreciates the ALS for supporting his work with a doctoral fellowship. The authors further thank the Advanced Light Source (which is supported by the Director, Office of Science, Office of Basic Energy Sciences, of the U.S. Department of Energy under Contract No. DE-AC02-05CH11231), where in situ XRD measurements were conducted at beamline 12.2.2 in the framework of the AP program ALS-08865.References
- A. Trovarelli, Chem. Rev., 1996, 38, 439–520 CAS.
- A. F. Diwell, R. R. Rajaram, H. A. Shaw and T. J. Treux, The role of ceria in three-way catalysts, in Catalysis Automotive Pollution Control, Elsevier, Amsterdam, 71st edn, 1991 Search PubMed.
- P. Bera, K. C. Patil and M. S. Hegde, Phys. Chem. Chem. Phys., 2000, 2, 3715–3719 RSC.
- H. C. Yao and Y. F. Yu Yao, J. Catal., 1984, 86, 254–265 CrossRef CAS.
- L. Kundakovic and M. Flytzani-Stephanopoulos, J. Catal., 1998, 179, 203–221 CrossRef CAS.
- A. I. Boronin, E. M. Slavinskaya, I. G. Danilova, R. V. Gulyaev, Y. I. Amosov, P. A. Kuznetsov, I. A. Polukhina, S. V. Koscheev, V. I. Zaikovskii and A. S. Noskov, Catal. Today, 2009, 144, 201–211 CrossRef CAS.
- Z. Wu, H. Zhu, Z. Qin, H. Wang, J. Ding, L. Huang and J. Wang, Fuel, 2013, 104, 41–45 CrossRef CAS.
- N. Bion, F. Epron, M. Moreno, F. Marino and D. Duprez, Top. Catal., 2008, 51, 76–88 CrossRef CAS.
- R. J. Gorte and S. Zhao, Catal. Today, 2005, 104, 18–24 CrossRef CAS.
- D. R. Mullins, S. D. Senanayake and T.-L. Chen, J. Phys. Chem. C, 2010, 114, 17112–17119 CrossRef CAS.
- M. I. Zaki and N. Sheppard, J. Catal., 1983, 80, 114–122 CrossRef CAS.
- S. Imamura, D. Uchihori, K. Utani and T. Ito, Catal. Lett., 1994, 24, 377–384 CrossRef CAS.
- K. Werner, X. Weng, F. Calaza, M. Sterrer, T. Kropp, J. Paier, J. Sauer, M. Wilde, K. Fukutani, S. Shaikhutdinov and H.-J. Freund, J. Am. Chem. Soc., 2017, 139, 17608–17616 CrossRef CAS PubMed.
- J. W. Fergus, J. Power Sources, 2006, 162, 30–40 CrossRef CAS.
- S. Yong, W. Shijie and S. Pei-Chen, Sci. Rep., 2016, 6, 1–9 CrossRef.
- E. Rebollo, C. Mortalo, S. Escolastico, S. Boldrini, S. Barison, J. M. Serra and M. Fabrizio, Energy Environ. Sci., 2015, 8, 3675–3686 RSC.
- B. F. Hoskins and R. L. Martin, Aust. J. Chem., 1995, 48, 709–739 CrossRef CAS.
- E. A. Kümmerle and G. Heger, J. Solid State Chem., 1999, 147, 485–500 CrossRef.
- S. P. Ray and D. E. Cox, J. Solid State Chem., 1975, 15, 333–343 CrossRef CAS.
- S. P. Ray, A. S. Nowick and D. E. Cox, J. Solid State Chem., 1975, 15, 344–351 CrossRef CAS.
- V. Perrichon, A. Laachir, G. Bergeret, R. Frety and L. Tournayan, J. Chem. Soc., Faraday Trans., 1994, 90, 773–781 RSC.
- J. Höcker, J.-O. Krisponeit, T. Schmidt, J. Falta and J. I. Flege, Nanoscale, 2017, 9, 9352–9358 RSC.
- M. Grünbacher, L. Schlicker, M. F. Bekheet, A. Gurlo, B. Klötzer and S. Penner, Phys. Chem. Chem. Phys., 2018, 20, 22099–22113 RSC.
- J. L. G. Fierro, J. Soria, J. Sanz and J. M. Rojo, J. Solid State Chem., 1987, 66, 154–162 CrossRef CAS.
- S. M. Schimming, G. S. Foo, O. D. La Mont, A. K. Rogers, M. M. Yung, A. D. D'Amico and C. Sievers, J. Catal., 2015, 329, 335–347 CrossRef CAS.
- A. Laachir, V. Perrichon, A. Badri, J. Lamotte, E. Catherine, J.-C. Lavalley, J. El Fallah, L. Hilaire, F. Le Normand, E. Quemere, G. N. Sauvion and O. Touret, J. Chem. Soc., Faraday Trans., 1991, 87, 1601–1609 RSC.
- Z. Wu, Y. Cheng, F. Tao, L. Daemen, G. S. Foo, L. Nguyen, X. Zhang, A. Beste and A. J. Ramirez-Cuesta, J. Am. Chem. Soc., 2017, 139, 9721–9727 CrossRef CAS PubMed.
- L. A. Bruce, M. Hoang, A. E. Hughes and T. W. Turney, Appl. Catal., A, 1996, 134, 351–362 CrossRef CAS.
- K. Sohlberg, S. T. Pantelides and S. J. Pennycook, J. Am. Chem. Soc., 2001, 123, 6609–6611 CrossRef CAS PubMed.
- X.-P. Wu, X.-Q. Gong and G. Lu, Phys. Chem. Chem. Phys., 2015, 17, 3544–3549 RSC.
- D. M. Lyons, J. P. McGrath and M. A. Morris, J. Phys. Chem. B, 2003, 107, 4607–4617 CrossRef CAS.
- J. M. Rojo, J. Sanz, J. A. Soria and J. L. G. Fiero, Z. Phys. Chem., 1987, 152, 149–158 CrossRef CAS.
- L. Jalowiecki-Duhamel, S. Debeusscher, H. Zarrou, A. D'Huysser, H. Jobic and E. Payen, Catal. Today, 2008, 138, 266–271 CrossRef CAS.
- L. Jalowiecki-Duhamel, Int. J. Hydrogen Energy, 2006, 31, 191–195 CrossRef CAS.
- L. Jalowiecki-Duhamel, J. Carpentier and A. Ponchel, Int. J. Hydrogen Energy, 2007, 32, 2439–2444 CrossRef CAS.
- T. Matsukawa, A. Hoshikawa, E. Niwa, M. Yashima and T. Ishigaki, CrystEngComm, 2018, 20, 155–158 RSC.
- N. Sakai, K. Yamaji, T. Horita, H. Yokokawa, Y. Hirata, S. Sameshima, Y. Nigara and J. Mizusaki, Solid State Ionics, 1999, 125, 325–331 CrossRef CAS.
- A. Doran, L. Schlicker, C. M. Beavers, S. Bhat, M. F. Bekheet and A. Gurlo, Rev. Sci. Instrum., 2017, 88, 13903 CrossRef CAS PubMed.
- L. Schlicker, A. Doran, P. Schneppmüller, A. Gili, M. Czasny, S. Penner and A. Gurlo, Rev. Sci. Instrum., 2018, 89, 33904 CrossRef PubMed.
- J. Rodriguez-Carvajal, IUCrJ, 2001, 26, 12–19 Search PubMed.
- L. W. Finger, D. E. Cox and A. P. Jephcoat, J. Appl. Crystallogr., 1994, 27, 892–900 CrossRef CAS.
- G. Brauer and H. Gradinger, Z. Anorg. Allg. Chem., 1954, 277, 89–95 CrossRef CAS.
- R. D. Shannon and C. T. Prewitt, Acta Crystallogr., Sect. B: Struct. Crystallogr. Cryst. Chem., 1969, 25, 925–946 CrossRef CAS.
- S. J. Hong and A. V. Virkar, J. Am. Ceram. Soc., 1995, 78, 433–439 CrossRef CAS.
- P. Knappe and L. Eyring, J. Solid State Chem., 1985, 58, 312–324 CrossRef CAS.
- E. A. Kümmerle, F. Güthoff, W. Schweika and G. Heger, J. Solid State Chem., 2000, 153, 218–300 CrossRef.
- R. J. Gaboriaud, F. Paumier and B. Lacroix, Thin Solid Films, 2016, 601, 84–88 CrossRef CAS.
- T. Matsukawa, A. Hoshikawa and T. Ishigaki, CrystEngComm, 2018, 20, 4359–4363 RSC.
- L. Gill, A. Beste, B. Chen, M. Li, A. K. P. Mann, S. H. Overbury and E. W. Hagaman, J. Phys. Chem. C, 2017, 13, 7450–7465 CrossRef.
- H. A. Al-Madfaa, M. M. Khader and M. A. Morris, Mater. Chem. Phys., 2004, 86, 180–188 CrossRef CAS.
- K. Hayashi, P. V. Sushko, Y. Hashimoto, A. L. Shluger and H. Hosono, Nat. Commun., 2014, 5, 3515 CrossRef PubMed.
- M. S. Conradi, M. P. Mendenhall, T. M. Ivancic, E. A. Carl, C. D. Browning, P. H. L. Notten, W. P. Kalisvaart, P. C. M. M. Magusin, R. C. Bowman, S.-J. Hwang and N. L. Adolphi, J. Alloys Compd., 2007, 446-447, 499–503 CrossRef CAS.
- V. S. Kasperovich, M. G. Shelyapina, B. Khar'kov, I. Rykov, V. Osipov, E. Kurenkova, N. E. Skryabina, D. Fruchart, S. Miraglia and P. de Rango, J. Alloys Compd., 2011, 509S, S804–S808 CrossRef.
Footnote |
| † Electronic supplementary information (ESI) available. See DOI: 10.1039/c8ce01726c |
| This journal is © The Royal Society of Chemistry 2019 |