
 Open Access Article
 This Open Access Article is licensed under a
 Creative Commons Attribution 3.0 Unported Licence
Crystallisation of sodium dodecyl sulfate–water micellar solutions with structurally similar additives: counterion variation†
Ruhina M.
Miller
 a,
João T.
Cabral
b,
Eric S. J.
Robles
c,
Nicholas J.
Brooks
a and
Oscar
Ces
*a
a,
João T.
Cabral
b,
Eric S. J.
Robles
c,
Nicholas J.
Brooks
a and
Oscar
Ces
*a
aDepartment of Chemistry and Institute of Chemical Biology-CDT, UK. E-mail: o.ces@imperial.ac.uk
bDepartment of Chemical Engineering, Imperial College London, London SW7 2AZ, UK
cThe Procter & Gamble Company, Newcastle Innovation Centre, Newcastle-Upon-Tyne NE12 9TS, UK
First published on 15th October 2018
Abstract
The effects of a series of structurally similar sodium dodecyl sulfate (SDS) additives on the crystallisation of SDS–water micellar solutions were investigated using a combination of differential scanning calorimetry, dynamic light scattering, optical microscopy and inductively coupled plasma optical emission spectroscopy. Seven different counterions were chosen from groups 1 and 2 of the periodic table to replace the sodium on SDS: LDS, (SDS), KDS, RbDS, CsDS, Mg(DS)2, Ca(DS)2 and Sr(DS)2. Two representative temperature profiles were employed – linear cooling ramps at rate of 0.5 °C min−1 to determine near-equilibrium kinetics and transitions and isothermal holds at 6 °C to elucidate morphological changes. Crystallisation of the reference solution 20% SDS–H2O with 0.25, 1.0 and 2.5% additive was generally promoted or inhibited even at the lowest concentrations. Melting points however remained largely unchanged, suggesting that the additives predominantly had a kinetic rather than thermodynamic effect. ICP-OES measurements for the solutions containing 1% additive indicated that most of the additives were integrated into the SDS crystals which was reflected by morphological changes, including the formation of hexagonal and oval shaped crystals. Our results both quantify and provide a morphological insight into the effect of a series of additives on the crystallisation of micellar SDS solutions, which can readily form due to preferential Na exchange.
Introduction
Surfactants are frequently used in formulations for household and personal care products, pharmaceuticals, paints and textiles.1–3 These are often derived from oleochemical and petrochemical sources for instance lard, palm and crude oils.2–4 Surfactants produced from these sources tend to have variability in their structures for example a mixture of chain lengths,3 and may contain impurities from the manufacturing process such as by-products from synthesis5 or hydrolysis reactions. Impurities can have potent effects on a surfactant's properties including changing its Krafft point,6 surface tension,7 and critical micelle concentration (cmc) values.8 These are also problematic for crystallisation processes as they can impact transition temperatures, the metastable zone width (MSZW) and crystal habit,9–14 potentially reducing a solution's stability window or altering its flow and filtration properties.Impurities or additives are also used to alter crystallisation kinetics or the crystal morphology;15–17 often tailor-made or structurally-similar additives are utilised for this due to their ease of incorporation at crystal faces.10 Additives can work via a number of routes – inhibiting, promoting or having no effect on crystallisation.9,18 If an additive preferentially adsorbs onto a specific face it can inhibit its growth rate;18–20 alternatively it might affect nucleation by lowering the supersaturation of the system10 or by acting as a seed crystal,18,20 thus increasing or decreasing crystallisation induction times (tind) respectively. Additionally, additives may inhibit the rate of interconversion of one crystal form to another.16
Sodium dodecyl sulfate (SDS) also referred to as sodium lauryl sulfate (SLS) is an anionic surfactant utilised in a range of industrial and academic applications including detergents,1,21,22 stabilisation of emulsions23 and microfluidic droplets.24 The structure of SDS, the dodecyl sulfate moiety and the partial phase diagram of SDS6,25 are provided in Fig. 1(a)–(c) respectively. The crystallisation of SDS has been studied using a variety of techniques including optical microscopy (OM),26,27 differential scanning calorimetry (DSC)25,27 and X-ray diffraction (XRD)26,28–33 to elucidate structures and crystallisation kinetics. Although the other dodecyl sulfate crystals have received less attention, single crystal structures34,35 and Fourier transform infrared spectroscopy (FTIR) data36 are available for RbDS and Mg(DS)2, in addition to transition temperatures for KDS and RbDS micellar solutions.37 For additive studies in particular, SDS has been used as an additive to promote interconversion reactions38 and tune crystal morphologies,39–43 however the effects of additives (for example 1-dodecanol) on its crystallisation have only recently received attention.44 Possible impurities in the SDS system include 1-dodecanol if the product hydrolyses45,46 or other dodecyl salts from counterion exchange of the sodium, for example Ca(DS)2 in hard-water supplies.
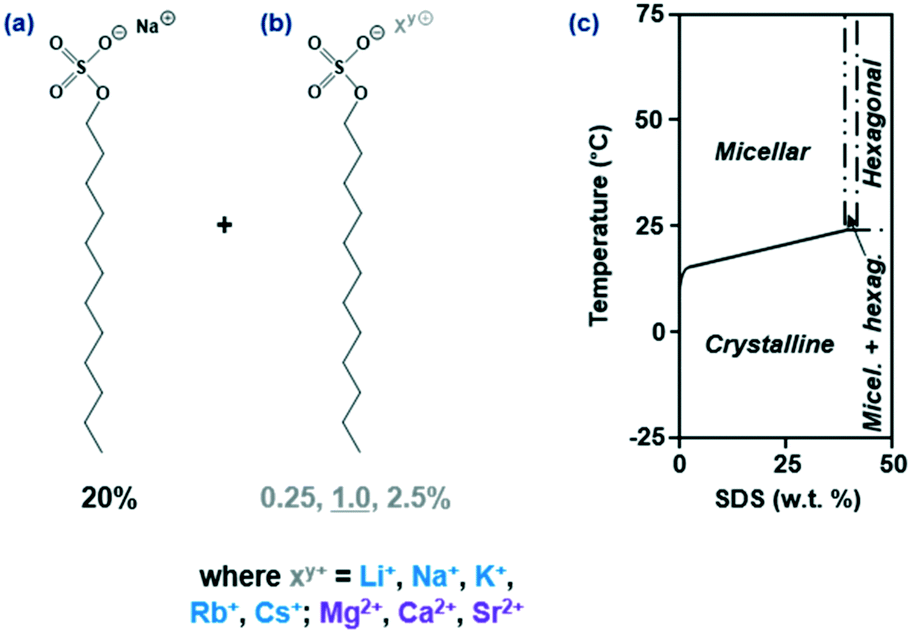 | ||
| Fig. 1 (a) Chemical structure of a SDS molecule; 20% was the baseline quantity used for all solutions. (b) 0.25–2.5% of an additive structurally comparable to SDS on which only the counterion “Xy+” was varied. (c) Partial phase diagram of SDS–H2O (adapted from ref. 6 and 25); the aim of the study was to determine whether crystallisation and the phase boundary were affected by the presence of additives. | ||
We investigate the role of 0.25, 1.0 (primary focus) and 2.5% structurally similar SDS additives on the crystallisation kinetics of 20% SDS–H2O solutions under isothermal and linear cooling conditions. A wide range of additives was covered based on the substitution of the sodium ion – four counterions (Li+, (Na+), K+, Rb+, Cs+) for the monovalent group 1 and three (Mg2+, Ca2+, Sr2+) for the divalent group 2, as shown in Fig. 1. DSC at a fixed rate (ϕ) = 0.5 °C min−1 determined whether the additives promoted or inhibited crystallisation and affected the melting point, whilst dynamic light scattering (DLS) at stepwise temperatures ascertained whether any additional solubility boundaries were present. Lastly OM data at T = 6 °C provided morphological and kinetic comparisons, with inductively coupled plasma optical emission spectroscopy (ICP-OES) establishing whether the additive was integrated into the crystal. Results were compared to the reference solution where applicable, which we previously conducted isothermal27 and linear cooling47 studies on.
Experimental
Materials and methods
SDS (ACS reagent grade, ≥99.0% purity, Sigma-Aldrich) was recrystallised from ethanol and dried under vacuum at 40 °C for 48 h.25 LDS (supplier: VWR, manufacturer: Alfa Aesar, ≥99.0% purity) was used as received. The remaining metal dodecyl sulfate salts (“MDS” = KDS, RbDS, CsDS, Mg(DS)2, Ca(DS)2, Sr(DS)2) were synthesised from the corresponding metal chlorides (“MCl”)48,49 by adding a saturated solution of MCl (15 ml) to a 10% solution of SDS–H2O (5 ml); product details in the ESI† (Table S1). The solution was stirred for 15 min, filtered under vacuum, washed with MCl (5 ml) and H2O (5 ml) to yield a white powder, then dried under vacuum overnight. The powder was subsequently recrystallised from water and dried under vacuum for 48 h. The product was characterised by inductively coupled plasma optical emission spectroscopy (ICP-OES) to determine the sodium to metal content and 1H NMR spectroscopy to confirm the precipitate had a dodecyl sulfate unit.Samples were prepared by weight percentage (wt%), with 20 wt% SDS selected as the basis of these studies. To this 0.25, 1.0 or 2.5 wt% of MDS or “additive” was added to give a total SDS + MDS concentration of 20.25, 21.0 or 22.5%, with deionised H2O accounting for the remaining 79.75–77.5 wt%. An additional sample free of additives, namely 20% SDS–H2O was also prepared as a reference. The samples were stirred until full dissolution then equilibrated for ≥24 h at 22 °C; the solutions containing 2.5% Ca(DS)2 and 0.25–2.5% Sr(DS)2 required heating before use as the additive did not fully dissolve. Solutions were used for no longer than one week as SDS undergoes hydrolysis or no longer than one day for those requiring heating as this process is accelerated.45,46 Henceforth the solutions will generally be referred to by their additive only, for example 1% KDS or 1% solution(s).
Differential scanning calorimetry (DSC)
Thermal analysis was carried out on all sample compositions: 0.25–2.5% MDS using a heat flux DSC (TA Instruments Q2000, ±0.1 °C accuracy), calibrated with indium. Samples were filtered through 0.2 μm PTFE syringe filters with ≈10 mg sealed into hermetic aluminium pans (Tzero, codes: 901683.901 & 901684.901) prior to each run. Samples were equilibrated for 10 min at 23 °C (≤25 °C for Ca(DS)2 and ≤35 °C for Sr(DS)2) then cooled at ϕ = 0.5 °C min−1 to −5 °C. The 20% SDS–H2O reference and the samples containing 1% MDS were subsequently reheated at ϕ = 0.5 °C min−1 to determine the melting point. A minimum of two repetitions were conducted per composition with fresh samples used for each run; additionally the sample weights were recorded before and after each run to confirm that no mass was lost. Data was extracted using TA Instruments Universal Analysis 2000 software.Optical microscopy (OM)
OM was conducted on the 1% MDS solutions. Solutions were filtered through 0.2 μm PTFE syringe filters and were transferred into rectangular, flat capillary tubes (CM Scientific, cross-section 50 × 500 μm2). These were sealed with an epoxy-based adhesive (Araldite Rapid) and were left overnight to dry. This procedure was slightly modified for 1% Sr(DS)2 as it precipitated at room temperature (≈20 °C) – the sample was heated to 40 °C, sealed with Parafilm M, adhesive and equilibrated at T = 35 °C for 20 min. For every experiment new capillaries were used to minimise the number of seed crystals and to reduce concentration variations due to repeated temperature cycling; the use of capillaries also allowed for rapid temperature equilibration. Three to four replicates were carried out per additive.A reflection microscope (Olympus BX41M-LED, 10× objective) and temperature-controlled stage (Linkam Scientific THMS600) that has a stability and accuracy of ±0.1 °C were used for the microscopy studies. Images were captured with a CCD camera (Allied Vision, Prosilica GX 1050C) and were examined using ImageJ 1.49v (NIH). Samples were equilibrated for 20 min at 22 °C (except for 1% Sr(DS)2 detailed above), cooled rapidly at 50 °C min−1 to T = 6 °C (t = 0 s) and held there until crystallisation was complete, specifically when no further growth was observed. At least three repetitions were acquired per additive.
Dynamic light scattering (DLS)
DLS was conducted on a Malvern Zetasizer Nano S (model: Zen 1600) for the 1% MDS solutions, which was used as a turbidimeter to determine a (second) solubility boundary where applicable. Solutions were filtered and sealed in disposable PMMA cuvettes (VWR), equilibrated in a water bath for 20 min at 22 °C and cooled at ϕ = 0.5 °C min−1 to −5 °C. Afterwards the exterior of the cuvettes were cleaned and equilibrated in the DLS holder for 20 min at 20 °C. To determine the mean count rate, three measurements each averaging eleven runs were acquired every 1 (0.5) °C until 30 (37) °C (exception: 1% Sr(DS)2), with a 120 s equilibration step per temperature point, scattering angle θ = 173°. The data were collected using Zetasizer Software 7.01.Inductively coupled plasma optical emission spectroscopy (ICP-OES)
ICP-OES was carried out on a PerkinElmer (OPTIMA 2000 DV) to determine the concentration of counterions (M+) in solution and subsequently the concentration of MDS or SDS. Standards were required for calibration therefore ICP multi-element standard solution IV (Merck Millipore) was used for samples containing Na with Li, K, Mg, Ca or Sr, or the relevant metal chlorides for Na with Rb or Cs. For Cs a second set of standards containing 0.1% K+[Cl−] was also prepared to reduce ionisation interference which improved the signal. Both the standards and the samples were prepared in a ≈2% HNO3 solution to reduce precipitation and to matrix match.A blank and three standards (0.2, 5 and 25 ppm (25 and 50 ppm for Cs)) were initially run, with a higher concentration chosen for Cs due to the increased formation of ionic species. These results were corrected on the software (WinLab32) to ensure that the peak maximum and integration area were correctly selected for each element, wavelength and for the calibration curve. The samples could then be analysed for their Na and additive cation (“M”, for example Li) concentrations, with three measurements acquired per sample. For the Cs samples containing K no overlaps were present in the Cs and K peaks. Further information including the wavelengths chosen are detailed in the ESI† (Table S2).
The synthesised MDS compounds were analysed for their Na and “M” content to determine the yield of MDS after counterion exchange; ≥99% was the target therefore the compound was recrystallised if this was not achieved. The product was dissolved in deionised water (10 ml) to give a concentration of 5 ppm of 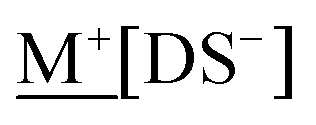 , or 25 ppm for
  (with and without 0.1% K+).
To determine whether any morphological changes observed via OM were due to integration of the additive into the crystal the 1% MDS solutions were selected. The initial solution (10 μL) was diluted with deionised water (10 ml) to serve as another ICP reference point. The remaining solution was then crystallised at T = 6 °C between 1–3 h (based on OM data) via one of two methods: (1) in a syringe attached to a 0.2 μm PTFE syringe filter, with the supernatant collected at 6 °C or (2) in an Eppendorf tube, which was centrifuged at 1700 rpm for 5 min at 6 °C before pipetting off the top layer of supernatant. For both methods the collected supernatant (30 μL) was prepared for ICP in deionised water (10 ml). The higher volume taken from the supernatant improved the sensitivity as a reduction in ion concentrations were expected. Each method was repeated twice for every counterion and the results are compared below. The calculations for the dilutions are provided in the ESI.†
Results and discussion
DSC: overview
DSC was used to investigate whether the additives acted as promoters or inhibitors of crystallisation based on shifts in the induction temperature (Tind) of 20% SDS–H2O solutions. Three additive concentrations: 0.25, 1.0 and 2.5% were studied. Samples were cooled between 23 (unless stated otherwise in the experimental section) and −5 °C at ϕ = 0.5 °C min−1, as this rate allowed for reasonable temperature equilibration.Fig. 2(a) shows a series of raw traces for 20% SDS–H2O, 0.25, 1.0 and 2.5% KDS solutions, from which the onset (Tind) and peak (Tp) temperatures were extracted.50 DSC traces for the 1% MDS solutions which are the primary focus of the study are provided in Fig. 2b(i) and (ii) for the group 1 and 2 counterions respectively, with the 20% SDS–H2O reference solution given as a dotted, black line. All profiles exhibited a single exothermic crystallisation peak. From these curves is apparent that going down group 1 Tp initially shifts towards the phase boundary of 20% SDS–H2O (≈19.1 °C),47 therefore crystallisation is increasingly favoured. At KDS Tp reaches a maximum as a further increase in the ionic radius moves Tp back to lower values. For group 2 Tp shifts to higher temperatures going down the group, with a sharper increase noted for 1% Sr(DS)2. Both Tind and Tp show comparable trends, however Tind was preferred for analysis as this is when crystallisation begins and it is less affected by peak broadening.
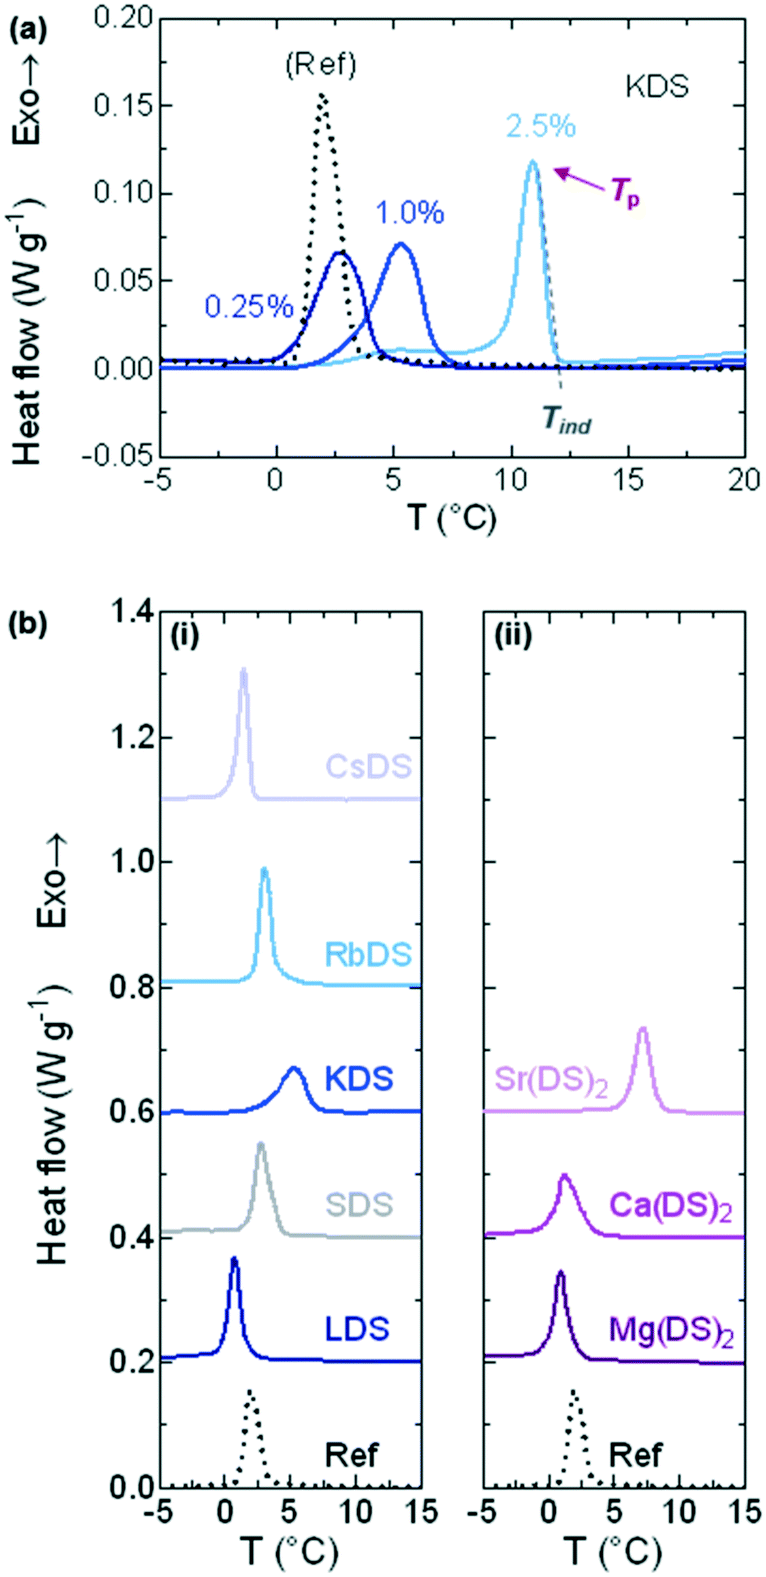 | ||
| Fig. 2 DSC traces from 20% SDS solutions spiked with additives (MDS), cooled linearly at ϕ = 0.5 °C min−1 from the micellar phase. (a) Traces for the reference solution (20% SDS–H2O), 0.25, 1.0 and 2.5% KDS; from this the induction (Tind) and peak (Tp) temperatures were extracted. (b) Traces for the solutions containing 1% additives for (i) group 1 and (ii) group 2 counterions. The dotted line is the reference solution with traces shifted in increments of 0.2 (0.3 for Cs) W g−1 for clarity. | ||
DSC: cooling ramps
For all additive concentrations Tind was plotted against concentration, as shown in Fig. 3(a) and (b) for the group 1 and 2 counterions respectively. The flat, dotted black line represents the average Tind ≈ 3.1 °C for 20% SDS–H2O, whilst the grey curve on both graphs represents additional quantities of SDS. The effect of investigating this as an additive is twofold – it allows for the full trend to be established along group 1 and for the effects of additional dodecyl sulfate chains to be compared, essentially serving as a second set of reference measurements (in addition to 20% SDS–H2O).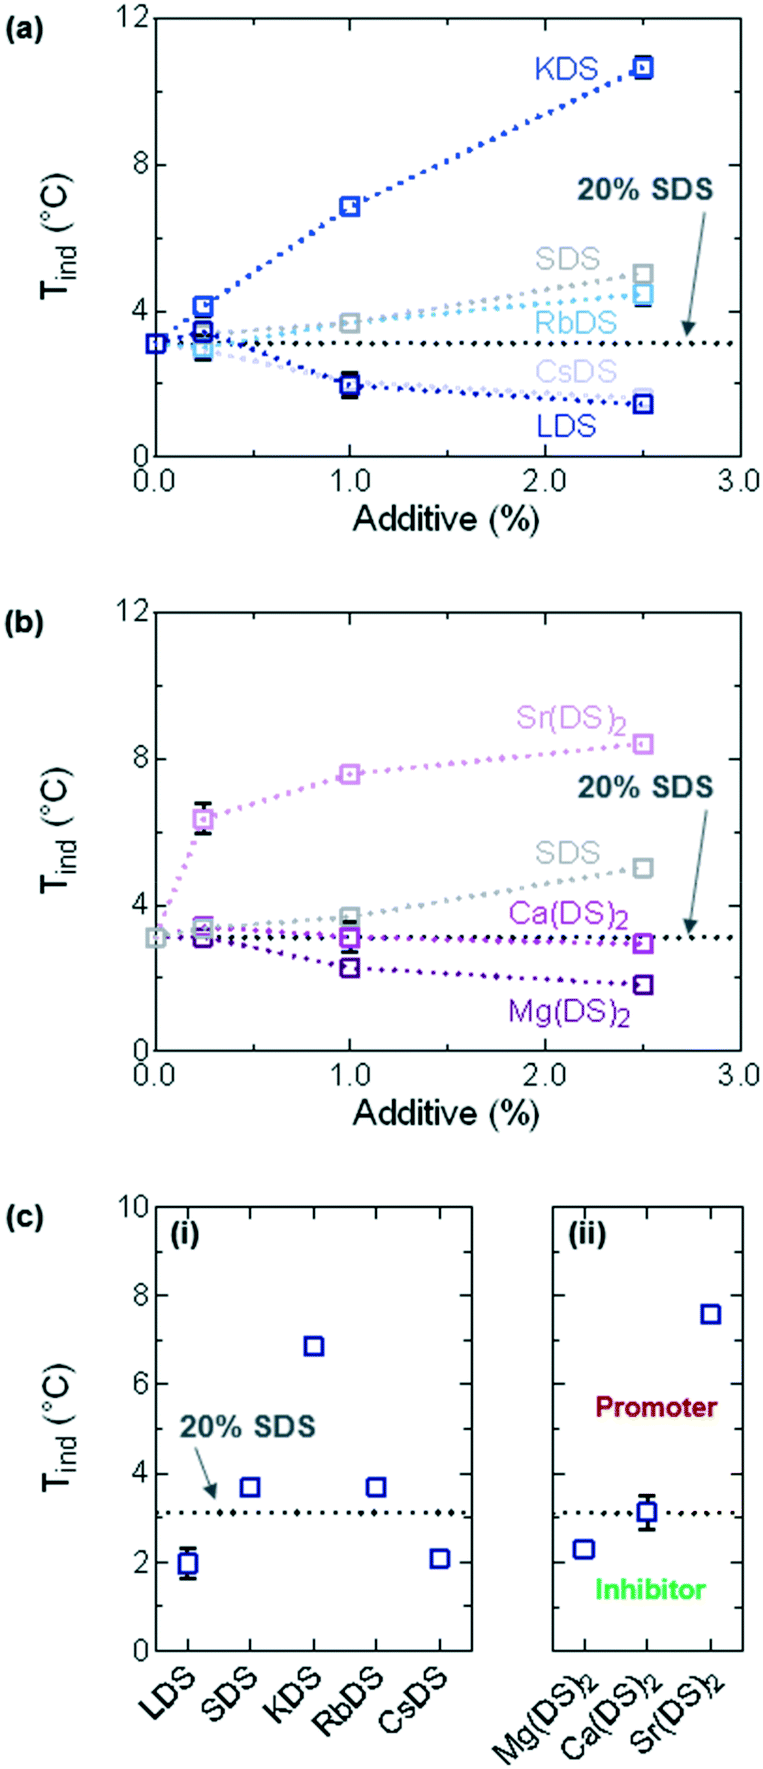 | ||
| Fig. 3 Induction temperatures (Tind) extracted from DSC data for 20% SDS–H2O solutions containing additives (MDS), cooled at ϕ = 0.5 °C min−1. For 0.25–2.5% MDS (a) group 1 and (b) group 2 counterions. (c) For 1% MDS solutions (i) group 1 and (ii) group 2. The horizontal, dotted line represents the reference solution 20% SDS–H2O. | ||
From these graphs it is evident that well-defined trends are observed for all counterions, with each acting as inhibitors, promoters or having a minor effect on SDS crystallisation. SDS, KDS, RbDS and Sr(DS)2 act as promoters – 2.5% KDS and Sr(DS)2 exert the strongest effect as they bring Tind up by ≈7.5 and ≈5.3 °C respectively against the 20% reference or ≈5.6 and ≈3.4 °C against SDS. RbDS and SDS have smaller effects against the 20% reference, increasing Tind by ≈1.6 °C for 2.5%. Only Ca(DS)2 has a minor effect against the 20% reference. The remaining three additives – LDS, CsDS and Mg(DS)2 inhibit crystallisation, ≈1.6 °C for 2.5% LDS and CsDS and ≈1.3 °C for 2.5% Mg(DS)2.
A clear concentration dependence is noted with additive addition, with all the additives (except Ca(DS)2) exerting stronger effects as promoters or inhibitors with increasing concentration. Discussed later, this is ascribed to lower and higher supersaturation for some of the inhibitors and promoters respectively and steric hinderance during incorporation of certain additives into the crystal structure, with all three parameters affected by concentration.
Overall the promoters have a stronger effect on Tind compared to the inhibitors which can be understood based on the system's MSZW. Discussed in further detail below the MSZW is already large at ≈16.0 °C. Suppressing the labile region even further is therefore likely to be problematic as the system is already very supercooled at this point and would have a high tendency to crystallise. This is supported by the fact that the decrease in Tind values shows signs of levelling off with increasing additive concentration for LDS and CsDS, whereas for the other additives the trend is almost linear.
In Fig. 3(c)Tind has been plotted for the 1% solutions. For group 1 given in Fig. 3(ci), with increasing ionic radius Tind initially follows the order LDS < SDS < KDS before decreasing in the same manner KDS > RbDS > CsDS. This trend could be caused by a variety of reasons including changes in the solubility, the coverage of the impurities, the driving force and other factors which will be discussed in turn below.
Solubility plays a key role in crystallisation which is both a temperature and concentration dependent parameter;24 for the analysis of the trends in Fig. 3(c) the focus is largely on temperature as the concentration has been fixed. With decreasing temperature the solubility also decreases; eventually the labile region of the saturation diagram is reached from which Tind values can be extracted. It is anticipated that additives such as KDS, (SDS) and RbDS reduce the solubility of the solution across all temperatures thereby acting as seed crystals or promoters of crystallisation,18,20 whilst LDS and CsDS may shift the supersolubility curve (but not the solubility curve), in turn reducing Tind and inhibiting crystallisation. Of note is that the exact trend observed here has been reported for the Krafft point of another group of surfactants, perfluorooctanic acid salts (Li < Na < K > Rb > Cs),55 which was also rationalised based on the differing solubilities of the alkali metal salts.
The melting point trend for the group 1 dodecyl sulfate salts (the pure systems) supports this to an extent as it bears strong similarities to this mixed system: LDS < SDS ≪ KDS ≈ RbDS > CsDS,37,47,53,54 with the last two points proving slightly anomalous compared to what was observed here. From this it could be argued that the additives affect the solubility curve on the saturation diagram, however the melting point data for this system shows that the values are largely unaffected, discussed further in the DSC: heating ramps section. The driving force of these additives is thus expected to be kinetic as opposed to thermodynamic. Consequently, promoters act to seed crystallisation whilst inhibitors either lower the supersaturation or impact incorporation of the units into the crystal structure; the latter is discussed below.
The coverage of the impurities is likely to depend on the counterion size which is affected by two factors – the hydration state51,52 decreases going down the group due to increased charge screening, however the ionic radius of the cation also increases. The large steric size at both extremes potentially slows down incorporation into the crystal structure, in turn causing the reduction in Tind values at either end of the group. Of note is that this hindrance does not always affect incorporation of the additives into the crystal structure, which is discussed further in the ICP-OES section. LDS for instance was the only additive not to be incorporated into the crystal, therefore its effect on Tind is likely to be due to a change in supersaturation, whilst CsDS is more likely to slow down the kinetics of incorporation due to size issues.
For group 2 Tind increases going down the group, shown in Fig. 3(cii). Mg(DS)2 acts as an inhibitor whilst Ca(DS)2 has little effect on Tind when compared to the reference. Similar points discussed for the group 1 additives apply in terms of solubility, with Mg(DS)2 potentially shifting the supersolubility curve whilst Ca(DS)2 had little effect. Again a kinetic driving force is expected as the melting points for all three remain relatively unchanged. Sr(DS)2 was the only promoter in group 2 which exhibited significant insolubility across the investigated temperature range, thereby potentially acting as a seed crystal and increasing the value of Tind. The limited solubility of Sr(DS)2 is discussed more in the heating ramps section.
According to the Hofmeister series these cations are the most kosmotropic in the order Mg2+ > Ca2+,51,52 more so than the group 1 cations due to their divalent charge. It is therefore also plausible that the inhibitory effect of Mg2+ is due to steric bulk as opposed to a shift in supersolubility.
DSC: heating ramps
DSC traces for the 1% MDS solutions are presented in Fig. 4(a) and (b) for the group 1 and 2 based additives respectively; the 20% SDS–H2O reference solution is the dotted, black line. From these curves it is apparent that all follow the same generic pattern, displaying a broad transition indicative of the crystalline phase melting down to a micellar solution. The features on the left of the peak are interpreted as the interconversion to the more stable dihydrate crystal. The melting point is taken as the peak minimum from the steepest slope which is plotted in Fig. 5(a), also where full dissolution was observed via OM.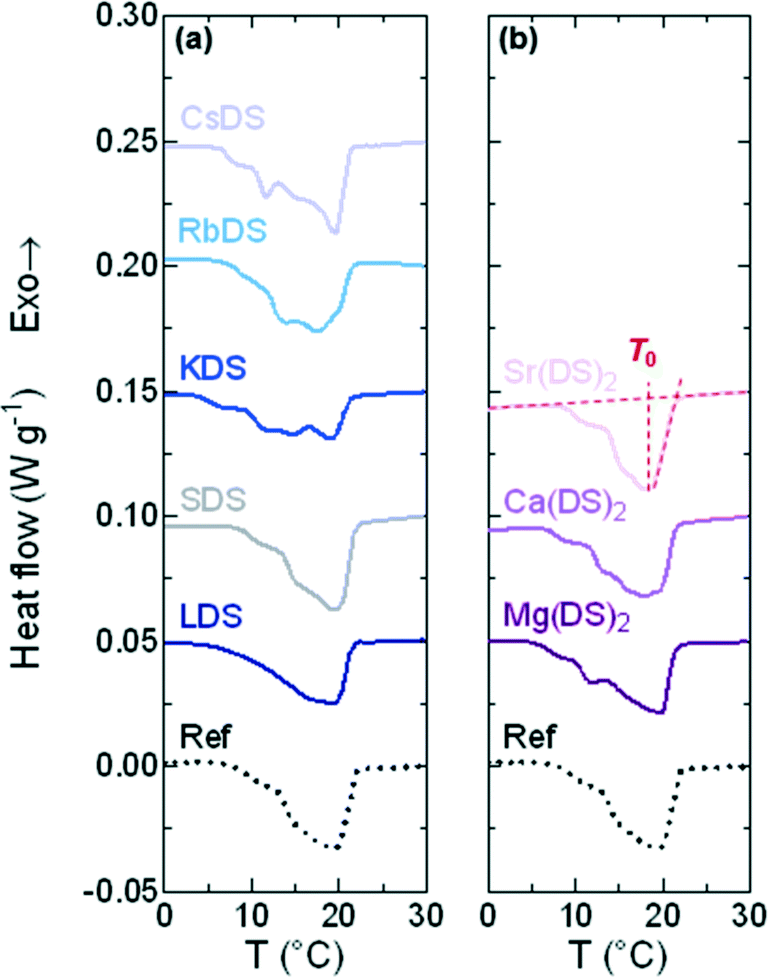 | ||
| Fig. 4 DSC traces 20% SDS solutions spiked with 1% additives (MDS). These were heated linearly at ϕ = 0.5 °C min−1 from the crystalline phase for (a) group 1 and (b) group 2 traces. The dotted line represents the reference solution 20% SDS–H2O, with traces shifted in increments of 0.05 W g−1 for clarity. | ||
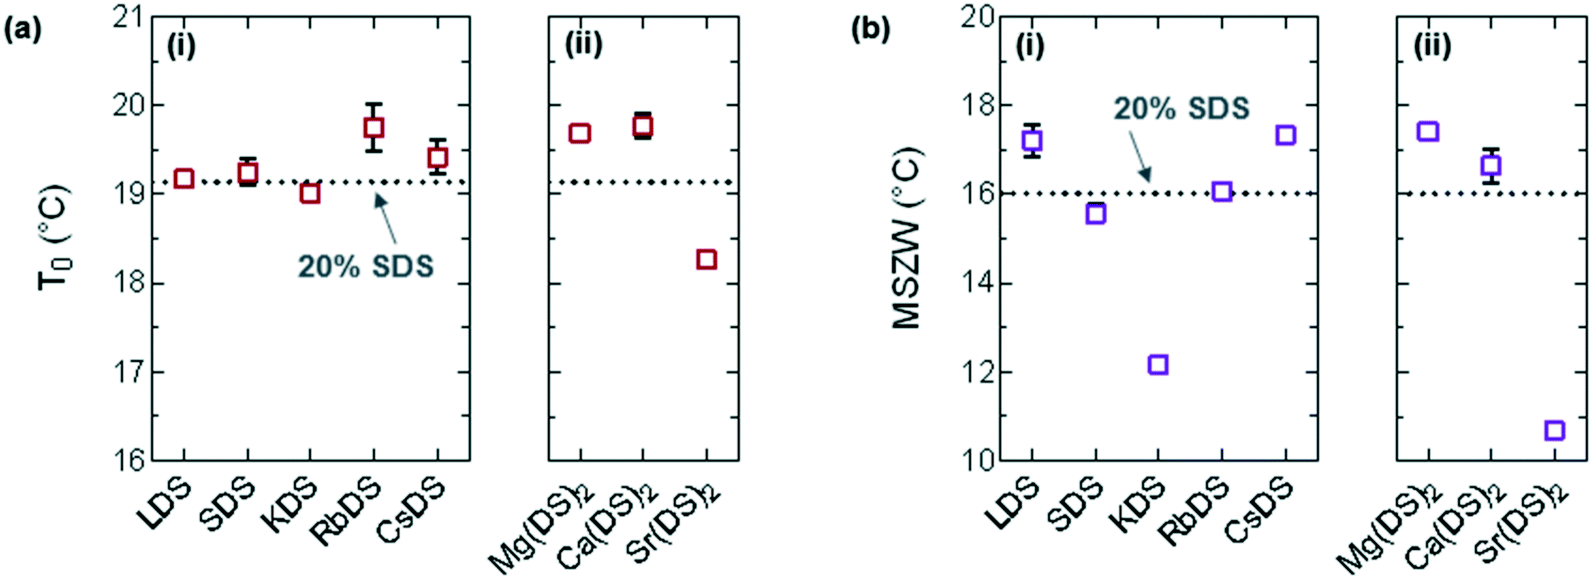 | ||
| Fig. 5 (a) Melting point (T0) taken as the minimum from the steepest slope of the heating curve and (b) MSZW = T0 − Tind for (i) group 1 and (ii) group 2. | ||
For the majority of group 1 in Fig. 5(ai) the melting points display a minor shift compared to 20% SDS–H2O, with RbDS deviating the most at 0.6 ± 0.3 °C. For group 2 in Fig. 5(aii)T0 values shift more from the reference, although this is still only 0.9 ± 0.1 °C in the largest case – Sr(DS)2. Overall for both groups no significant impact on T0 is noted with the addition of the additives. This suggests that their effect is predominantly kinetic as opposed to thermodynamic, with the counterions hindering or promoting crystal nucleation or growth.
While seven of the eight solutions containing additives melted to form a micellar solution at T0, Sr(DS)2 solutions contained a residual precipitate with a partially crystalline texture. To determine the temperature at which this precipitate dissolved for 1% Sr(DS)2 the solution's turbidity was measured via DLS. Described further in the experimental section the mean count rate of the solution was measured every 0.5 °C from 20 to 37 °C. From this it was determined that the precipitate fully dissolves by 33 ± 0.5 °C when the curve reached a plateau, ESI† (Fig. S1). The other 1% solutions were also measured for comparison at 1 °C intervals, confirming that precipitates were not present in solution after melting was complete as the profiles were flat.
The MSZW is the difference between the saturation temperature (T0) and the temperature at which crystallisation is detected (Tind) for a given cooling rate: MSZW = T0 – Tind.56–58 The MSZW for 20% SDS–H2O at ϕ = 0.5 °C min−1 is already relatively large at 16.0 ± 0.1 °C compared to other systems (such as simple inorganic salts),59 possibly due to the rearrangement which occurs when these micellar solutions crystallise to form a lamellar structure.
For the most part the MSZW in Fig. 5(b) is the reverse of Tind because the melting point remains relatively unchanged. LDS, CsDS and Mg(DS)2 widen the MSZW by ≈1.3 °C, increasing the uncertainty window of crystallisation. SDS, RbDS and Ca(DS)2 have a smaller effect as their impact on Tind was lower, on average changing the MSZW by 0.1 ± 0.5 °C. KDS and Sr(DS)2 lower the MSZW by ≈3.9 and ≈5.3 °C respectively by making the solution more prone to crystallisation, thereby reducing this uncertainty window. As mentioned previously the MSZW is already large and the system is very supercooled. Further widening of the MSZW is thus more challenging than suppression, therefore it is expected that additives will promote as opposed to inhibit crystallisation far more readily. These effects are significant and are induced by a relatively small quantity of additive (1%). These can easily enter the system during manufacturing, for example, if non-deionised water is used due to preferential Na exchange.
Optical microscopy: morphologies
The crystallisation of micellar SDS–H2O solutions was previously found to yield a range of morphologies from platelets through to needles depending on the temperature27 and cooling rate.47 The impact of linear cooling conditions is useful to parameterise as most formulations are likely to experience temperature variations under practically relevant conditions. With the presence of additives however Tind occurs at a variety of temperatures for a given rate, as shown above. Different morphologies and kinetics would therefore be expected, making it challenging to determine whether these are caused by the additive addition or the temperature at which crystallisation occurred. The approach chosen via OM was therefore isothermal holds at T = 6 °C, which also provided additional kinetic data by employing a different type of temperature profile.Images of the representative crystal morphology observed for the 1% additives are given in Fig. 6(a). Whilst the reference solution yielded an octagonal platelet at T = 6 °C a variety of different morphologies are observed with additives, which are generically characterised as platelets. 1% KDS and RbDS give hexagonal and diamond shaped crystals respectively, both of which differ from the reference due to increasing omission of sides. These crystals grow via structural evolution,60 possibly due to the additive binding to the crystal face which inhibits their growth. LDS, SDS and CsDS retained the octagonal form, with LDS and SDS comparable to the reference solution. In contrast four of the faces for CsDS are truncated, again attributed to additive inhibition.
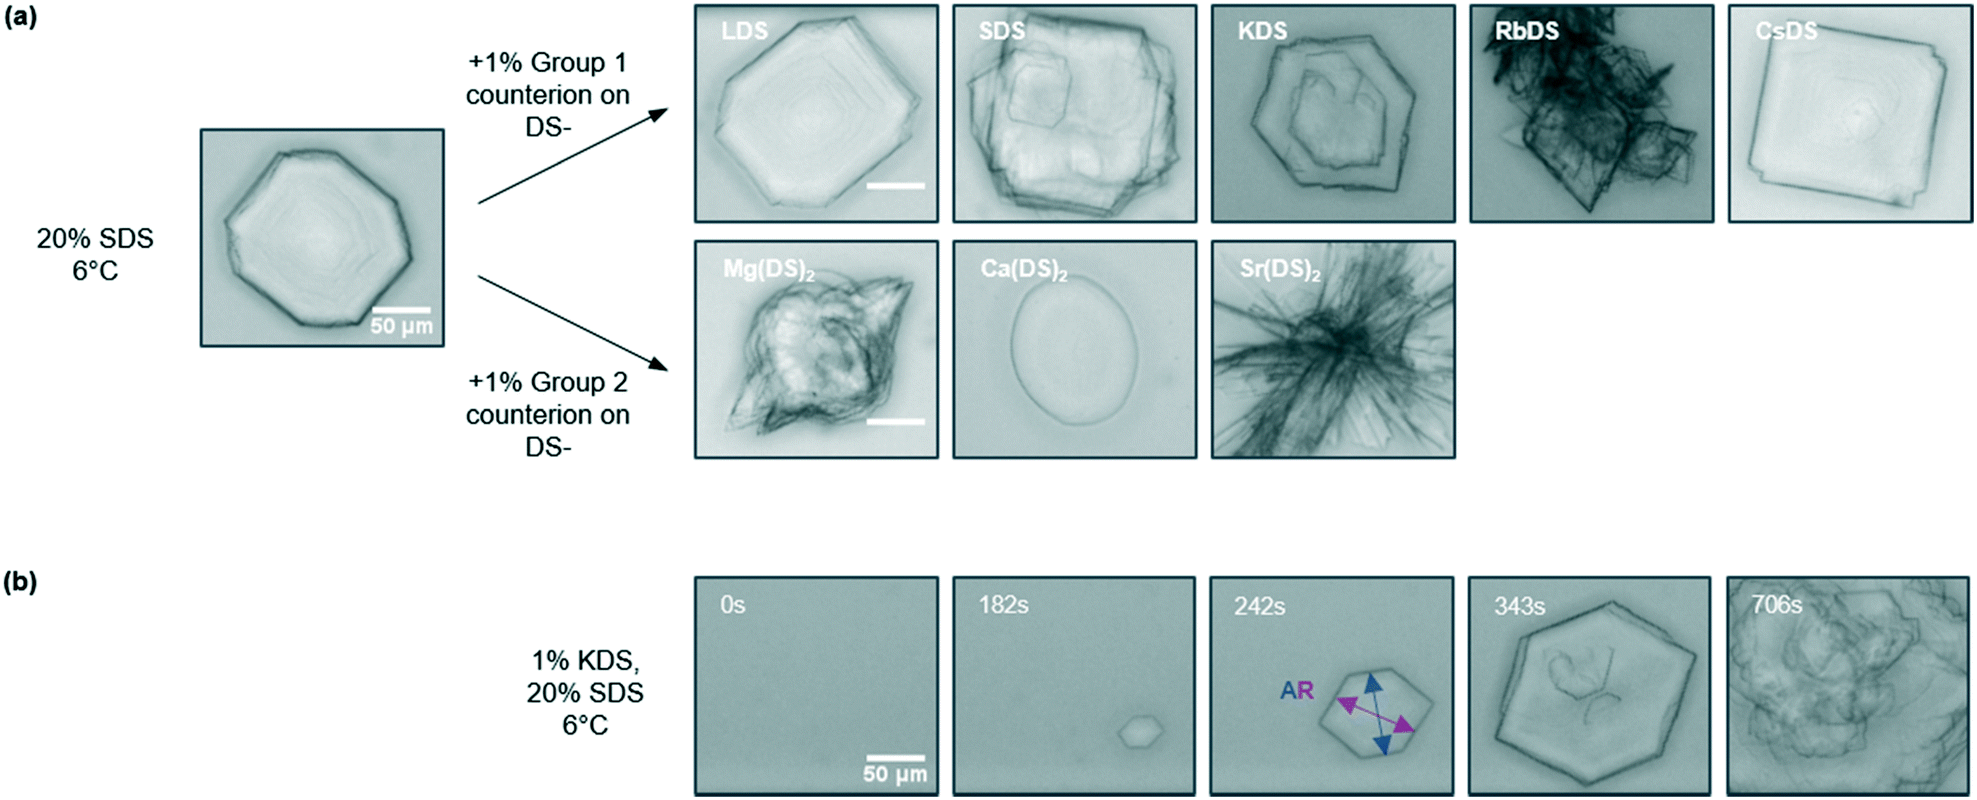 | ||
| Fig. 6 (a) Optical microscopy images depicting the representative crystal morphology for each 20% SDS–H2O solution doped with 1% additive for the group 1 and 2 based counterions. Samples were quenched to T = 6 °C and held isothermally until crystallisation was complete. (b) The development of crystallisation over time for 1% KDS, from which the induction time (tind) and the aspect ratio (AR) were determined. All scale bars are 50 μm. | ||
For group 2 the changes are more prominent as shown in Fig. 6(a). 1% Mg(DS)2 and Ca(DS)2 give oval shaped crystals which develop features over time. With 1% Mg(DS)2 rapid growth occurs from one or more sides of the crystal, whereas for Ca(DS)2 darker spots arise, as shown in ESI† (Fig. S2a and b). Although Ca(DS)2 has a minimal impact on Tind, complementary microscopy data establishes its effect as an additive. Sr(DS)2 exhibits a considerable change in morphology over the crystallisation period – whilst this briefly begins as an oval platelet, rapid growth ensues from the sides to give large, thick needles, shown in Fig. 6(a) and ESI† (Fig. S2c). Overall most of the morphologies observed here differ to those formed during the isothermal and linear cooling studies of SDS–H2O,27,47 therefore are ascribed to the additives.
Optical microscopy: integration and crystallisation kinetics
ICP-OES was combined with the microscopy results to understand whether there was a relationship between the two data sets, specifically whether each additive was integrated into the crystal, directed crystallisation or had no effect on the morphology. ICP-OES is not a standard method to analyse whether an additive is integrated into a crystal. Traditional techniques focus on XRD of the crystal itself or washings from the surface of the crystal to analyse whether an additive is completely or surface-integrated respectively. In this instance this novel approach was preferred due to its ease and high sensitivity. The supernatant was selected over the crystal itself as residual supernatant on the crystal's surface can skew the results whilst washing this off potentially removes any surface-integrated additive, particularly problematic for this system due to the small size of the crystals.The percentage of both Na and the counterion (“M”) were determined for the starting solution (which served as a second set of references in addition to the standards) and the supernatant of the crystallised solutions. The concentration (ppm) of ions in the original solution and supernatant after dilution were converted to percentages relative to 20% SDS or 1% additive for ease of interpretation – for example the Na content in the starting solution is 1.59% or 15.9 ppm. These calculations along with the dilutions are provided in the ESI.†
In Fig. 7(a) the dotted line at the top represents the normalised Na content pre-crystallisation, whilst the square symbols are the normalised Na in the supernatant. From these results it is noted that almost all the Na is integrated in the crystal across the additives, with the marginally higher value for Li ≈ 1.36% compared to an average of ≈0.46% (maximum: 20%) considered to be within experimental error. For Fig. 7(b) the dotted line and symbols are for the additive, again normalised. In most cases almost no additive remains in the solution which correlates to the (mostly) pronounced morphological changes observed in Fig. 6(a). The exceptions to this are LDS which shows little sign of integration as 0.87 ± 0.10% (maximum: 1.00%) Li remains in the supernatant and additional SDS, both of which retain the octagonal morphology with similar dimensions to the reference solution.
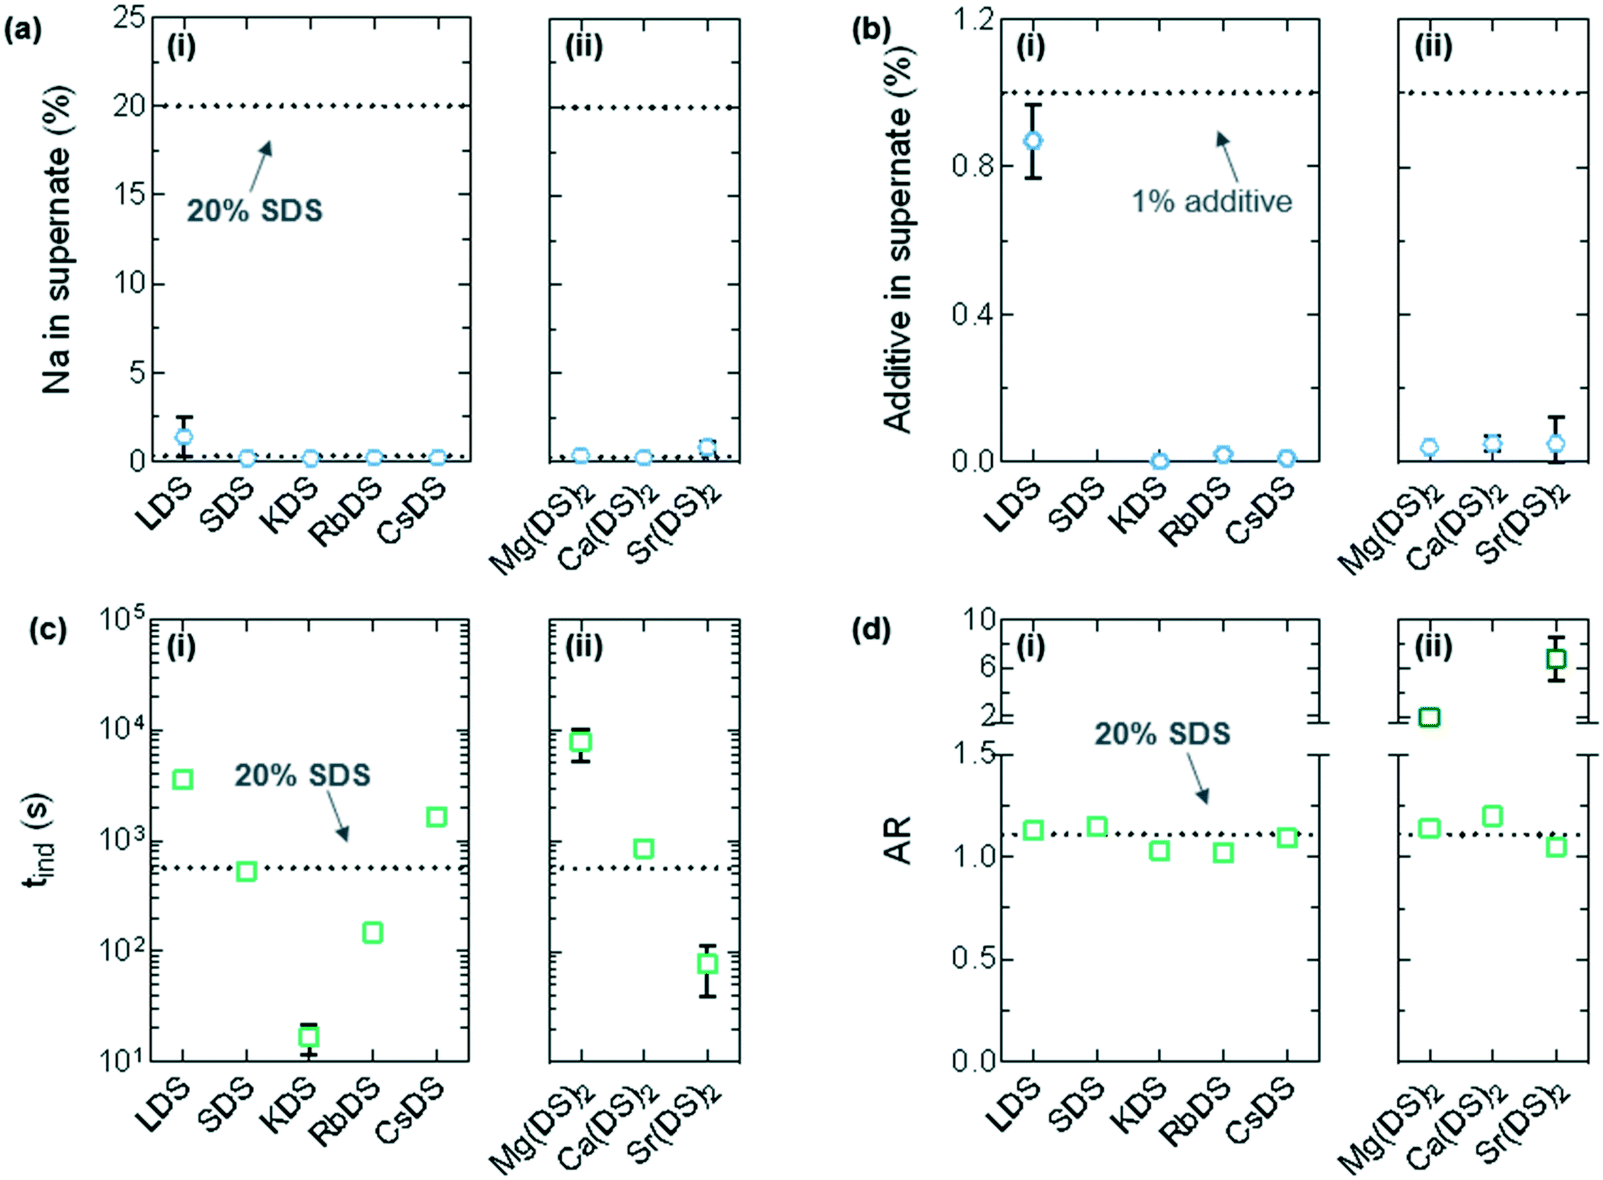 | ||
| Fig. 7 Determination of the ion concentration in the supernatant using ICP-OES after crystallisation was complete and crystallisation kinetics from OM. (a) Percentage of Na normalised to the SDS concentration (20% – the dotted line at the top) for (i) group 1 and (ii) group 2. (b) Percentage of the additive's counterion (M) normalised to its (MDS) concentration (1% – the dotted line at the top) for (i) group 1 and (ii) group 2. This has been omitted for SDS as the 1% cannot be distinguished from the 20%. (c) Induction times (tind) from OM data at T = 6 °C for (i) group 1 and (ii) group 2. (d) Aspect ratio (AR) for the crystals in (i) group 1 and (ii) group 2; the darker points >1.5 for mg(DS)2 and Sr(DS)2 include the dimensions of any protrusions which formed during crystal growth. | ||
The induction times (tind) taken from optical microscopy have been plotted in Fig. 7(c); the values represent upper limits given the finite spatial resolution of microscopy.5 These are the reverse of the Tind values noted in Fig. 3(c), specifically the additives that exhibited a low Tind in the linear cooling experiments have a correspondingly long tind value due to increased metastability. Mg(DS)2 for example has a tind ≈ 7.8 ± 2.5 × 10³ s and Tind ≈ 2.3 °C, whereas KDS has a tind ≈ 17 ± 5 s and Tind ≈ 6.8 °C.
The evolution of the crystal morphology with time was used to determine the aspect ratio (AR) by averaging the length to width ratio61 across the images. This is shown in Fig. 6(b) for KDS; the last image in the series only shows surface features as the crystal has outgrown the illustrative area. 1% LDS, SDS and CsDS had the lowest impact on the AR, averaging 1.12 ± 0.03 compared to the reference AR of 1.11 ± 0.01. 1% KDS and RbDS crystals visibly grew smaller and had a notably reduced AR of 1.03 ± 0.01 and 1.02 ± 0.01 respectively. Although the cooling rate is often changed to produce smaller size crystals62 to improve filtration or dissolution properties here the same effect has been achieved with additives.
For group 2 the oval-shaped Ca(DS)2 crystal exhibited the lowest increase in AR to 1.20 ± 0.03, which was the only one to have any protrusions. Mg(DS)2 began with this oval base that has an AR of 1.14 ± 0.04 however the protrusions brought this up to 1.90 ± 0.08, as noted by the darker points in Fig. 7(d). With Sr(DS)2 the thick needles bring its AR up considerably to 6.74 ± 1.74. Needles are generally considered to be an undesirable morphology due to their poor flow properties.63,64
While the group 1 counterions demonstrated small changes in the AR of 20% SDS–H2O crystals, the group 2 counterions significantly increased this. Depending on the use, a lower AR may be preferred to reduce compact layer formation at the bottom of filtration media or to alter flow properties. Overall small quantities of structurally similar SDS additives on which the counterion is varied have notable kinetic and morphological effects on SDS–H2O crystallisation, as summarised in Fig. 8.
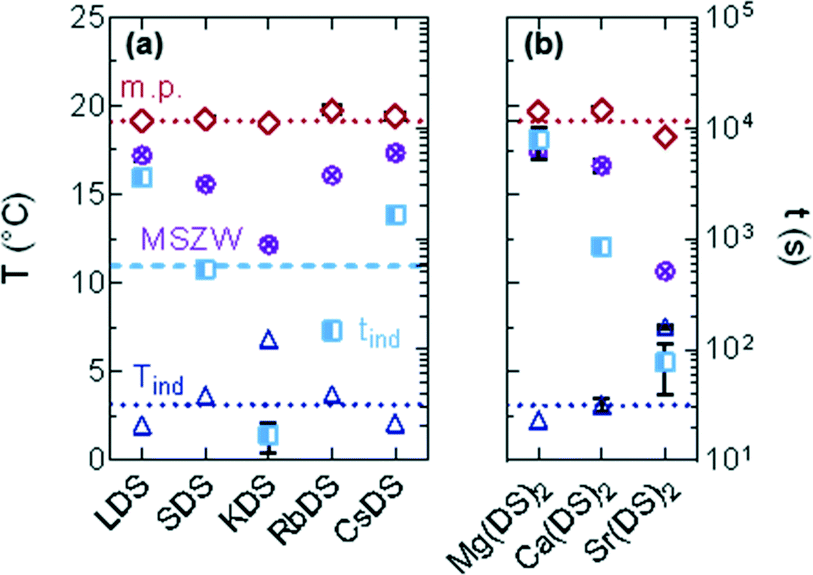 | ||
| Fig. 8 Summary of the trends observed when 1% of a structurally similar SDS additive (MDS) was added to 20% SDS–H2O. Left axis: Tind (dark blue), melting point (red) and MSZW (purple); right: tind (light blue) for the counterions in (a) group 1 and (b) group 2. The dotted lines are the values for 20% SDS–H2O. | ||
Conclusions
The effect of structurally similar additives on the crystallisation kinetics and morphologies of the ubiquitous SDS–H2O micellar system was investigated under isothermal and linear cooling conditions. Seven different counterions from groups 1 and 2 of the periodic table were chosen to replace the sodium on SDS to give the following additives: LDS, (SDS), KDS, RbDS, CsDS, Mg(DS)2, Ca(DS)2 and Sr(DS)2, which were added to a reference solution of 20% SDS–H2O. DSC at a fixed cooling rate ϕ = 0.5 °C min−1 for 0.25, 1.0 and 2.5% additive showed that (additional SDS), KDS, RbDS, Sr(DS)2 promoted crystallisation, Ca(DS)2 had a minor effect and LDS, CsDS, Mg(DS)2 inhibited crystallisation. This was rationalised based on available solubility data, the counterion size and hydration state. The changes in melting point were found to be minimal suggesting that the additives had a kinetic as opposed to a thermodynamic effect. As such the MSZWs were essentially the reverse of Tind. Complementary data from DLS suggests that all the additives except Sr(DS)2 undergo transitions from the crystalline phase to give a micellar solution; this additive requires higher temperatures to dissolve a residual precipitate.Optical microscopy for the 1% solutions shows that most additives had an impact on the morphology at T = 6 °C. For group 1 RbDS and KDS gave hexagonal and diamond shaped crystals which exhibited a lower AR than the reference, often considered more desirable as they are less “sheet-like”. LDS, SDS and CsDS however retained the reference morphology. The basis of group 2 are oval-shaped crystals which exhibit protrusions for Mg(DS)2 and the dominance of thick, platelet-type needles originating from centre for Sr(DS)2. These needles had the largest AR, a potential drawback when it comes to processing and dissolution. OM data was supported by ICP-OES which indicated that the morphological changes were caused by integration of the additives into the crystal. Lastly, although many of the Tind values were lower than 6 °C during the cooling ramp studies, tind values from OM were the reverse of Tind due to increased metastability.
Overall small (0.25 to 2.5%) quantities of structurally similar additives had a relatively potent effect on SDS–H2O crystallisation. These additives can easily form if non-deionised water enters the system, for instance, as the Na on SDS is preferentially exchanged by multiple cations from group 1 and 2. Additives also enable tailoring of both the crystal morphology and the potential to increase or decrease the solution's stability below the micellar-to-crystalline phase boundary.
Conflicts of interest
There are no conflicts to declare.Acknowledgements
We thank the Engineering and Physical Sciences Research Council (EPSRC) Institute of Chemical Biology-CDT (EP/L015498/1) and The Procter & Gamble Company (P&G) for a PhD studentship for RMM. We are grateful to Ms. Patricia Carry for use of the DSC and ICP-OES, and Dr. Andreas Poulos for assistance with DLS measurements.Notes and references
- A. E. Hargreaves, Chemical Formulation: An Overview of Surfactant Based Preparations Used in Everyday Life, Royal Society of Chemistry, Cambridge, U.K., 2003 Search PubMed.
- M. Patel, J. Ind. Ecol., 2004, 7, 47–62 CrossRef.
- K. Hill, Pure Appl. Chem., 2000, 72, 1255–1264 CAS.
- I. Johansson and M. Svensson, Curr. Opin. Colloid Interface Sci., 2001, 6, 178–188 CrossRef CAS.
- M. A. Lovette, A. R. Browning, D. W. Griffin, J. P. Sizemore, R. C. Snyder and M. F. Doherty, Ind. Eng. Chem. Res., 2008, 47, 9812–9833 CrossRef CAS.
- K. Fontell, Mol. Cryst. Liq. Cryst., 1981, 63, 59–82 CrossRef CAS.
- K. J. Mysels, Langmuir, 1986, 2, 423–428 CrossRef CAS.
- P. H. Elworthy and K. J. Mysels, J. Colloid Interface Sci., 1966, 21, 331–347 CrossRef CAS.
- I. Weissbuch, R. Popovitz-Biro, M. Lahav and L. Leiserowitz, Acta Crystallogr., Sect. B: Struct. Sci., 1995, 51, 115–148 CrossRef.
- N. Rodríguez-Hornedo and D. Murphy, J. Pharm. Sci., 1999, 88, 651–660 CrossRef PubMed.
- J. Garside, A. Mersmann and J. Nyvlt, Measurement of Crystal Growth and Nucleation Rates, Institution of Chemical Engineers, Rugby, 2nd edn, 2002 Search PubMed.
- A. Van Hook, Crystallization: Theory and Practice, Reinhold Pub. Corp., New York, 1961 Search PubMed.
- I. Sunagawa, Crystals: Growth, Morphology and Perfection, Cambridge University Press, Cambridge, 2005 Search PubMed.
- D. Mangin, F. Puel and S. Veesler, Org. Process Res. Dev., 2009, 13, 1241–1253 CrossRef CAS.
- D. Lechuga-Ballesteros and N. Rodríguez-Hornedo, Int. J. Pharm., 1955, 115, 151–160 CrossRef.
- C. Gu, K. Chatterjee, V. Young and D. J. W. Grant, J. Cryst. Growth, 2002, 235, 471–481 CrossRef CAS.
- V. Fischer, K. Landfester and R. Muñoz-Espí, Cryst. Growth Des., 2011, 11, 1880–1890 CrossRef CAS.
- K. Sangwal, Additives and Crystallization Processes: From Fundamentals to Applications, John Wiley, England, 2007 Search PubMed.
- M. Kind, Chem. Eng. Process., 1999, 38, 405–410 CrossRef CAS.
- R. J. Davey, S. L. M. Schroeder and J. H. ter Horst, Angew. Chem., Int. Ed., 2013, 52, 2166–2179 CrossRef CAS PubMed.
- M. J. Rosen, Surfactants and Interfacial Phenomena, John Wiley, New Jersey, 3rd edn, 2004 Search PubMed.
- E. Smulders, W. von Rybinsk and A. Nordskog, Ullmann's Encyclopedia of Industrial Chemistry, Wiley-VCH Verlag GmbH & Co. KGaA, Weinheim, Germany, 2011 Search PubMed.
- J. Bibette, F. L. Calderon and P. Poulin, Rep. Prog. Phys., 1999, 62, 969–1033 CrossRef CAS.
- J.-C. Baret, Lab Chip, 2012, 12, 422–433 RSC.
- P. Kékicheff, C. Grabielle-Madelmont and M. Ollivon, J. Colloid Interface Sci., 1989, 131, 112–132 CrossRef.
- P. Kékicheff, J. Colloid Interface Sci., 1989, 131, 133–152 CrossRef.
- R. M. Miller, A. S. Poulos, E. S. J. Robles, N. J. Brooks, O. Ces and J. T. Cabral, Cryst. Growth Des., 2016, 16, 3379–3388 CrossRef CAS.
- V. M. Coiro, F. Mazza and G. Pochetti, Acta Crystallogr., Sect. C: Cryst. Struct. Commun., 1986, 42, 991–995 CrossRef.
- V. M. Coiro, M. Manigrasso, F. Mazza and G. Pochetti, Acta Crystallogr., Sect. C: Cryst. Struct. Commun., 1987, 43, 850–854 CrossRef.
- S. Sundell, Acta Chem. Scand., Ser. A, 1977, 31, 799–807 CrossRef.
- L. A. Smith, R. B. Hammond, K. J. Roberts, D. Machin and G. McLeod, J. Mol. Struct., 2000, 554, 173–182 CrossRef CAS.
- F. F. J. Rawlings and E. C. Lingafelter, J. Am. Chem. Soc., 1950, 72, 1852 CrossRef CAS.
- F. F. J. Rawlings and E. C. Lingafelter, J. Am. Chem. Soc., 1955, 77, 870–872 CrossRef CAS.
- V. M. Coiro and F. Mazza, Acta Crystallogr., Sect. C: Cryst. Struct. Commun., 1989, 45, 1132–1136 CrossRef.
- V. M. Coiro and F. Mazza, Acta Crystallogr., Sect. C: Cryst. Struct. Commun., 1991, 47, 1169–1173 CrossRef.
- R. P. Sperline, Langmuir, 1997, 13, 3715–3726 CrossRef CAS.
- L. A. Smith, K. J. Roberts, D. Machin and G. McLeod, J. Cryst. Growth, 2001, 226, 158–167 CrossRef CAS.
- N. Rodríguez-Hornedo and D. Murphy, J. Pharm. Sci., 2004, 93, 449–460 CrossRef PubMed.
- X.-Y. Sun, J.-M. Ouyang and M. Xu, CrystEngComm, 2016, 18, 5463–5473 RSC.
- S. Kumar, G. Chawla and A. K. Bansal, Yakugaku Zasshi, 2008, 128, 281–289 CrossRef CAS.
- G. Liu, J. Liu, X. Tao, D.-S. Li and Q. Zhang, Inorg. Chem. Front., 2016, 3, 1388–1392 RSC.
- H. Wei, Q. Shen, Y. Zhao, Y. Zhou, D. Wang and D. Xu, J. Cryst. Growth, 2005, 279, 439–446 CrossRef CAS.
- M. H. H. Mahmoud, M. M. Rashad, I. A. Ibrahim and E. A. Abdel-Aal, J. Colloid Interface Sci., 2004, 270, 99–105 CrossRef CAS PubMed.
- E. Summerton, G. Zimbitas, M. Britton and S. Bakalis, J. Cryst. Growth, 2016, 455, 111–116 CrossRef CAS.
- M. Muramatsu and M. Inoue, J. Colloid Interface Sci., 1976, 55, 80–84 CrossRef CAS.
- D. Bethell, R. E. Fessey, E. Namwindwa and D. W. Roberts, J. Chem. Soc., Perkin Trans. 2, 2001, 1489–1495 RSC.
- R. M. Miller, O. Ces, N. J. Brooks, E. S. J. Robles and J. T. Cabral, Cryst. Growth Des., 2017, 17, 2428–2437 CrossRef CAS.
- S. Miyamoto, Bull. Chem. Soc. Jpn., 1960, 33, 371–375 CrossRef CAS.
- Y. Moroi, K. Motomura and R. Matuura, J. Colloid Interface Sci., 1974, 46, 111–117 CrossRef CAS.
- A. Jeziorny, Polymer, 1978, 19, 1142–1144 CrossRef CAS.
- F. Hofmeister, Arch. Exp. Pathol. Pharmakol., 1888, 24, 247–260 Search PubMed.
- W. Kunz, J. Henle and B. W. Ninham, Curr. Opin. Colloid Interface Sci., 2004, 9, 19–37 CrossRef CAS.
- K. Tamori, K. Esumi and K. Meguro, J. Colloid Interface Sci., 1991, 142, 236–243 CrossRef CAS.
- A. Vagias, W. L. Suszynski, H. T. Davis and A. V. McCormick, J. Chem. Eng. Data, 2017, 62, 1623–1627 CrossRef CAS.
- H. Nakayama, Bull. Chem. Soc. Jpn., 1967, 40, 1592–1595 CrossRef CAS.
- N. Lyczko, F. Espitalier, O. Louisnard and J. Schwartzentruber, Chem. Eng. J., 2002, 86, 233–241 CrossRef CAS.
- K. Sangwal, Cryst. Growth Des., 2009, 9, 942–950 CrossRef CAS.
- J. W. Mullin, Crystallization, Butterworth-Heinemann, Oxford, 4th edn, 2001 Search PubMed.
- J. Nývlt, R. Rychlý, J. Gottfried and J. Wurzelová, J. Cryst. Growth, 1970, 6, 151–162 CrossRef.
- Y. Zhang, J. P. Sizemore and M. F. Doherty, AIChE J., 2006, 52, 1906–1915 CrossRef CAS.
- G. Yang, N. Kubota, Z. Sha, M. Louhi-Kultanen and J. Wang, Cryst. Growth Des., 2006, 6, 2799–2803 CrossRef CAS.
- C. Wibowo and K. M. Ng, AIChE J., 2001, 47, 2746–2767 CrossRef CAS.
- N. Variankaval, A. S. Cote and M. F. Doherty, AIChE J., 2008, 54, 1682–1688 CrossRef CAS.
- W. M. L. Wood, Powder Technol., 2001, 121, 53–59 CrossRef CAS.
Footnote |
| † Electronic supplementary information (ESI) available: ICP-OES details including wavelengths and calculations, DLS and additional optical microscopy data. See DOI: 10.1039/c8ce00452h |
| This journal is © The Royal Society of Chemistry 2018 |