 Open Access Article
Creative Commons Attribution 3.0 Unported Licence
Aligning self-assembled perylene bisimides in a magnetic field†
Emily R.
Draper
 *a,
Matthew
Wallace
b,
Dirk
Honecker
 c and
Dave J.
Adams
 a
a
aSchool of Chemistry, Joseph Black Building, University of Glasgow, WESTChem, Glasgow, G12 8QQ, UK. E-mail: Emily.Draper@glasgow.ac.uk
bSchool of Pharmacy, University of East Anglia, Norwich Research Park, Norwich, NR4 7TJ, UK
cInstitut Laue-Langevin, Large Scale Structures Group, 71 Avenue des Martyrs, CS 20156, Grenoble CEDEX 9 F-38042, France
First published on 31st August 2018
Abstract
Photoconductive self-assembled 1D structures can be formed by perylene bisimides. These structures are generally randomly orientated, limiting their applications as conductive wires. Here, we show that magnetic fields can be used to create highly aligned, directionally-dependent thin films. This approach leads to well-aligned structures over large areas.
Flexible conductive materials are of great interest for wearable electronics.1 The ability to make electronic components such as sensors smaller, coupled with flexibility allows the design of devices that can be worn on the skin.2 The problem is that electronic devices are often made from hard materials that are not comfortable for the wearer and so flexible alternatives are being investigated.3–5 Greater flexibility can be achieved by embedding metals into flexible polymers or by using nanomaterials which can be grown from surfaces.3,6,7 These methods can be expensive or result negatively on the materials’ properties. An alternative approach is to use self-assembled organic materials which in themselves are conductive and form fibres.2 These fibres can then conceptually be aligned using various methods such as spin coating or shear alignment.8–10 This results in directionally-dependent conductivity and can also have the advantage of making the materials more flexible.
A good candidate for this approach are perylene bisimides (PBIs), as they are conductive, and can form self-assembled fibres in solution.11,12 By changing the solvent, the aggregation of the PBIs can also be controlled, which can change the properties of the resulting material.11,13,14
Aligning fibres from PBIs can be carried out by spin-coating, relying on a volatile solvent being removed quickly in order to retain the alignment.10,15 This method of alignment often can be wasteful in terms of sample volume and difficult to control. PBI-surfactant complexes and PBI-polyelectrolyte complexes have been aligned using shear.16,17 Some PBIs have been shown to contain worm-like micelles when self-assembled in water, which form (photo)conductive films when dried.12,18 Aligned materials can be formed using this approach; the issue is removing the water quickly whilst preserving the alignment of the self-assembled structures. PBIs have been aligned in water using continuous shear alignment, resulting in a circular alignment of the worm-like micelles and (combined with a slow pH drop) gel fibres.19,20 The shear had to be continuously applied as the sample dried as the worm-like-micelles quickly became isotropic once the shearing stopped.19 Although this approach allowed samples to be formed with a directional dependent photoresponse, it is not suitable for all devices due to the circular orientation, as opposed to the optimal unidirectional orientation.
We have previously shown naphthalene–dipeptides form self-assembled structures that align in a magnetic field. Alignment can be demonstrated by the observation of residual quadrupolar splitting of the deuterium NMR resonances of D2O or other deuterated species.21–23 Other quadrupolar nuclei such as 23Na or 14N can also be studied.21,24,25 The alignment is thought to be due to the negatively charged structures aligning perpendicular to the field and so rendering the deuterium distribution associated with the structures anisotropic, leading to splitting in the spectra. The magnitude of the splitting can be correlated with the degree of alignment.21,24 The benefit of using magnetic fields for alignment is that the strength can be varied, and the field can be applied non-destructively to a sample in situ.26,27 There are many examples of magnetically aligning diamagnetic natural and synthetic fibres,27 including peptide amphiphiles.28
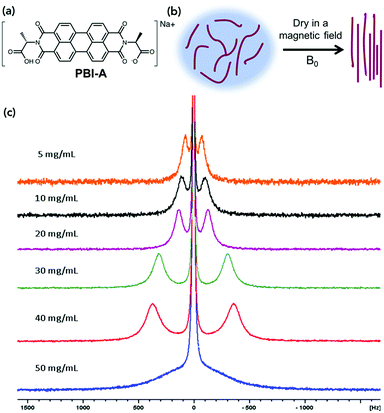
Here, we investigate the effect of drying of L-alanine appended perylene bisimide (PBI-A) under a magnetic field (Fig. 1). We monitor this alignment using 23Na NMR spectroscopy, small angle neutron scattering (SANS) and polarised light microscopy. The directional dependence of the conductivity of the aligned samples was measured using electrochemical techniques.
Worm-like micelles of PBI-A were formed in water by adding an equimolar amount of 0.1 M NaOH solution and stirring overnight as described previously.12,29 Solutions were prepared at different concentrations of PBI-A (5, 10, 20, 30, 40 and 50 mg mL−1). Dynamic viscosity measurements, scanning electron microscopy (SEM) and small angle neutron scattering (SANS) showed the presence of worm-like micelles at all concentrations investigated. The viscosity data showed a shear-thinning behaviour indicative of these types of structure being present (Fig. S4, ESI†). The higher the concentration of PBI-A, the higher the viscosity at high shear rates, implying that there are more micelles present in solution. The SANS data at 30 mg mL−1 could be fitted to a flexible elliptical cylinder model combined with a power law as in our previous work18 showing that the self-assembled structures have a diameter of 4.8 ± 0.01 nm (Fig. S5 and Table S1, ESI†). The fits to the data are very similar to that previously shown for the solution at 5 mg mL−1,18 implying that the same structures are formed across this concentration range. SEM showed that when these solutions are dried, anisotropic structures persist, which have an average diameter of 10.8 ± 0.8 nm (Fig. S6, ESI†).
23Na NMR spectra were recorded here on solutions of PBI-A at concentrations ranging from 5 to 50 mg mL−1. The data showed splitting of the 23Na+ resonance, which is indicative of alignment of the worm-like fibres in solution (Fig. 1c). This splitting is due to the 23Na becoming anisotropic due to association with the aligned worm-like micelles, rather than the 23Na ions being aligned.
The extent of splitting increases proportionally to the concentration, except at 50 mg mL−1. This could be due to crowding of the material or liquid crystal formation at this concentration.
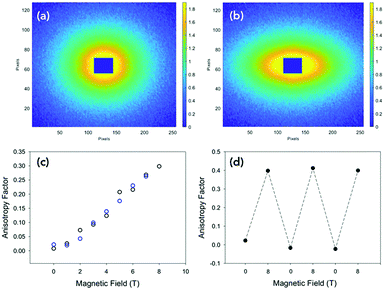
We examined the effect of alignment on the self-assembled structures using SANS. An 8 T superconducting magnet was used to align the structures perpendicular to the neutron beam at various field strengths. Solutions at concentrations of 10 mg mL−1, 30 mg mL−1 and 50 mg mL−1 were placed inside the cryomagnet in the neutron beam, and the magnetic field was increased from 0 T to 8 T over 40 minutes, and held 8 T for an hour at room temperature. The field strength was then decreased to 0 T and the scattering again monitored for about an hour. The degree of alignment could be monitored from the scattering data. A sample which shows little or no alignment has a circularly symmetric scattering pattern (Fig. 2a). The more anisotropic the sample, the more the scattering pattern is elongated in one direction (Fig. 2b and Fig. S7–S9, ESI†). To quantitatively parameterise the degree of alignment, we extracted the anisotropy of the scattering pattern. Comparing the horizontal (I‖H, parallel to field direction H) and vertical sector (I⊥H) averages, we determined an anisotropy parameter A(q) as a function of the scattering vector for a given field with:
The value of A(q) ranges from zero for isotropic scattering, up to a value of one for scattering that is directed only along the field direction (e.g. for the extreme case of a slender body with the long axis oriented in the scattering plane and perpendicular to the horizontal field axis). In all samples, the degree of alignment increased proportionally to the field strength (Fig. 2c and Fig. S10, ESI†). When held at 8 T, there was no change to the degree of alignment or the sample structure over time.
The data show that the more concentrated the sample the more alignment is achieved, with 10 mg mL−1 samples being less aligned at 8 T than the 50 mg mL−1 solutions and 30 mg mL−1 being between the two, agreeing with the 23Na NMR data (Fig. 1c). This could be due to the structures being more crowded at the higher concentrations and so physically forcing a coherent movement, making them more structured. When the magnetic field was lowered, the alignment decreased again proportionally, although there was a slight hysteresis in the dealignment with increasing concentration of PBI-A in solution. Again, this is due to an increased amount of material in the 2 mm cuvette and so the movement and so dealignment is restricted. The field could be cycled many times with no change in the alignment or the time to align or lose alignment (see Fig. 2(d)). Additionally, the scattering at 0 T was identical after each cycle (Fig. S11, ESI†). These data show that the magnetic field must be maintained whilst the samples dry in order to fix the alignment. This agrees with our previous work using shear alignment,19 where once the shear was stopped the samples became isotropic again within a second.
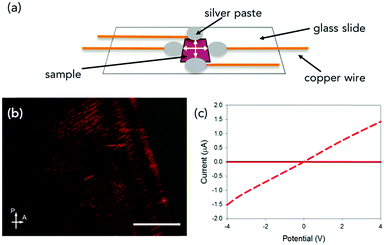
Since we wish to prepare dry films, we aligned solutions of PBI-A in a magnetic field of 9.4 T, and the samples were allowed to dry under the field. This method allows the alignment of the fibres whilst the water evaporates. These experiments were performed by placing 20 μL of solution onto a glass cover slip, then lowering into an NMR spectrometer and allowing the sample to dry overnight in the magnetic field. This method is discussed in more detail in Fig. S3 (ESI†). Fig. 3b and Fig. S12 (ESI†) show optical microscope images of the samples prepared in this manner under cross-polarised (CP) light.
This approach is extremely effective and results in a high degree of alignment of the sample (Fig. S12a–c, ESI†). At a concentration of 50 mg mL−1, liquid crystalline-like texture appears at the edge of the sample (Fig. S12d, ESI†) agreeing with data shown in Fig. 1c. SEM images of samples dried under a magnetic field also showed this alignment (Fig S13c and d, ESI†) compared to samples not dried in the field (Fig. S13a and b, ESI†). Samples dried out of the field show a more random orientation of the worm-like fibres, whereas sample dried under the field show a more aligned arrangement.
Conductivity measurements were performed perpendicular (at 90° with respect to aligned structures) and parallel to the alignment (Fig. 3a and Fig. S2, ESI†).19 As mentioned above, the PBI-A forms photoconductive structures. In the dark, the conductivity is very low, but irradiation with a 365 nm LED results in the formation of the radical anion and increased conductivity.12 All samples showed a directional dependence. In order to compare between samples, we calculated a directional dependence value. This was done by dividing the value obtained at 4 V against the alignment by the value for the same sample at 4 V with the alignment. Hence, the smaller the value, the more directionally dependent the sample. For a solution at 30 mg mL−1 (Fig. 3c and Fig. S14c, ESI†), there is a significant directional dependence with a value of 0.06, with measurements against alignment being comparable to that of measurements performed in the dark. The samples gave similar directional dependence values of between 0.25–0.28 at 5 mg mL−1 (Fig. S14a, ESI†), 10 mg mL−1 (Fig. S14b, ESI†) and 50 mg mL−1 (Fig. S14d, ESI†). This method therefore results in films which have a higher directional dependence value than the coffee-ring samples (not dried in a magnetic field) we have previously reported using shear alignment (typical direction dependence values of 0.35).19
Unfortunately, this method of alignment was not always reproducible. Some samples would show no alignment (Fig. S15a, ESI†) or lower alignment (Fig. S15b, ESI†). This directly translated into films with a lower degree of directionally dependent photoresponse (Fig. S15c, ESI†) compared to the highly aligned samples (Fig. S15d, ESI†). There was also variability in absolute values of the photocurrent. This irreproducibility could be due to a number of variables. The strength of the magnet field could be one factor as the strength varied inside the spectrometer. The temperature and humidity of the air around the sample could not be controlled. So, the rate of evaporation could vary, which would be expected to affect the alignment of the material.
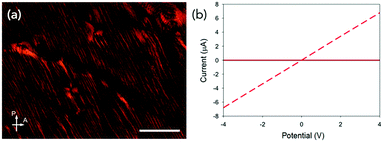
To better control the magnetic field strength, temperature and humidity, we moved to using an MRI scanner with a magnetic field strength of 9.4 T. Using the MRI machine, we were able to use the temperature and humidity-controlled room in which it was situated. The strength and the exact direction of the field are also accurately known (Fig. S16, ESI†) and larger samples can also be prepared. After drying in the MRI scanner, the samples showed highly aligned structures by both SEM and CP microscopy (Fig. 4a and Fig. S17a, ESI†). Aligned samples in the MRI scanner were reproducible; this is thought to be due to the controlled temperature and so drying rate of the samples, (Fig. 4b and Fig. S17b, S18, ESI†) giving directional dependent photoconductivity in the dried films of between 0.03 and 0.06 for all samples. Samples aligned under the MRI conditions also had higher currents than those prepared in the NMR spectrometer.
To conclude, self-assembled structures formed from PBI-A could be aligned under a magnetic field, with the degree of alignment increasing proportionally to the field strength. When the magnetic field is removed, the samples quickly return to being isotropic, but the structures are not damaged or affected by the presence the field. The degree of alignment is affected by the concentration of material in solution, with more concentrated samples needing a lower magnetic field to give the same amount of alignment. Changing the concentration of the PBIs could be a method of reducing the need for the strong magnet. If dried in the field, the alignment was maintained. This alignment allowed us to prepare reproducible directionally-dependent photoconductive films. The reproducibility of these films depended on the conditions the samples dried in, and a controlled temperature and humidity and fixed direction of magnetic fields gave the most reproducibility and best photocurrent from the samples. This method allows the preparation of highly reproducible photoconductive films from an organic semi-conductor. Currently a large field is required to achieve maximum alignment in these samples. However, it is not known how much alignment is needed to create the directional dependence and this is a subject of further investigation. We envisage that this approach will be generic to a range of self-assembled structures and allow flexible electronics to be prepared from such organic materials.
ERD thanks the Leverhulme Trust for an Early Career Fellowship (ECF-2017-223) and the University of Glasgow for LKAS award. MW thanks The Royal Commission for the Exhibition of 1851 for a Research Fellowship. DJA thanks the EPRSC for a Fellowship (EP/L021978/1). We thank Dr Arthur Taylor from the University of Liverpool (UoL) in the Centre for Preclinical Imaging with access to the MRI and Dr Jon Iggo from the UoL for letting us take his NMR machine apart. The MRI has been funded by a MRC grant (MR/L012707/1). The SANS experiment was conducted on D33 at the ILL, Grenoble, France with the experiment number 9-10-1523 (DOI: 10.5291/ILL-DATA.9-10-1523) and we thank Dr Ralf Schweins with all his help and useful discussions with regards to this experiment.
Conflicts of interest
There are no conflicts to declare.Notes and references
- Y. Liu, M. Pharr and G. A. Salvatore, ACS Nano, 2017, 11, 9614–9635 CrossRef PubMed.
- F. Yi, H. Ren, J. Shan, X. Sun, D. Wei and Z. Liu, Chem. Soc. Rev., 2018, 47, 3152 RSC.
- P. Kassanos, S. Anastasova, C. M. Chen and G.-Z. Yang, in Implantable Sensors and Systems: From Theory to Practice, ed. G.-Z. Yang, Springer International Publishing, Cham, 2018, pp. 197–279 Search PubMed.
- D. P. Dubal, N. R. Chodankar, D.-H. Kim and P. Gomez-Romero, Chem. Soc. Rev., 2018, 47, 2065–2129 RSC.
- J. Li, L. Geng, G. Wang, H. Chu and H. Wei, Chem. Mater., 2017, 29, 8932–8952 CrossRef.
- J. Zhao, Z. Chi, Z. Yang, X. Chen, M. S. Arnold, Y. Zhang, J. Xu, Z. Chi and M. P. Aldred, Nanoscale, 2018, 10, 5764–5792 RSC.
- M. G. Mohammed and R. Kramer, Adv. Mater., 2017, 29, 1604965 CrossRef PubMed.
- W. M. P. Jr. and D. J. Luca, J. Appl. Phys., 1980, 51, 5170–5174 CrossRef.
- L. Jin, C. Bower and O. Zhou, Appl. Phys. Lett., 1998, 73, 1197–1199 CrossRef.
- D. B. Hall, P. Underhill and J. M. Torkelson, Polym. Eng. Sci., 1998, 38, 2039–2045 CrossRef.
- D. Görl, X. Zhang and F. Würthner, Angew. Chem., Int. Ed., 2012, 51, 6328–6348 CrossRef PubMed.
- E. R. Draper, J. J. Walsh, T. O. McDonald, M. A. Zwijnenburg, P. J. Cameron, A. J. Cowan and D. J. Adams, J. Mater. Chem. C, 2014, 2, 5570–5575 RSC.
- C. Li and H. Wonneberger, Adv. Mater., 2012, 24, 613–636 CrossRef PubMed.
- S. Chen, P. Slattum, C. Wang and L. Zang, Chem. Rev., 2015, 115, 11967–11998 CrossRef PubMed.
- D. Dasgupta, A. M. Kendhale, M. G. Debije, J. t. Schiphorst, I. K. Shishmanova, G. Portale and A. P. H. J. Schenning, ChemistryOpen, 2014, 3, 138–141 CrossRef PubMed.
- A. Laiho, B. M. Smarsly, C. F. J. Faul and O. Ikkala, Adv. Funct. Mater., 2008, 18, 1890–1897 CrossRef.
- T. A. Everett and D. A. Higgins, Langmuir, 2009, 25, 13045–13051 CrossRef PubMed.
- E. R. Draper, L. J. Archibald, M. C. Nolan, R. Schweins, M. A. Zwijnenburg, S. Sproules and D. J. Adams, Chem. – Eur. J., 2018, 24, 4006–4010 CrossRef PubMed.
- E. R. Draper, O. O. Mykhaylyk and D. J. Adams, Chem. Commun., 2016, 52, 6934–6937 RSC.
- E. R. Draper, B. Dietrich and D. J. Adams, Chem. Commun., 2017, 53, 1864–1867 RSC.
- M. Wallace, A. Z. Cardoso, W. J. Frith, J. A. Iggo and D. J. Adams, Chem. – Eur. J., 2014, 20, 16484–16487 CrossRef PubMed.
- A. Delville, J. Grandjean and P. Laszlo, J. Phys. Chem., 1991, 95, 1383–1392 CrossRef.
- S. W. Tam-Chang, I. K. Iverson and J. Helbley, Langmuir, 2004, 20, 342–347 CrossRef PubMed.
- M. Wallace, J. A. Iggo and D. J. Adams, Soft Matter, 2017, 13, 1716–1727 RSC.
- M. Wallace, J. A. Iggo and D. J. Adams, Soft Matter, 2015, 11, 7739–7747 RSC.
- J. Billaud, F. Bouville, T. Magrini, C. Villevieille and A. R. Studart, Nat. Energy, 2016, 1, 16097 CrossRef.
- S. Noor and D. W. P. M. Löwik, in Self-assembling Biomaterials, ed. R. M. P. D. Silva, Woodhead Publishing, 2018, pp. 321–340 Search PubMed.
- D. W. P. M. Lowik, I. O. Shklyarevskiy, L. Ruizendaal, P. C. M. Christianen, J. C. Maan and J. C. M. van Hest, Adv. Mater., 2007, 19, 1191–1195 CrossRef.
- J. J. Walsh, J. R. Lee, E. R. Draper, S. M. King, F. Jäckel, M. A. Zwijnenburg, D. J. Adams and A. J. Cowan, J. Phys. Chem. C, 2016, 120, 18479–18486 CrossRef.
Footnote |
| † Electronic supplementary information (ESI) available: Supplementary figures, experimental procedures. See DOI: 10.1039/c8cc05968c |
| This journal is © The Royal Society of Chemistry 2018 |


