 Open Access Article
Quantification of the liquid window of deep eutectic solvents†
Laura J. B. M.
Kollau
 a,
Mark
Vis
 *a,
Adriaan
van den Bruinhorst
 a,
A. Catarina C.
Esteves
 a and
Remco
Tuinier
 ab
ab
aLaboratory of Physical Chemistry, Department of Chemical Engineering and Chemistry & Institute for Complex Molecular Systems, Eindhoven University of Technology, The Netherlands. E-mail: m.vis@tue.nl
bVan’t Hoff Laboratory for Physical and Colloid Chemistry, Debye Institute for Nanomaterials Science, Utrecht University, The Netherlands
First published on 12th November 2018
Abstract
Deep eutectic solvents (DESs) have been considered as a new class of green solvents with tunable physical properties based on the selective combination of their individual components. As the liquid window of a DES identifies the range of feasible applications, it is essential to determine, quantify, and predict their phase behavior. Phase diagrams were measured for systems consisting of tetrapentylammonium bromide and erythritol or succinic acid. Regular solution theory is applied to quantitatively describe the liquid window of DESs. The succinic acid mixture shows a larger deviation from ideal behavior, caused by the stronger hydrogen bond forming acid groups. The interaction parameter between the two DES components in regular solution theory could be determined directly from the eutectic temperature of the mixture and this enables quantification of the degree of non-ideality of DESs.
DESs have gained interest as a new class of solvents due to their compliance with green chemistry principles,1 such as atom economy,2 and safer solvents and chemicals.3,4 Being considered as designer solvents, hypothetically all the physical properties of DESs can be tailored by choosing the right combination of components. However, the fundamentals of the stable liquids of these systems have yet gained limited attention, while for the applications of DESs, these are of great importance. Quantifying the non-ideality of DESs could provide guidelines for designing the desired properties based on the features of the individual components. Although a wide range of liquid properties of DESs have been investigated by now, phase behavior studies reported in the literature remain scarce.28 Binary phase diagrams enable the mapping of the stable liquid window, which identifies where applications could be feasible.
For an ideal mixture at a given temperature, the solubility of any solute in a solvent depends on the enthalpy of fusion and the melting point of the solute.5–7 A solute in an ideal solution lowers the chemical potential of the solvent, resulting in a decrease of the melting point of that mixture. Such melting point depressions are often described using phase diagrams. Examples of systems, which are accurately described by ideal solution theory for all compositions, are binary mixtures of bibenzyl–biphenyl,8 carbon tetrachloride–benzene9 as well as certain fatty acid mixtures.10 At the solid–liquid (S–L) binodal, equilibrium thermodynamics dictates that the chemical potential μis of component i in the solid phase equals the chemical potential in the liquid phase, μis = μli. It follows that the chemical potential difference Δμi(xi) = μli(xi) − μi* of component i in the liquid mixture (μli) and in the pure liquid (μi*) is related to the melting enthalpy ΔHi, melting point Ti* of the individual component, and melting point of the mixture T:
 | (1) |
 | (2) |
 | (3) |
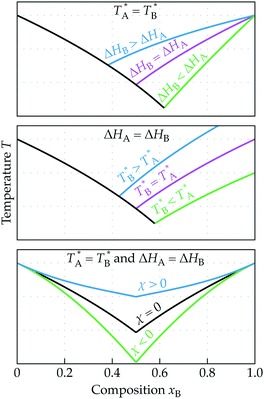
In Fig. 1 the predicted trends of the eutectic phase behavior are sketched. In the top panel, the influence of the different enthalpies of fusion for the two components A and B is illustrated, while the middle panel depicts the effect of the melting point Ti* of the individual components. The lower panel highlights the effect of the interaction parameter χ on the phase behavior. The position where the two binodal curves meet is the eutectic point with the corresponding eutectic temperature (Teut) and eutectic composition (xeut). From eqn (1), it follows that for an ideal mixture (χ = 0), the melting point depression depends solely on the thermodynamic properties of the individual components (melting point and enthalpy of fusion) and on the composition xi.5
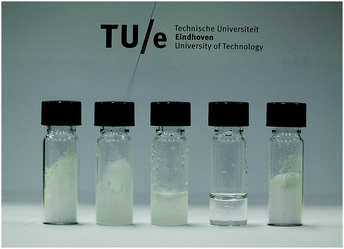
At the beginning of this century, Abbott et al.12 reported that mixtures of urea and choline chloride exhibit a rather spectacular melting point depression. Such a significant temperature drop can be achieved only, as shown in Fig. 1, by strong attractive interactions between the components of a eutectic mixture. The work of Abbott et al., and subsequent attention to similar mixtures, gave rise to the development of the new DES field that focuses on the properties and applications of binary eutectic mixtures in the stable binary liquid window of DESs.13,14Fig. 2 depicts a few examples of choline chloride and urea mixtures with different binary compositions at 303 K.
 | ||
| Fig. 2 Choline chloride–urea mixtures at 303 K. (Mole fraction urea from left to right: 0, 0.33, 0.5, 0.66, and 1). | ||
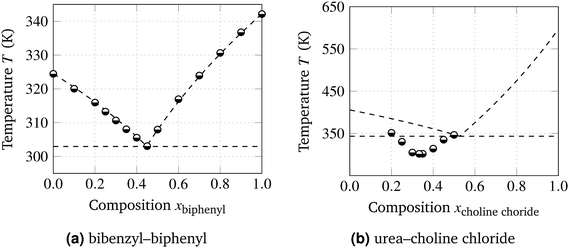
Fig. 3 shows binary phase diagrams, in which the predicted ideal (χ = 0) melting point depressions calculated using eqn (1) and (3) are compared to the experimentally determined melting points of the two literature examples of eutectic systems. The systems shown in Fig. 3 are biphenyl–bibenzyl,8 with quasi-ideal interactions between the components, and choline chloride–urea mixtures,15 with non-ideal interactions. Table 1 gives an overview of various thermodynamic properties of the considered components. A characteristic that is often assigned to DESs is the ability to form hydrogen bonds between the two components,12–20 of which the strength cannot be quantified straightforwardly. From Fig. 3a, it follows that eqn (3) using χ = 0 can accurately describe the eutectic composition, temperature, and S–L equilibrium for the biphenyl–bibenzyl system.
 | ||
| Fig. 3 Phase diagrams of binary mixtures from (semi-filled circles) experiments in literature8,15 compared to (dashed curves) theoretical predictions for ideal mixtures. Dashed horizontal line: predicted eutectic temperature. | ||
For the choline chloride–urea system, ideal behavior clearly does not provide a proper description of the phase boundaries, as illustrated by the comparison of the theoretical prediction and the experimental data shown in Fig. 3b. This deviation can be explained by the strong effective attractions between choline chloride and urea. It should be noted that, although this system is the first reported DES, the choline chloride–urea system is especially complicated to describe and map because choline chloride decomposes21 before melting, requiring estimates for T* and ΔH, and urea gradually evolves into ammonia near its melting point.23
The purpose of developing the DESs considered for this study was to illustrate the non-ideal behavior of well-defined DESs and to validate the RS theory to describe the DES phase behavior. We chose to develop new DESs rather than using previously published data to prevent the above mentioned challenges and to ensure that they possess specific requirements. Firstly, the DES components should not react with themselves or each other, e.g., combinations of carboxylic groups and alcohols which can react to esters were avoided.24 Secondly, the components should have well-defined melting points and enthalpies of fusion, rather than decomposing upon heating. Finally, the components should be able to crystallize sufficiently when cooled below the eutectic temperature avoiding supercooling, in order to obtain reproducible data. All these requirements are met with tetrapentylammonium bromide (TPABr), erythritol, and succinic acid, and therefore they can act as DES constituents for the systems TPABr–erythritol and TPABr–succinic acid. The large difference in the melting points of succinic acid and erythritol also enables us to validate the predicted effects of asymmetry in Ti*.
The melting points (S–L equilibrium curve) were measured using a capillary melting point apparatus. The DES compositions used were prepared inside a glove-box under a dry nitrogen atmosphere; the moisture levels were typically 1.5 ppm. The first partial melting of the mixture was considered as the solidus line (eutectic temperature), whereas the complete disappearance of solids was taken as the liquidus line (melting point). A full dissemination of our experimental procedures is given in the ESI.†
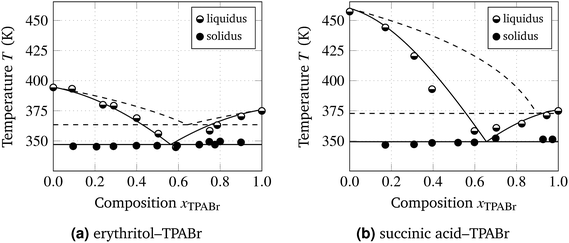
Fig. 4 shows the experimentally obtained phase diagrams (data points) of these new DESs, with liquidus binodals resulting from regular solution theory (curves), with χ computed from the measured eutectic temperature. As a reference, we also plotted the ideal result (χ = 0). It follows that RS theory can describe the S–L equilibria and the eutectic point of these DESs reasonably accurate with the use of only a single free parameter, the interaction parameter χ. The obtained value of this interaction parameter is of the order of the strength of hydrogen bonds (several times the thermal energy RT).
When fitting RS theory to the experimentally determined phase diagrams, we considered two options. We can fit and obtain the χ and xeut values based on the full measured S–L equilibrium (solidus and liquidus lines), or only on the measured eutectic temperature Teut (i.e., solidus line alone). Both scenarios were carried out for the two DESs and both methods yielded reasonably accurate descriptions of the phase diagrams. The obtained parameters as well as the standard deviation (σ) between the fit and the measured liquidus and solidus points are listed in Table 2. We can conclude from these results that we can reliably describe the full solid–liquid equilibrium based on a straightforward computation of the interaction parameter χ from eutectic temperature measurements.
| System | Fit | T eut (K) | x eut | χ | σ (K) |
|---|---|---|---|---|---|
| Erythritol–TPABr | Solidus + liquidus | 346.9 | 0.56 | −2.61 | 2.3 |
| Solidus | 347.0 | 0.56 | −2.59 | 2.3 | |
| Succinic acid–TPABr | Solidus + liquidus | 346.6 | 0.64 | −5.15 | 5.0 |
| Solidus | 349.3 | 0.64 | −4.68 | 5.5 | |
The obtained χ values suggest that there are strong attractions between the different molecules in these DESs and the attraction between TPABr and succinic acid is significantly stronger than that between TPABr and erythritol. This can be explained by comparing the molecular structures of both hydrogen bond donors; carboxylic acids are stronger in their ability to donate hydrogen bonds than alcohols.24 The presence and importance of hydrogen bonding interactions in DESs are often declared as their key characteristics.12–20 Here we show, however, that any strong attraction between the components in a binary mixture can greatly enhance the melting point depression. Indeed, the interaction parameter χ is not exclusively imposed by hydrogen bonding interactions.
Recently, a comparison between specific DESs and phase transition materials has been made for quasi-ideal hydrophobic DESs.19 For these systems (quasi) ideality is observed since there are no strong interactions between the components.25–27 It can, however, be questioned whether these ideal eutectic mixtures should be regarded as deep eutectic solvents.28 In our view, the designation, deep eutectic solvent, should only be used for systems showing melting points significantly below ideal predictions. In the framework of our model, this corresponds to an interaction parameter χ significantly below zero.
In conclusion, we have shown that we can describe the S–L phase behavior of two versatile DESs with regular solution theory, using a single interaction parameter. It follows that a stronger hydrogen bond donor results in a larger melting point depression and a lower eutectic temperature. The combination of the melting points, the enthalpies of fusion, and the strength of the attraction determines the location of the S–L equilibria and the eutectic temperature. Regular solution theory, to our knowledge, has not yet been applied to DESs. The main advantage of using this classical, simple theory is the fact that the interaction parameter χ is a single free parameter that characterizes the interaction, which can easily be rationalized and determined from straightforward measurements. The resulting χ parameters of various DESs provide insights into the properties of these liquids, by relating them to molecular interactions.
We would like to thank M. M. R. M. Hendrix for providing experimental support, Dr J. van Spronsen for useful discussions, and the members of the ISPT “Deep Eutectic Solvents in the pulp and paper industry” consortium for their financial and in kind contribution. This consortium consists of the following organisations: Altri – Celbi, Buckman, Crown Van Gelder, CTP, DS Smith Paper, ESKA, Essity, Holmen, ISPT, Mayr-Melnhof Eerbeek, Metsä Fibre, Mid Sweden University, Mondi, Omya, Parenco BV, The Navigator Company, Sappi, Smurfit Kappa, Stora Enso, Eindhoven University of Technology, University of Aveiro, University of Twente, UPM, Valmet Technologies Oy, Voith Paper, VTT Technical Research Centre of Finland Ltd, WEPA and Zellstoff Pöls. Furthermore, this project received funding from the Bio-Based Industries Joint Undertaking under the European Union's Horizon 2020 research and innovation programme under grant agreement Provides no. 668970. MV acknowledges the Netherlands Organisation for Scientific Research (NWO) for a Veni grant (no. 722.017.005). LK acknowledges Prof. Dr G. de With for useful discussions, and Floki and Feniks for support. RT thanks Prof. Dr A. Vrij for encouraging discussions on these solvents at an early stage.
Conflicts of interest
There are no conflicts to declare.References
- P. T. Anastas and J. C. Warner, Green Chemistry: Theory and Practice, Oxford University Press, New York, 1998, p. 30 Search PubMed.
- J. D. Mota-Morales, M. C. Gutiérrez, M. L. Ferrer, I. C. Sanchez, E. A. Elizalde-Peña, J. A. Pojman, F. D. Monte and G. Luna-Bárcenas, J. Polym. Sci., Part A: Polym. Chem., 2013, 51, 1767–1773 CrossRef CAS.
- H. G. Liao, Y. X. Jiang, Z. Y. Zhou, S. P. Chen and S. G. Sun, Angew. Chem., Int. Ed., 2008, 47, 9100–9103 CrossRef CAS PubMed.
- L. Gu, W. Huang, S. Tang, S. Tian and X. Zhang, Chem. Eng. J., 2015, 259, 647–652 CrossRef CAS.
- I. Schröder, Z. Phys. Chem., 1893, 11, 449–465 Search PubMed.
- E. W. Washburn and J. W. Read, PNAS, 1915, 1, 191–195 CrossRef CAS.
- H. A. J. Oonk and M. T. Calvet, Equilibrium between phases of matter: Phenomenology and Thermodynamics, Springer, Netherlands, Dordrecht, 1st edn, 2008, p. 404 Search PubMed.
- H. Lee and J. C. Warner, J. Am. Chem. Soc., 1935, 57, 318–321 CrossRef CAS.
- J. von Zawidzki, Z. Phys. Chem., 1900, 35, 129–203 CAS.
- K.-A. Eckert, S. Dasgupta, B. Selge and P. Ay, Thermochim. Acta, 2016, 630, 50–63 CrossRef CAS.
- J. H. Hildebrand and R. L. Scott, The Solubility of Non-Electrolytes, Rheinhold, New York, 3rd edn, 1949 Search PubMed.
- A. P. Abbott, G. Capper, D. L. Davies, R. K. Rasheed and V. Tambyrajah, Chem. Commun., 2003, 70–71 RSC.
- Q. Zhang, K. De Oliveira Vigier, S. Royer and F. Jérôme, Chem. Soc. Rev., 2012, 41, 7108 RSC.
- E. L. Smith, A. P. Abbott and K. S. Ryder, Chem. Rev., 2014, 114, 11060–11082 CrossRef CAS PubMed.
- X. Meng, K. Ballerat-Busserolles, P. Husson and J.-M. Andanson, New J. Chem., 2016, 40, 4492–4499 RSC.
- H. Sun, Y. Li, X. Wu and G. Li, J. Mol. Model., 2013, 19, 2433–2441 CrossRef CAS PubMed.
- O. S. Hammond, D. T. Bowron and K. J. Edler, Green Chem., 2016, 18, 2736–2744 RSC.
- O. S. Hammond, D. T. Bowron and K. J. Edler, Angew. Chem., Int. Ed., 2017, 56, 9782–9785 CrossRef CAS PubMed.
- C. Florindo, L. Romero, I. Rintoul, L. C. Branco and I. M. Marrucho, ACS Sustainable Chem. Eng., 2018, 63, 3888 CrossRef.
- L. Fernandez, L. P. Silva, M. A. Martins, O. Ferreira, J. Ortega, S. P. Pinho and J. A. Coutinho, Fluid Phase Equilib., 2017, 448, 9–14 CrossRef CAS.
- Handbook of Chemistry and Physics, ed. D. R. Lide, CRC Press, Boca Raton, 76th edn, 1995, ch. 3, pp. 3–152 Search PubMed.
- G. Y. Kabo, E. A. Miroshnichenko, M. L. Frenkel, A. A. Kozyro, V. V. Simirskii, A. P. Krasulin, V. P. Vorob’eva and Y. A. Lebedev, Russ. Chem. Bull., 1990, 39, 662–667 CrossRef.
- C. E. Redemann, F. C. Riesenfeld and F. S. La Viola, Ind. Eng. Chem., 1958, 50, 633–636 CrossRef CAS.
- J. McMurry, Organic Chemistry: A Biological Approach, Thomson, 2007 Search PubMed.
- E. Palomo del Barrio, R. Cadoret, J. Daranlot and F. Achchaq, Thermochim. Acta, 2015, 625, 9–19 CrossRef.
- G. Diarce, I. Gandarias, A. Campos-Celador, A. García-Romero and U. J. Griesser, Sol. Energy Mater. Sol. Cells, 2015, 134, 215–226 CrossRef CAS.
- G. Diarce, L. Quant, Á. Campos-Celador, J. M. M. Sala, A. García-Romero, A. Campos-Celador, J. M. M. Sala and A. García-Romero, Sol. Energy Mater. Sol. Cells, 2016, 157, 894–906 CrossRef CAS.
- M. A. R. Martins, S. P. Pinho and J. A. P. Coutinho, J. Solution Chem., 2018 DOI:10.1007/s10953-018-0793-1.
Footnote |
| † Electronic supplementary information (ESI) available. See DOI: 10.1039/c8cc05815f |
| This journal is © The Royal Society of Chemistry 2018 |


