
 Open Access Article
 This Open Access Article is licensed under a
 Creative Commons Attribution 3.0 Unported Licence
ESIPT-based ratiometric fluorescence probe for the intracellular imaging of peroxynitrite†
Luling
Wu‡
 a,
Yang
Wang‡
b,
Maria
Weber
a,
Liyuan
Liu
a,
Adam C.
Sedgwick
*a,
Steven D.
Bull
*a,
Chusen
Huang
*b and
Tony D.
James
*ac
a,
Yang
Wang‡
b,
Maria
Weber
a,
Liyuan
Liu
a,
Adam C.
Sedgwick
*a,
Steven D.
Bull
*a,
Chusen
Huang
*b and
Tony D.
James
*ac
aDepartment of Chemistry, University of Bath, Bath, BA2 7AY, UK. E-mail: t.d.james@bath.ac.uk; s.d.bull@bath.ac.uk; a.c.sedgwick@bath.ac.uk
bThe Education Ministry Key Laboratory of Resource Chemistry, Shanghai Key Laboratory of Rare Earth Functional Materials, and Shanghai Municipal Education Committee Key Laboratory of Molecular Imaging Probes and Sensors, Department of Chemistry, Shanghai Normal University, 100 Guilin Road, Shanghai 200234, China. E-mail: huangcs@shnu.edu.cn
cDepartment of Materials and Life Sciences, Faculty of Science and Technology, Sophia University, 7-1 Kioi-cho, Chiyoda-ku, Tokyo 102-8554, Japan
First published on 7th August 2018
Abstract
In this work, we set out to develop an endoplasmic reticulum (ER) directed ESIPT-based ONOO− ratiometric fluorescent probe (ABAH-LW). ABAH-LW was synthesized in four steps and found to have a high sensitivity and selectivity towards the detection of ONOO−. ABAH-LW was able to detect low concentrations of ONOO− (limit of detection = 21.4 nM) within seconds producing a ratiometric change in fluorescence intensity. ABAH-LW further demonstrated the ability to ratiometrically image endogenous and exogenous ONOO− in HeLa cells. Moreover, co-localization experiments were carried out using commercially available ER-Tracker Red, Lyso-Tracker Red and Mito-Tracker-Red, which were co-stained with ABAH-LW in HeLa cells. For ER-Tracker Red, Pearson's correlation co-efficient of 0.93 was determined and 3D surface plot analysis illustrated a large overlap between ABAH-LW and ER-Tracker Red using both red and blue channels. In addition some co-localisation with Mito-Tracker Red and ABAH-LW was observed (0.73).
The endoplasmic reticulum (ER) is a large membrane network that plays a central role in eukaryotic cells as a ‘protein-folding factory’ including being responsible for the synthesis, maturation and trafficking of a wide range of proteins.1,2 In addition, the ER is also an important site for calcium (Ca2+) storage and homeostasis.3 However, the ER is known to be sensitive to environmental and physiological changes such as inflammatory stimuli, change in Ca2+ levels, nutrient levels and increase in protein synthesis.2 These changes to the cellular environment result in an accumulation of unfolded or misfolded proteins, this accumulation is known as ER stress. To prevent the accumulation of unfolded or misfolded proteins, eukaryotic cells have developed an unfolded protein response (UPR). It is believed that both UPR and ER stress are involved in the pathology of several diseases including cancer, neurodegenerative diseases and atherosclerosis.
Peroxynitrite (ONOO−) is a highly reactive nitrogen species, which acts as a signaling molecule in vivo for a number of pathways.4,5 However, ONOO− is more commonly known for its deleterious effects, causing irreversible damage to a range of biological targets such as lipids, proteins and DNA.6 In addition, ONOO− has been shown to induce ER stress by depleting ER Ca2+ levels and elevating cytosolic Ca2+ levels resulting in the promotion of apoptosis. Additionally, biomarkers of ER stress were found to co-localize with 3-nitrotyrosine–containing proteins (ONOO− indicator) within early atherosclerotic lesions, which suggests that ONOO− contributes to atherogenesis via ER stress.7 Therefore, the development of powerful tools for the real-time detection of ONOO− at the endoplasmic reticulum would further aid the understanding of the role of ONOO− in ER-related diseases.
Within our research, we are particularly interested in the development of small molecule fluorescent probes for the detection of biologically relevant analytes in vivo owing to their high sensitivity, selectivity, high spatial and temporal resolution.8–12 Currently, there are several targeted fluorescence probes for the detection of biologically relevant analytes. However, to the best of our knowledge, there are no ONOO− fluorescence probes that localize at the ER so we set out to develop an ER-targeting ONOO− fluorescence probe.13–16
Excited-state intramolecular proton transfer (ESIPT) fluorescence probes are emerging in the literature owing to several particularly attractive properties such as: a large Stokes shift (∼200 nm) and spectral sensitivity to the surrounding environment. More importantly, ESIPT enables ratiometric detection of its target analyte due to the emission of the enol and keto forms (Dual-emission) (Scheme S2, ESI†). The use of Ratiometric fluorescence probes are particularly valuable as they provide direct information about the concentration of the target analyte without the need for calibration.
We identified in the literature an ESIPT fluorophore 4-amino-2-(benzo[d]thiazol-2-yl)phenol fluorophore (ABAH).17–21 as an ideal scaffold for the development of an ER targeted ONOO− fluorescence probe ABAH-LW (Fig. 1).
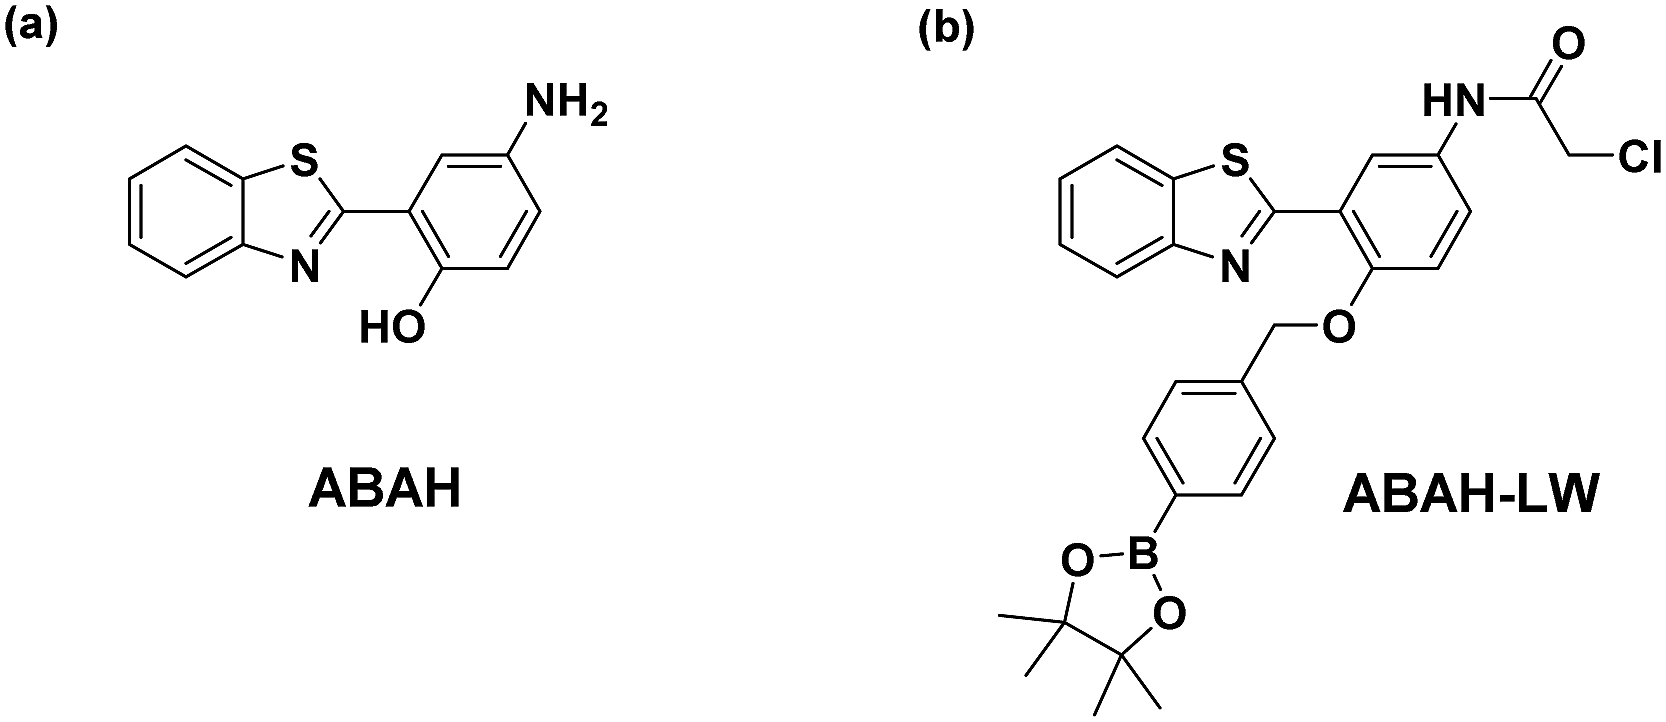 | ||
| Fig. 1 (a) ABAH ESIPT fluorophore previously used in the literature (b) this work – dual functionalised ABAH for the imaging of ONOO− at the ER. | ||
It was believed the attachment of the benzyl boronic ester to the phenol of ABAH would block the ESIPT process resulting in only enol emission being observed. Due to boronates/boronic acids having a greater reactivity towards ONOO− over HClO/ClO− (min) and H2O2 (hours), this unit would therefore allow the selective detection of ONOO−.8,10,11,22 Furthermore, the functionalization of the amino group of ABAH with a thiol-reactive chloroacetamide functional group enables the covalent attachment of ABAH-LW to biomacromolecules located at the ER enabling targeted visualization of the ER in the presence of ONOO−.23
ABAH-LW was synthesized over four steps. ABAH was first synthesized in excellent yield (73%) by heating 2-aminophenol and p-aminosalicylic acid in polyphosphoric acid (PPA) at 180 °C. With ABAH in hand, chloroacetylchloride was then added to a solution of ABAH in 1![[thin space (1/6-em)]](https://www.rsc.org/images/entities/char_2009.gif) :1 CHCl3/CH3CN. This reaction proceeded quickly to afford chloroacetamide intermediate compound 2. Compound 2 was then alkylated using (4-bromomethylphenyl)boronic acid and K2CO3 in DMF to afford ABAH-LW in 25% yield (Scheme S1, ESI†). Upon isolating ABAH-LW, we initially evaluated changes in the UV-vis spectrum of ABAH-LW with and without ONOO−. With the addition of ONOO− (8 μM), an increase in absorption was observed at 340 nm (see ESI†, Fig. S2). We then turned our attention towards the ability of ABAH-LW to detect ONOO− by fluorescence. It has been previously reported that the fluorescence emission of the ESIPT process can be affected by intermolecular hydrogen bonding.24 Therefore, for the fluorescence experiments of ABAH-LW with ONOO− the experiments were carried out in PBS buffer (pH 8.2, containing 8% DMSO, 1 mM CTAB) at room temperature.
:1 CHCl3/CH3CN. This reaction proceeded quickly to afford chloroacetamide intermediate compound 2. Compound 2 was then alkylated using (4-bromomethylphenyl)boronic acid and K2CO3 in DMF to afford ABAH-LW in 25% yield (Scheme S1, ESI†). Upon isolating ABAH-LW, we initially evaluated changes in the UV-vis spectrum of ABAH-LW with and without ONOO−. With the addition of ONOO− (8 μM), an increase in absorption was observed at 340 nm (see ESI†, Fig. S2). We then turned our attention towards the ability of ABAH-LW to detect ONOO− by fluorescence. It has been previously reported that the fluorescence emission of the ESIPT process can be affected by intermolecular hydrogen bonding.24 Therefore, for the fluorescence experiments of ABAH-LW with ONOO− the experiments were carried out in PBS buffer (pH 8.2, containing 8% DMSO, 1 mM CTAB) at room temperature.
As shown in Fig. 2, only the enol emission peak at 405 nm of ABAH-LW was observed, since the ESIPT process is blocked by the benzyl boronic ester. However, addition of ONOO− (0–10 μM), resulted in a ratiometric fluorescence intensity change, with a decrease in enol emission intensity at 405 nm and increase in keto emission intensity at 481 nm. The addition of ONOO− (9 μM) led to a significant 103-fold increase in ratiometric fluorescence intensity (F481/F405). The ONOO− deprotection and release of the ESIPT fluorophore was further confirmed using mass spectrometry (see ESI†, Fig. S1). In addition, the change in the fluorescence emission of the test solution was confirmed using a UV lamp (365 nm) a change from blue to bright green in colour was observed (Fig. 2, inset). ABAH-LW was shown to be very sensitive towards ONOO− with a detection limit of 21.4 nM.
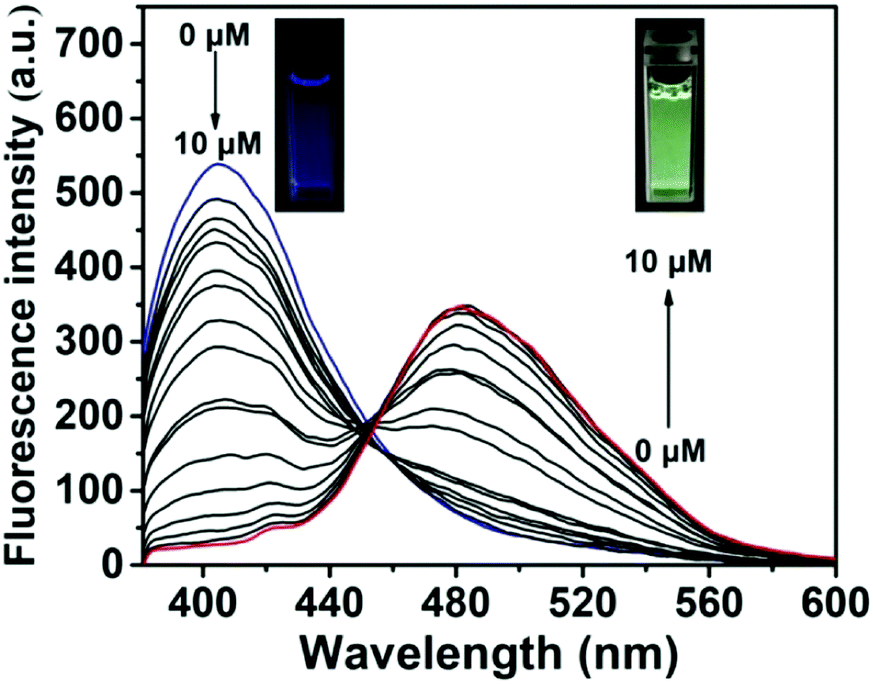 | ||
| Fig. 2 Changes in fluorescence emission of ABAH-LW (3 μM) with increasing addition of ONOO− (from 0 to 10 μM) in PBS buffer (pH 8.2, containing 8% DMSO, 1 mM CTAB) after 1 min. λex = 370 nm. Slit widths: ex = 5 nm, em = 6 nm. | ||
The selectivity of ABAH-LW towards other ROS and biologically relevant analytes was performed. As illustrated in Fig. 3, ABAH-LW exhibited excellent selectivity for ONOO− over other ROS including H2O2 and HClO/ClO−. Moreover, no change in fluorescence intensity was observed for the addition of various metal ions and amino acids. This excellent selectivity enabled us to evaluate ABAH-LW for cellular imaging in the detection of ONOO− and its ability to localize at the ER.
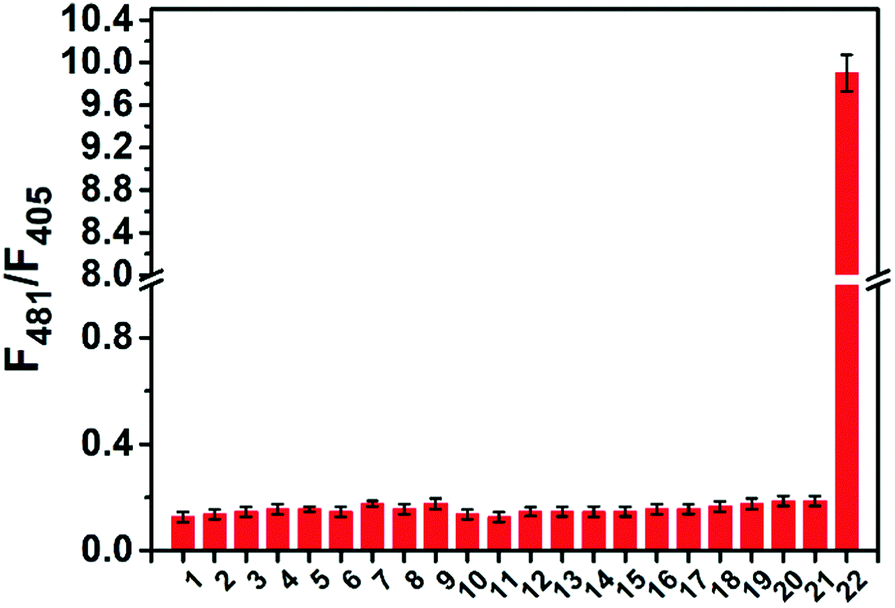 | ||
| Fig. 3 Fluorescence intensity ratio changes (based on the peak heights at the maxima, 405 and 481 nm respectively) with addition of ONOO− (8 μM) and other interfering reagents (100 μM). 1. probe only, 2. ClO−; 3. H2O2; 4. NO; 5. ˙OH; 6. ˙O2−; 7. 1O2; 8. H2S; 9. glucose; 10. GSH; 11. Cys; 12. Hcy; 13. Na+; 14. K+; 15. Ca2+; 16. Mg2+; 17. Zn2+; 18. Fe2+; 19. Al3+ 20. Cu2+; 21. Fe3+; 22. ONOO−. λex = 370 nm. Error bar represents s.d. Slit widths: ex = 5 nm, em = 6 nm. 40 min wait between measurements. | ||
ABAH-LW (50 μM) was incubated with HeLa cells and was cell permeable with only blue emission (Fig. 4a). As shown in Fig. 4b and c, the addition of SIN-125 (ONOO− donor) 0.5 and 1.2 mM led to a ratiometric change in fluorescence intensity. A concentration dependent change of fluorescence emission intensity with SIN-1 was observed. The exogenous addition of 1.2 mM (SIN-1) gave the largest ratiometric change with low blue emission fluorescence intensity being observed in channel 1 and high green emission intensity being observed in channel 2. The addition of the ONOO− scavenger ebselen (200 μM) led to no ratiometric change in fluorescence intensity with the addition of SIN-1 (1.2 mM) (Fig. 4d). This indicates the requirement of ONOO− to produce a ratiometric change in fluorescence intensity.
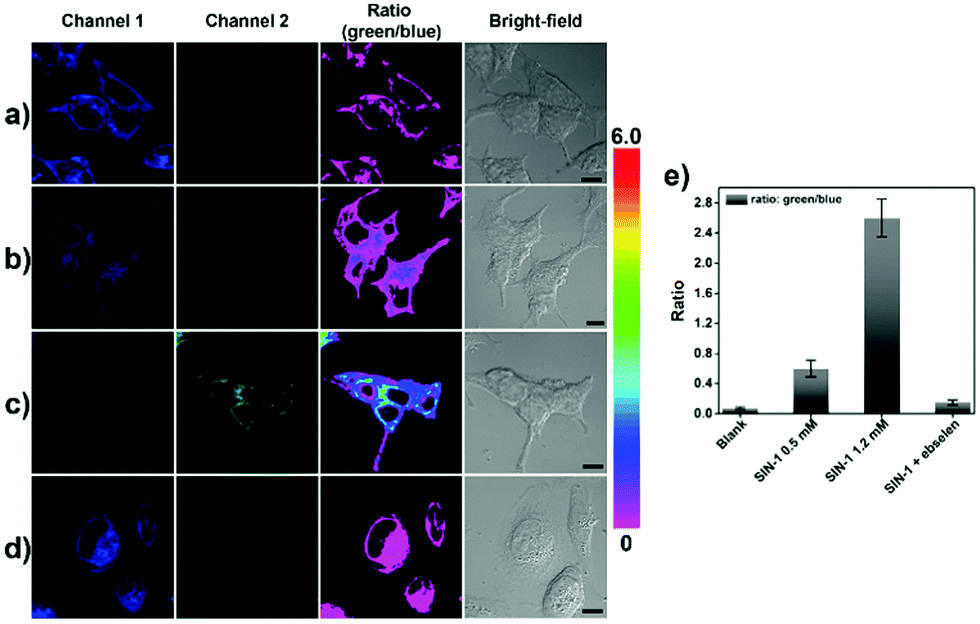 | ||
| Fig. 4 Confocal fluorescence imaging of ABAH-LW with exogenous addition of ONOO− donor (SIN-1) in HeLa cells. HeLa cells were incubated with ABAH-LW (50 μM) then (a) 0, (b) 0.5, (c) 1.2 mM SIN-1 and (d) 200 μM ebselen and 1.2 mM SIN-1. Channel 1 (blue, 410–460 nm); channel 2 (green, 480–550 nm). Ratio images generated from green/blue channel. (e) Average intensity ratios from ratio images of a–d. λex = 405 nm, scale bar: 10 μm. | ||
Lipopolysaccharide (LPS) and Interferon-γ (IFN-γ) was then used to produce endogenous ONOO− by stimulating the production of ROS/RNS in HeLa cells. As displayed in Fig. 5, a large ratiometric change in fluorescence intensity was observed. Ebselen was then added in the presence of LPS and IFN-γ and as expected no change in fluorescence was observed (Fig. 5c).
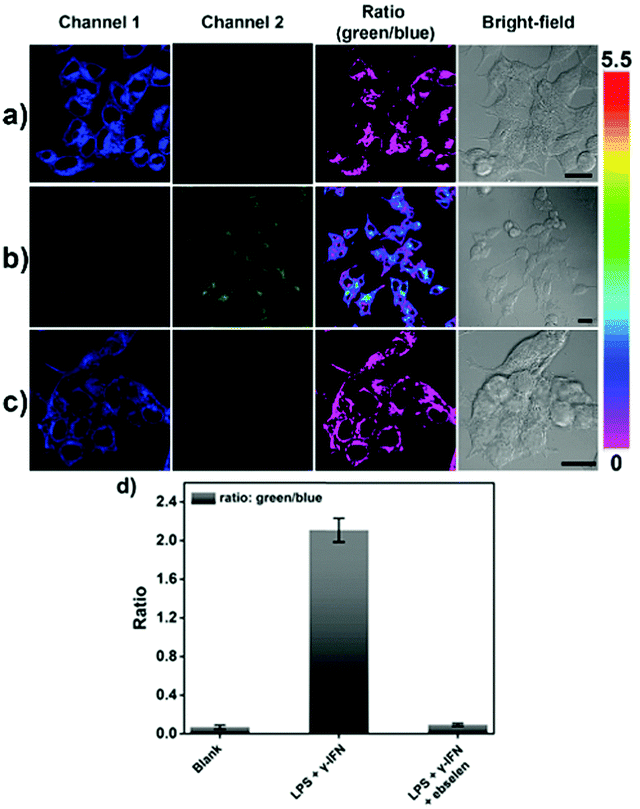 | ||
| Fig. 5 Fluorescence imaging of peroxynitrite in HeLa cells treated with (a) no, (b) 1.2 μg mL−1 LPS 16 h, 70 ng mL−1 IFN-γ 4 h, (c) LPS, IFN-γ+ 150 μM ebselen. (d) Average intensity ratios from ratio images of a–c. The cells were stained with 50 μM ABAH-LW (50 μM) for 30 min and washed with DPBS and imaged by confocal microscopy. Channel 1 (blue, 410–460 nm); channel 2 (green, 480–550 nm). λex = 405 nm, scale bar: 20 μm. | ||
To determine the sub-cellular distribution of ABAH-LW at the ER, co-localization experiments were performed. Commercially available ER-Tracker Red, Lyso-Tracker Red and Mito-Tracker Red were co-stained with ABAH-LW in HeLa cells (Fig. 6a, b and Fig. S6–S8, ESI†). The Pearson's correlation coefficient with ER-Tracker Red was determined as 0.93. In comparison, the Pearson's correlation coefficient was determined as 0.43 and 0.73 with Lyso-Tracker Red and Mito-Tracker Red respectively therefore indicating the selectivity of ABAH-LW for the localization at the ER. Furthermore, the linear region of interest (ROI) indicated by the white line (Fig. 6) shows significant overlap between the fluorescence intensities of ABAH-LW and ER-Tracker Red over the set distance (Fig. 6d). Moreover, the 3D surface plot analysis qualitatively demonstrates the co-localization of ER-Tracker Red and ABAH-LW since both have an increased intensity in the ROI (Fig. 6c, e, f). Therefore, ABAH-LW demonstrates greater selectivity for the labelling of the ER. However, co-localisation of Mito-Tracker Red and ABAH-LW was also observed (0.73), which is due to similar reactive thiol units being present at the mitochondria.26,27
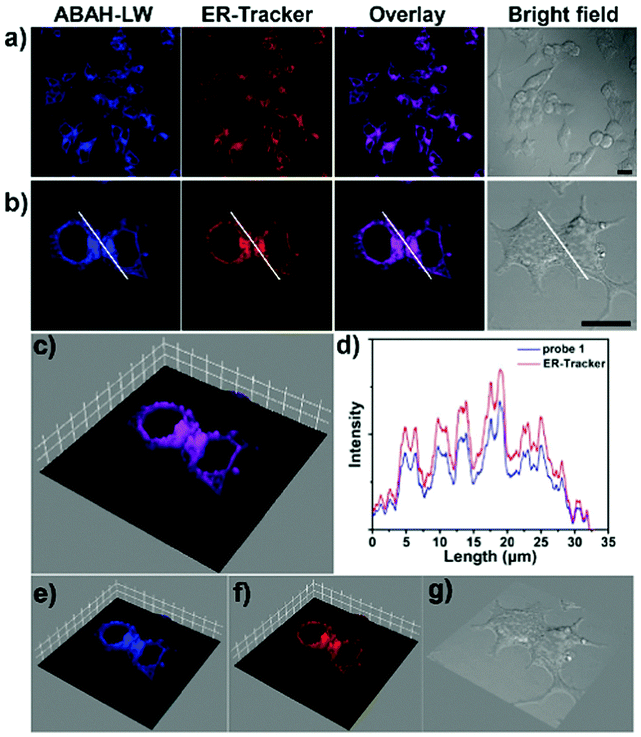 | ||
| Fig. 6 Endoplasmic reticulum-targeting properties of ABAH-LW in HeLa cells at 37 °C. (a and b) Colocalization images of HeLa cells stained with ER-Tracker Red (1 μM, red channel, λex = 568 nm, λem = 575–675 nm) and ABAH-LW (50 μM, blue channel, λex = 405 nm, λem = 410–460 nm) scale bar: 20 μm. (d) Intensity profiles within the ROI (regions of interest, white line in b) of ABAH-LW and ER-Tracker Red across HeLa cells. (c and e–g) 3D surface plot analyzing the colocalization images of ABAH-LW and ER-Tracker co-stained HeLa cells using interactive 3D surface plots in ImageJ software. | ||
An ESIPT-based ONOO− ratiometric fluorescence probe (ABAH-LW) was synthesized in four steps. ABAH-LW was found to have a high sensitivity and selectivity towards the detection of ONOO−. ABAH-LW was able to detect low concentrations of ONOO− (limit of detection = 21.4 nM) within seconds producing a ratiometric change in fluorescence intensity. ABAH-LW was able to ratiometrically image endogenous and exogenous ONOO− in HeLa cells. Co-localization experiments were carried out using ER-Tracker Red, which produced a Pearson's correlation co-efficient of 0.93 whereas values 0.43 and 0.73 were observed for Lyso-Tracker Red and Mito-Tracker Red. In summary ABAH-LW exhibits great promise as a tool for the intracellular imaging of ONOO− in cells. Since, ABAH-LW displays excellent selectivity for the ER (Pearson's correlation co-efficient of 0.93 with ER-Tracker Red). However, we are currently working on improving the targeting of ABAH-LW for the ER given that some targeting of mitochondria was observed (Pearson's correlation co-efficient of 0.73 with Mito-Tracker Red).
LW wishes to thank China Scholarship Council and the University of Bath for supporting his PhD work in the UK. We would like to thank the EPSRC and the University of Bath for funding. ACS thanks the EPSRC for a studentship. CH would like to thank the National Natural Science Foundation of China (Grants 21672150, and 213021125), Shanghai “Chenguang” Program (Grant 14CG42), and Program for Changjiang Scholars and Innovative (IRT_16R49). TDJ wishes to thank the Royal Society for a Wolfson Research Merit Award and Sophia University for a visiting professorship. NMR characterisation facilities were provided through the Chemical Characterisation and Analysis Facility (CCAF) at the University of Bath (http://www.bath.ac.uk/ccaf). The EPSRC UK National Mass Spectrometry Facility at Swansea University is thanked for analyses. All data supporting this study are provided as supplementary information accompanying this paper (ESI†).
Conflicts of interest
No conflicts of interest.Notes and references
- K. Z. Zhang and R. J. Kaufman, Nature, 2008, 454, 455–462 CrossRef PubMed.
- M. Wang and R. J. Kaufman, Nat. Rev. Cancer, 2014, 14, 581–597 CrossRef PubMed.
- K. Zhang and R. J. Kaufman, Nature, 2008, 454, 455 CrossRef PubMed.
- P. Pacher, J. S. Beckman and L. Liaudet, Physiol. Rev., 2007, 87, 315–424 CrossRef PubMed.
- S. Csaba, I. Harry and R. Rafael, Nat. Rev. Drug Discovery, 2007, 6, 662 CrossRef PubMed.
- P. Ascenzi, A. di Masi, C. Sciorati and E. Clementi, BioFactors, 2010, 36, 264–273 CrossRef PubMed.
- J. G. Dickhout, G. S. Hossain, L. M. Pozza, J. Zhou, S. Lhotak and R. C. Austin, Arterioscler., Thromb., Vasc. Biol., 2005, 25, 2623–2629 CrossRef PubMed.
- A. C. Sedgwick, H. H. Han, J. E. Gardiner, S. D. Bull, X. P. He and T. D. James, Chem. Commun., 2017, 53, 12822–12825 RSC.
- A. C. Sedgwick, R. S. L. Chapman, J. E. Gardiner, L. R. Peacock, G. Kim, J. Yoon, S. D. Bull and T. D. James, Chem. Commun., 2017, 53, 10441–10443 RSC.
- A. C. Sedgwick, H. H. Han, J. E. Gardiner, S. D. Bull, X. P. He and T. D. James, Chem. Sci., 2018, 9, 3672–3676 RSC.
- A. C. Sedgwick, X. L. Sun, G. Kim, J. Yoon, S. D. Bull and T. D. James, Chem. Commun., 2016, 52, 12350–12352 RSC.
- D. Wu, A. C. Sedgwick, T. Gunnlaugsson, E. U. Akkaya, J. Yoon and T. D. James, Chem. Soc. Rev., 2017, 46, 7105–7123 RSC.
- Y. H. Tang, A. Xu, Y. Y. Ma, G. P. Xu, S. Y. Gao and W. Y. Lin, Sci. Rep., 2017, 7 Search PubMed.
- H. B. Xiao, C. C. Wu, P. Li and T. G. Bo, Anal. Chem., 2018, 90, 6081–6088 CrossRef PubMed.
- H. B. Xiao, X. Liu, C. C. Wu, Y. H. Wu, P. Li, X. M. Guo and B. Tang, Biosens. Bioelectron., 2017, 91, 449–455 CrossRef PubMed.
- F. Ali, S. Sreedharan, A. H. Ashoka, H. K. Saeed, C. G. W. Smythe, J. A. Thomas and A. Das, Anal. Chem., 2017, 89, 12087–12093 CrossRef PubMed.
- K. S. Hwang, K. Y. Park, D. B. Kim and S.-K. Chang, Dyes Pigm., 2017, 147, 413–419 CrossRef.
- Y. Zhao, Y. Xue, H. Li, R. Zhu, Y. Ren, Q. Shi, S. Wang and W. Guo, Spectrochim. Acta, Part A, 2017, 175, 215–221 CrossRef PubMed.
- H. Yao and T. Funada, Chem. Commun., 2014, 50, 2748–2750 RSC.
- L. Cui, W. Zhu, Y. Xu and X. Qian, Anal. Chim. Acta, 2013, 786, 139–145 CrossRef PubMed.
- M. Santra, B. Roy and K. H. Ahn, Org. Lett., 2011, 13, 3422–3425 CrossRef PubMed.
- A. Sikora, J. Zielonka, M. Lopez, J. Joseph and B. Kalyanaraman, Free Radical Biol. Med., 2009, 47, 1401–1407 CrossRef PubMed.
- S. Arai, S. C. Lee, D. T. Zhai, M. Suzuki and Y. T. Chang, Sci. Rep., 2014, 4 Search PubMed.
- N. Sarkar, K. Das, S. Das, A. Datta, D. Nath and K. Bhattacharyya, J. Phys. Chem., 1995, 99, 17711–17714 CrossRef.
- F. J. Martin-Romero, Y. Gutierrez-Martin, F. Henao and C. Gutierrez-Merino, J. Fluoresc., 2004, 14, 17–23 CrossRef PubMed.
- A. D. Presley, K. M. Fuller and E. A. Arriaga, J. Chromatogr. B: Anal. Technol. Biomed. Life Sci., 2003, 793, 141–150 CrossRef.
- M. H. Lee, N. Park, C. Yi, J. H. Han, J. H. Hong, K. P. Kim, D. H. Kang, J. L. Sessler, C. Kang and J. S. Kim, J. Am. Chem. Soc., 2014, 136, 14136–14142 CrossRef PubMed.
Footnotes |
| † Electronic supplementary information (ESI) available. See DOI: 10.1039/c8cc04919j |
| ‡ Equal contributions. |
| This journal is © The Royal Society of Chemistry 2018 |