 Open Access Article
Photo-thermal reactions of ethanol over Ag/TiO2 catalysts. The role of silver plasmon resonance in the reaction kinetics†
M. A.
Nadeem
a and
H.
Idriss
 *ab
*ab
aCorporate Research & Development (CRD), Saudi Basic Industries Corporation (SABIC) KAUST, Thuwal 23955-6900, Saudi Arabia. E-mail: IdrissH@SABIC.com; NadeemMI@SABIC.com
bDepartment of Chemistry, University College, London, UK. E-mail: h.idriss@ucl.ac.uk
First published on 23rd April 2018
Abstract
Photo-thermal catalytic reactions of ethanol over Ag/TiO2 were conducted in order to probe into the role of plasmonic resonance response in the reaction kinetics. In the 300–500 K temperature domain the increase in reaction rate is found to be mainly due to changes in the activation energy while above this temperature range the increase was due to the pre-exponential factor. These results might be linked to the role of plasmonic Ag particles in polarising the reaction intermediates and therefore increasing the reaction products at temperatures up to about 500 K.
While elevated temperatures are not needed in photo-catalytic reactions because of their low activation energy recent reports indicate an enhancement in chemical reaction rates when both light and heat are used.1–5 To date, there has been a lack of understanding and probably consensus on how or even whether photo-excited electron transfer rates can be enhanced by thermal reactions over a semiconductor. Several explanations were provided depending on the type of the catalyst and reaction studied. For example, Upadhye and co-workers demonstrated that localized surface plasmon resonance (LSPR) increases the reverse water gas shift (RWGS) reaction rate (CO2 + H2 → H2O + CO) on Au catalysts.1 Photons to chemical efficiency of about 5% was found. The authors proposed that LSPR changes the intrinsic reaction kinetics on the catalyst surface via either the “hot” electron generation mechanism or the LSPR mediated adsorbate polarization mechanism. Tan and co-workers observed that, despite being a weak thermal ethanol oxidation catalyst, Au/TiO2 displayed considerable increases in its catalytic performance upon excitation with visible and UV light.2 The enhancement under UV illumination was attributed to the congruent roles of photo- and thermal-catalysis, while that under visible light illumination was due to plasmon-mediated electron charge transfer from Au particles to the TiO2 support (the so-called “hot” electrons). Kennedy and co-workers investigated the photo-thermal catalytic oxidation of ethanol over non-plasmonic catalysts: TiO2 and 1 wt% Pt/TiO2. The photo-thermal enhancement of CO2 production (70% at 100 °C) appeared to be caused primarily by increased levels of acetaldehyde produced by photo-oxidation over TiO2 and its subsequent migration to Pt metal leading to CO2 production by the thermal reaction.3 Chanmanee and co-workers studied alkane reverse combustion under photo-thermal conditions.4 They observed an increase in productivity of liquid hydrocarbons with temperature but with a very weak incident photon quantum yield (IPQY) of 0.02–0.05% on a per electron stored basis. Hu and co-workers studied the temperature-induced visible light photocatalytic hydrogen production from water and methanol using black TiO2.5 They found an enhancement in the reaction rate that was attributed to visible light photo-catalysis due to the presence of Ti3+ states in TiO2. At elevated temperatures, the injection of electrons, into Ti3+ states, was proposed to be the reason behind the increase in the relative population of adsorbed methanol molecules in “vibrationally” excited states, which leads to improved reaction rates.
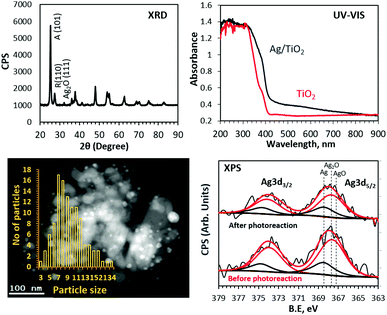
In this work, we have found that the ethanol photoreaction rate increases with increasing reaction temperature. The experiments were conducted in an UHV chamber with TiO2 and 3 wt% Ag/TiO2 (anatase-88% + rutile-12%) catalysts. Details of the experimental setup and procedure are provided in the ESI.† UV-Vis, XRD and XPS analyses of the 3 wt% Ag/TiO2 catalyst are presented in Fig. 1. In the case of the UV-Vis spectrum, relatively sharp absorption edges at 415 nm and 387 nm are consistent with the intrinsic band gap absorption of TiO2 rutile and anatase phases, respectively. The rise in the background in the visible region that extends into the UV region is attributed to the surface plasmon absorption of Ag particles.7,8 The XRD patterns show Ag2O (111) diffraction in addition to diffraction peaks at 25.3 and 27.5 due to TiO2 anatase (101) and rutile (110), respectively. The average crystallite sizes calculated using the Scherrer equation were 31, 44 and less than 10 nm (mean particle size) for anatase, rutile and Ag particles, respectively.
The chemical nature and atomic% of Ag in the near-surface region determined from XPS Ag 3d core-level peak areas are given in Fig. 1 and Table 1.
| Chemical | Core level | Peak position (eV) | FWHM (eV) | ΔE (eV) | At% | |
|---|---|---|---|---|---|---|
| Before | After | |||||
| Ag | Ag 3d5/2 | 368.4 | 2.5 | 6.1 | 0.36 | 0.36 |
| Ag 3d3/2 | 374.5 | 2.5 | 6.1 | |||
| Ag2O | Ag 3d5/2 | 367.7 | 3 | 6.0 | 1.2 | 0.94 |
| Ag 3d3/2 | 373.7 | 3 | 6.0 | |||
Both Ag metal and Ag+ were present as evidenced by the Ag 3d5/2 binding energy values of 368.4 and 367.7 eV.10,35,36 An increase in the Ag/Ag+ ratio is noticed and attributed to the in situ reduction of Ag+ during photoreaction. The XPS core levels of Ti and O were also collected and found to be consistent with typical TiO2 (not shown).10,11
Ethanol is dissociatively adsorbed on TiO2 at 300 K:
| CH3H2OH(s) + O(s)→ CH3CH2O(a) + OH(s) | (1) |
A fraction of ethanol starts to desorb at 310 K followed by a second desorption together with other products at ca. 500 K (Fig. 2). The desorption profiles are multiplied with their appropriate mass spectrometer correction factor to reflect the accurate amounts of products.12 The ethanol desorption profile (310–700 K) is de-convoluted into two peaks. The low temperature peak centred at 380 K is attributed to molecular and re-combinative desorption (of ethoxides with OH(a)) adsorbed on non-defective surfaces. The high temperature peak centred at about 540 K is attributed to re-combinative desorption of ethoxides on oxygen-defect sites.13
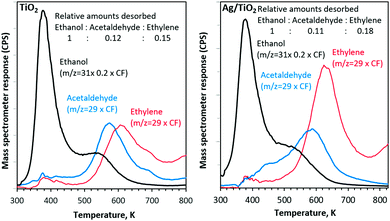 | ||
| Fig. 2 Ethanol–TPD of the main carbon containing products after adsorption at 300 K on TiO2 and Ag/TiO2 catalysts. CF stands for the mass spectrometer correction factor. | ||
With both catalysts, ethylene and acetaldehyde are the main products, desorbed with a combined carbon selectivity of ca. 30%.14
| CH3CH2O(a) + O(s) → CH3CHO + OH(s) (on 5-fold Ti atoms) | (2) |
| CH3CH2O(a) → CH2CH2(↑) + OH(a) (on oxygen defects) | (3) |
Ethylene selectivity is higher in the case of Ag/TiO2 than that of TiO2 alone. This is in contrast to our previous work on Au/TiO2. Earlier, we have noticed that ethylene is the dominant product desorbed from TiO2 followed by acetaldehyde but the ratios decreased with an increase in Au metal loading.12,15,16 Because Ag is far easier to oxidize than Au and because its work function is similar to that of TiO2, it may contribute to the C–O bond dissociation at its vicinity which in turn may increase the dehydration reaction of ethanol.
Photoreactions of ethanol on metal supported on TiO2 have been studied in some detail over the last decade and it has been found that ethanol is mainly converted to H2 and acetaldehyde. The latter further reacts to produce CO, CO2, and CH4.9,17 The photoreaction of ethanol on metal supported on TiO2 under UV radiation occurs via either a two photon–two electron mechanism10,11 or through a one photon–two electron transfer mechanism (the current doubling effect).18–20
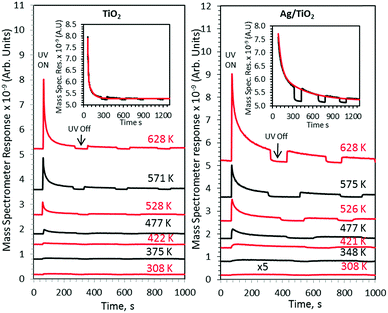
The effect of temperature on the ethanol photoreaction rate is presented in Fig. 3. Each line represents a separate run as explained in the Experimental section.
These sets of experiments were all done at the same initial surface coverage as indicated in the Experimental section and therefore one can directly relate the product desorption to catalytic activity. As shown in Fig. 4 other products were also observed. Concurrent hydrogen desorption is shown in Fig. S1 (ESI†). Because the UHV chamber pressure was ca. 5 × 10⁻¹⁰ Torr before the reaction, O2 and water background would be in the low 10−11 to high 10−12 Torr range. An increase in acetaldehyde desorption (Fig. 3), at all investigated temperatures, together with other products with increasing surface temperature gives evidence of a synergism between heat and radiation. All experiments were performed several times and were found to be reproducible. At all investigated temperatures Ag/TiO2 was more active than TiO2 alone. The wider peak in the case of Ag/TiO2 upon UV excitation, at all investigated temperatures, is linked to the presence of Ag, making more heterogeneous additional sites.
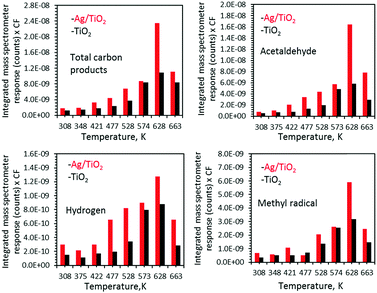 | ||
| Fig. 4 Ethanol photoreaction products over TiO2 and Ag/TiO2 upon UV radiation as a function of temperature. Surfaces were flashed to 628 K before each run to ensure constant coverage, and then cooled to the indicated temperature. The complete process of the correction factor (CF) and product yield calculation from the area under mass spectrometer response is explained in ref. 12. | ||
Fig. 4 presents the products desorbed from TiO2 and Ag/TiO2 catalysts upon UV radiation as a function of temperature. The total product yield increased with increasing temperature. The decrease at 663 K is due to the decrease in the initial surface coverage as seen in Fig. 2 and in ref. 15 and 16. Methyl radicals are also produced and follow acetaldehyde production patterns. This has been noticed earlier in acetone21 as well as acetaldehyde22 and proposed to involve the thermal reaction of acetaldehyde with adsorbed oxygen to form a photoactive acetaldehyde–oxygen complex.22 This is followed by a substrate mediated photodecomposition mechanism that induces the fragmentation of the acetaldehyde–oxygen complex into a gas phase methyl radical and surface adsorbed formates.22 In a recent work on TiO2(110) rutile single crystals we have found similar results (CH3 radical production from ethanol23). This was not the case for anatase (101) single crystals.24 TiO2 P25 used in this work contains both phases; it is possible that CH3 radical formation is predominantly linked to the rutile phase.
Fig. 5 presents the Arrhenius plots for ethanol reactions on TiO2 and Ag/TiO2. The activation energies extracted from the plots are indicated together with the pre-factors. There are a few points that are worth pointing out in the figure. First, both catalysts have a discontinuing reaction rate with temperature (at ca. 500 K = 0.002 K−1) and this is more pronounced in the case of TiO2. It is worth indicating that the reaction is purely a function of the incident photons at the indicated temperatures; in other words in the absence of photons no reaction takes place.
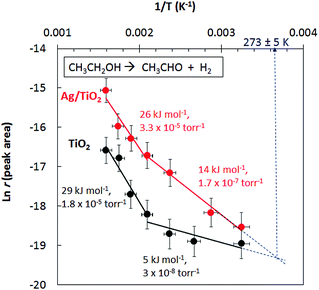 | ||
| Fig. 5 Ln reaction rate for acetaldehyde production from ethanol under photo-thermal conditions over TiO2 and Ag//TiO2 catalysts. | ||
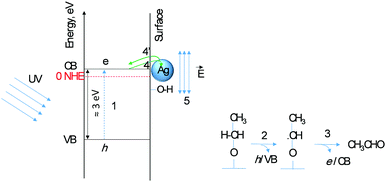
Second, the very low activation energy at low temperatures is typical of a photo-catalytic reaction. Yet the difference between TiO2 and Ag/TiO2 in the 300–500 K range is beyond experimental errors (5 to 14 kJ mol−1) resulting in a 4-fold increase in the reaction rate; the decrease in the pre-factor with decreasing activation is to be noted, a phenomenon known as the compensation effect.26 Third, extrapolation of the reaction rate to lower temperature shows a crossing at about 270 K. In other words, at this temperature the addition of Ag does not enhance the reaction rate. The addition of a metal to a semiconductor may enhance the photoreaction rate based on a work function difference (ΔWF).6,25 The work functions of Ag and TiO2 (anatase or rutile) are actually very close27,28 and therefore the difference in reaction rates may not be linked to ΔWF. Scheme 1 presents the initial steps of the reaction with two electrons injected into the semiconductor as follows. Upon light excitation followed by electron transfer from the VB to the CB (step 1), ethoxide species (step 2) inject one electron into the VB and are transformed to an oxy-radical. We have recently indicated using DFT+D computation that ethoxides are more prone to undergo this reaction than ethanol29 in line with others’ finding.30 These radicals have high energy and can directly inject the second electron into the CB31 (step 3), a phenomenon called the “current doubling effect”.18–20 These two electrons in the absence of molecular oxygen, as in this work, are taken by the two protons of surface hydroxyls to make one molecule of hydrogen. In the scheme a Ag particle is added close to the CB of TiO2. Ag absorbs light and as a result its free electrons oscillate generating the so-termed “plasmon resonance (PR)”. PR can increase the reaction rate of a semiconductor via either electronic or photonic effect.32 The photonic effect of PR is either long range (light scattering) or short range to increase the local electric field (step 5). Other studies have also given evidence for the enhancement of the reaction rates due to LSPR of Ag when deposited on semiconductors.33,34 Although at 300 K this enhancement is found to be small when compared to noble metals such as Pd.10 One would expect that the long-range effect would be independent of temperature, yet the short-range effect that results in a decrease of the e–h recombination may indeed increase the reaction rate if it provides enough electric field strength to change the conformation of an adsorbate in its transition state. The deviation between the reaction rates between Ag/TiO2 and TiO2 up to about 500 K (1/T = 0.002 K−1, Fig. 5) is explained by invoking this possibility. It is important to indicate that excitation with visible light alone (>400 nm) did not result in any noticeable reaction products, indicating that both TiO2 and Ag need to be excited.
In summary, the addition of Ag to TiO2 resulted in the enhancement of the photo-thermal catalytic reaction of ethanol when compared to TiO2 at all investigated temperatures but in two different temperature regimes. In the 300–500 K temperature range, the increase seems to be mainly due to changes in the activation energy while in the 500–625 K range, the activation energy is found to be the same for TiO2 and Ag/TiO2 and the main increase is due to the pre-factor. It is thus possible that the surface plasmon resonance (SPR) of Ag induces the polarisation of reaction intermediates involved in the oxidation and/or in the desorption of the final products at temperatures below 500 K. Above this temperature, there is enough thermal energy and Ag nanoparticles are not needed for their SPR.
Conflicts of interest
There are no conflicts to declare.Notes and references
- A. A. Upadhye, I. Ro, X. Zeng, H. J. Kim, I. Tejedor, M. A. Anderson, J. A. Dumesic and G. W. Huber, Catal. Sci. Technol., 2015, 5, 2590–2601 CAS.
- T. H. Tan, J. Scott, Y. H. Ng, R. A. Taylor, K.-F. Aguey-Zinsou and R. Amal, ACS Catalysis, 2016, 6, 1870–1879 Search PubMed.
- J. C. Kennedy Iii and A. K. Datye, J. Catal., 1998, 179, 375–389 CrossRef.
- W. Chanmanee, M. F. Islam, B. H. Dennis and F. M. MacDonnell, Proc. Natl. Acad. Sci. U. S. A., 2016, 113, 2579–2584 CrossRef CAS PubMed.
- Y. H. Hu, Angew. Chem., Int. Ed., 2012, 51, 12410–12412 CrossRef CAS PubMed.
- A. Furube, T. Asahi, H. Masuhara, H. Yamashita and M. Anpo, Chem. Phys. Lett., 2001, 336, 424–430 CrossRef CAS.
- J. He, I. Ichinose, T. Kunitake and A. Nakao, Langmuir, 2002, 18, 10005–10010 CrossRef CAS.
- J. He, I. Ichinose, T. Kunitake, A. Nakao, Y. Shiraishi and N. Toshima, J. Am. Chem. Soc., 2003, 125, 11034–11040 CrossRef CAS PubMed.
- M. A. Nadeem, M. Murdoch, G. I. N. Waterhouse, J. B. Metson, M. A. Keane, J. Llorca and H. Idriss, J. Photochem. Photobiol., A, 2010, 216, 250–255 CrossRef CAS.
- M. A. Nadeem, M. Al-Oufi, A. K. Wahab, D. Anjum and H. Idriss, ChemistrySelect, 2017, 2, 2754–2762 CrossRef CAS.
- I. Majeed, M. A. Nadeem, E. Hussain, G. I. N. Waterhouse, A. Badshah, A. Iqbal, M. A. Nadeem and H. Idriss, ChemCatChem, 2016, 8, 3146–3155 CrossRef CAS.
- M. A. Nadeem, I. Majeed, G. I. N. Waterhouse and H. Idriss, Catal., Struct. React., 2015, 1, 61–70 CrossRef.
- J. M. R. Muir, Y. Choi and H. Idriss, Phys. Chem. Chem. Phys., 2012, 14, 11910–11919 RSC.
- J. Cornejo-Romero, A. Solis-Garcia, S. M. Vega-Diaz and J. C. Fierro-Gonzalez, Mol. Catal., 2017, 433, 391–402 CrossRef CAS.
- A. M. Nadeem, G. I. N. Waterhouse and H. Idriss, Catal. Today, 2012, 182, 16–24 CrossRef CAS.
- M. A. Nadeem, G. I. N. Waterhouse and H. Idriss, Surf. Sci., 2016, 650, 40–50 CrossRef CAS.
- M. Murdoch, G. W. N. Waterhouse, M. A. Nadeem, M. A. Keane, R. F. Howe, J. Llorca and H. Idriss, Nat. Chem., 2011, 3, 489–492 CrossRef CAS PubMed.
- W. P. Gomes, T. Freund and S. R. Morrison, J. Electrochem. Soc., 1968, 115, 818–823 CrossRef CAS.
- O. Micic, Y. Zhang, K. R. Cromack, A. Trifunac and M. Thurnauer, J. Phys. Chem., 1993, 97, 13284–13288 CrossRef CAS.
- A. Yamakata, T.-a. Ishibashi and H. Onishi, J. Phys. Chem. B, 2002, 106, 9122–9125 CrossRef CAS.
- M. A. Henderson, J. Phys. Chem. B, 2005, 109, 12062–12070 CrossRef CAS PubMed.
- R. T. Zehr and M. A. Henderson, Surf. Sci., 2008, 602, 2238–2249 CrossRef CAS.
- G. Harrison, K. Katsiev, Y. AlSalik, G. Thornton and H. Idriss, J. Catal., 2018 DOI:10.1016/j.jcat.2018.04.015.
- K. Katsiev, G. Harrison, H. Alghamdi, Y. Alsalik, A. Wilson, G. Thornton and H. Idriss, J. Phys. Chem. C, 2017, 121, 2940–2950 CAS.
- L. Gamble, L. S. Jung and C. T. Campbell, Surf. Sci., 1996, 348, 1–16 CrossRef CAS.
- G. C. Bond, M. A. Keane, H. Kral and J. A. Lercher, Catal. Rev., 2000, 42, 323–383 CAS.
- G. Xiong, R. Shao, T. C. Droubay, A. G. Joly, K. M. Beck, S. A. Chambers and W. P. Hess, Adv. Funct. Mater., 2007, 17, 2133–2138 CrossRef CAS.
- Y. Wan, Y. Li, Q. Wang, K. Zhang and Y. Wu, Int. J. Electrochem. Sci., 2012, 7, 5204–5216 CAS.
- H. Alghamdi and H. Idriss, Surf. Sci., 2018, 669, 103–113 CrossRef CAS.
- C. Di Valentin and D. Fittipaldi, J. Phys. Lett., 2013, 4, 1901–1906 CAS.
- J. Ø. Hansen, R. Bebensee, U. Martinez, S. Porsgaard, E. Lira, Y. Wei, L. Lammich, Z. Li, H. Idriss, F. Besenbacher, B. Hammer and S. Wendt, Sci. Rep., 2016, 6, 21990 CrossRef CAS PubMed.
- M. A. Khan, L. Sinatra, M. Oufi, O. M. Bakr and H. Idriss, Catal. Lett., 2017, 147, 811–820 CrossRef CAS.
- B. Dudem, L. K. Bharat, J. W. Leem, D. H. Kim and J. S. Yu, ACS Sustainable Chem. Eng., 2018, 6, 1580–1591 CrossRef CAS.
- H. Yua, W. Liu, X. Wang and F. Wang, Appl. Catal., B, 2018, 225, 415–423 CrossRef.
- T. C. Kaspar, T. Droubay, S. A. Chambers and P. S. Bagus, J. Phys. Chem. C, 2010, 114, 21562–21571 CAS.
- J. F. Weaver and G. B. Hoflund, J. Phys. Chem., 1994, 98, 8519–8524 CrossRef CAS.
Footnote |
| † Electronic supplementary information (ESI) available. See DOI: 10.1039/c8cc01814f |
| This journal is © The Royal Society of Chemistry 2018 |

