
 Open Access Article
 This Open Access Article is licensed under a
 Creative Commons Attribution 3.0 Unported Licence
Anti-Stokes fluorescence microscopy using direct and indirect dark state formation†
Stefan
Krause
 *,
Miguel R.
Carro-Temboury
,
Cecilia
Cerretani
and
Tom
Vosch
*
*,
Miguel R.
Carro-Temboury
,
Cecilia
Cerretani
and
Tom
Vosch
*
Nanoscience Center and Department of Chemistry, University of Copenhagen, Universitetsparken 5, Copenhagen 2100, Denmark. E-mail: stefan.krause@chem.ku.dk; tom@chem.ku.dk
First published on 17th April 2018
Abstract
Measurements on biological samples are often hampered by auto-fluorescence from inherent compounds in tissue or cells, limiting the achievable contrast. Both the signal of interest and the auto-fluorescence are usually detected on the Stokes side of the excitation laser. In this communication, we present two new microscopy modalities, based on the emission of a red-emitting DNA-stabilized silver nanocluster (DNA-AgNC). Its bright fluorescence can be generated on the anti-Stokes side of the readout laser, allowing easy spectral separation of the signal of interest from the Stokes side auto-fluorescence.
Due to its sensitivity, fluorescence microscopy has enabled countless advances in material and life sciences.1,2 Even fluorescence from a single molecule can be detected, enabling localization microscopy and imaging beyond the diffraction limit.3 For in vivo and in vitro bio-imaging, good contrast and certainty over the origin of the collected photons are essential in addressing biological questions.4–8 Several approaches exist to increase the signal-to-background ratio. The most common approach is labeling with bright fluorophores in order to outshine the auto-fluorescence. Since the advent of single molecule spectroscopy,9 individual fluorophores are used in samples with increasingly higher background (e.g. in vivo tissue) which pushes the performance of existing bright fluorophores to the edge of their capabilities. Further increasing brightness can be accomplished by combining multiple absorbers, e.g. in polymeric light harvesting nanoparticles at a cost of increasing size.10 A second concept uses pulsed excitation sources and separates the auto-fluorescence from the signal of interest in time, leading to a time-gated signal with virtually no background.11 To achieve this, fluorophores with long excited-state lifetimes are needed, which have low optical transition probabilities and hence weak fluorescence signals.12 Common emitters used for this approach are organic dyes with long lifetimes or lanthanides.13,14 Other methods rely on modulating the signal of interest which enables sensitive lock-in detection/demodulation.15,16 A final approach is based on anti-Stokes emission that is realized in literature by multiphoton absorption, either by simultaneous two-photon excitation (TPE),17 or by two consecutive photon absorption in fluorescence upconversion particles (usually lanthanide-based).18,19 Although both methods have found many applications, we present in this study two new anti-Stokes imaging modalities using direct and indirect dark-state formation of DNA-AgNCs that require significantly less excitation power than TPE.20
The steady-state and time-resolved photophysical properties of the red-emitting DNA-AgNC used, have been described previously by Cerretani et al. (see also ESI†).21 It is known from literature that upon exciting DNA-AgNCs, the Franck–Condon state (FC) can evolve into a microsecond-lived dark state.15,22–26 Besides dark state formation, the FC state can either relax to the ground state (S0) or evolve to the emissive state (S1).27 All these initial processes are ultrafast and occur on a sub-picosecond timescale.27–29 Generally, the quantum yield of dark state formation (QD1) is in the order of a few percent, but values around 25% have been reported.22–25 According to literature and in compliance with the phenomenological electronic state diagram in Fig. 1A, the dark state (D1) can be optically depopulated by absorbing a photon from a secondary laser, which can bring the DNA-AgNC to the emissive state, as was recently demonstrated by Fleicher et al.30
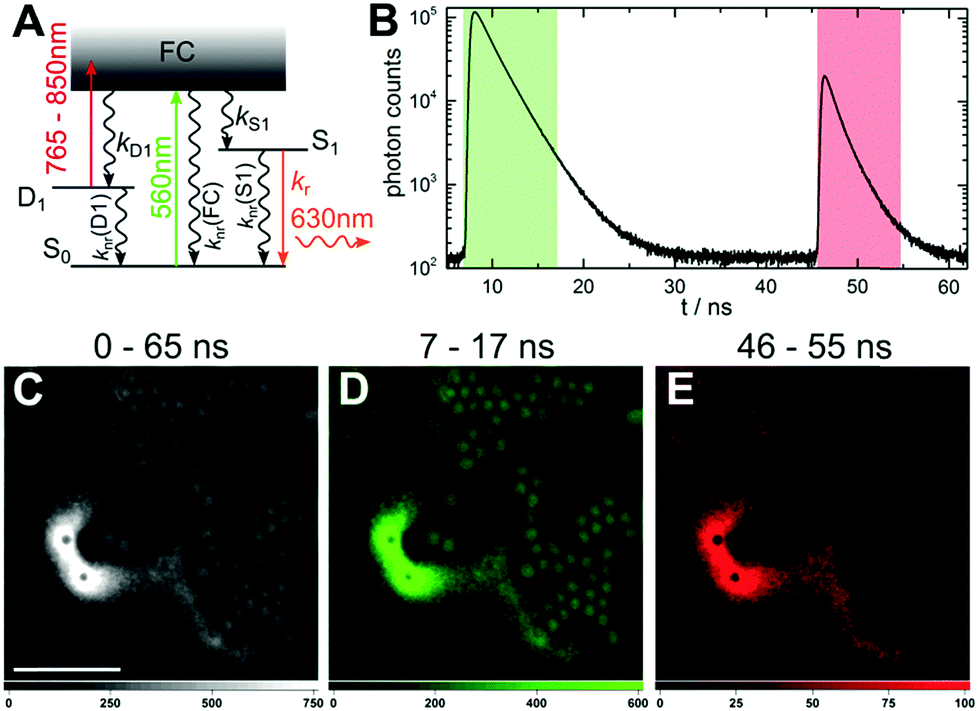 | ||
| Fig. 1 Optically activated delayed fluorescence microscopy. (A) Energy diagram for OADF of DNA-AgNCs. Vertical colored arrows indicate absorption of a photon from the primary (560 nm) and secondary (765–850 nm) excitation laser and the fluorescence emission at 630 nm, respectively. (B) Fluorescence decay curve (first decay after excitation with 560 nm at 7 ns) and OADF decay curve (second decay after illumination with 765–850 nm at 46 ns) for DNA-AgNCs embedded in PVA. (C–E) Fluorescence images of a heterogeneous sample of fluorescently-labeled polystyrene microspheres (acting as auto-fluorescence) and DNA-AgNCs within PVA film (representing the signal of interest). The images were constructed using (C) all the detected photons (0–65 ns), (D) the primary fluorescence (7–17 ns) and (E) the OADF signal (46–55 ns). The scale bar in (C) corresponds to 10 μm. The time gates used to construct images (D) and (E) are shown in (B) with the same colors. The image was acquired with a primary excitation power of 3.7 kW cm−2 and a secondary excitation power of 85 kW cm−2. The resolution of the image is 300 × 300 pixels and the integration time is 5 ms per pixel. | ||
We started by confirming that the red-emitting DNA-AgNCs, used in this study, can be optically pumped from the D1 state to the S1 state (see Fig. SI1, ESI†). In solution, the optically activated delayed fluorescence (OADF) has an intensity of about 1% of the primary fluorescence (PF) intensity, using primary and secondary excitation intensities of 3.7 kW cm−2 and 85 kW cm−2, respectively.
OADF can also be generated from DNA-AgNCs immobilized in a polyvinyl alcohol (PVA) film, as shown in Fig. 1B. First, the primary 560 nm excitation laser brings the DNA-AgNCs to the FC state, where a fraction will evolve to the D1 state. 40 ns later, a secondary broadband (765–850 nm) laser pulse can transfer the DNA-AgNCs trapped in the D1 state, to the S1 state. When immobilized in PVA, the OADF intensity is significantly higher than in solution – around 7% of the primary fluorescence intensity (see Fig. SI1, ESI†). The origin of this apparent increase is not clear, but could be due to the immobilization or the different polarity of the PVA that might affect QD1.
Since OADF can be realized, we performed OADF microscopy with our DNA-AgNCs. The sample (Fig. 1C) consists of a heterogeneous mixture of a PVA film containing DNA-AgNCs and fluorescently-labeled polystyrene (PS) microspheres. The PS microspheres serve as the unwanted auto-fluorescence that can be excited with the 560 nm laser. During the confocal imaging, we acquired both macro- and micro-times of every detected photon.31 The macro-times allow us to link photons to a specific pixel in the image, while the micro-times allow to create software-gated images based on the photon arrival time with respect to the excitation pulse.13 An image containing all photons in the 0–65 ns window is shown in Fig. 1C. The image displays the emission from DNA-AgNCs dyed PVA film and the polystyrene microspheres. Fig. 1D shows the signal in the 7–17 ns time range, which contains only emission from the primary excitation laser, i.e. the emission from the polystyrene spheres and the DNA-AgNCs that did not evolve to the D1 state.
Fig. 1B shows that a ∼40 ns delay is sufficient to eliminate all emission and auto-fluorescence from the primary excitation. In Fig. 1E, only the OADF signal, generated by the secondary laser (85 kW cm−2), is selected in the 46–55 ns time window. Fig. 1E shows a complete removal of the unwanted auto-fluorescence from the polystyrene microspheres. More details can be seen in Fig. SI2 (ESI†). Using a short pass filter, potential auto-fluorescence on the Stokes side of the secondary laser can be easily removed, since the OADF is on the anti-Stokes side. To verify that the signal in the 46–55 ns region is OADF, we switched off the primary excitation laser. Although the OADF signal dropped dramatically, a small signal was still present (∼19% of the signal with primary excitation on).
At an excitation intensity of 85 kW cm−2, TPE is unlikely. Looking back at the electronic state diagram in Fig. 1A, the most probable process is a two consecutive photon absorption process, with D1 as the intermediate state that leads to the emission from S1. We will refer to this excitation process as upconversion fluorescence (UCF), due to the similarities with upconverted luminescence from lanthanide particles.19 It was introduced previously for DNA-AgNCs by Cui et al.32 Keeping the primary excitation laser blocked, we increased the average intensity of the secondary laser to about 1 MW cm−2. This excitation intensity is sufficient to achieve a good UCF contrast. As a result of the consecutive excitation from S0via D1 to S1 (Fig. 2A), DNA-AgNC emission was observed in the 46–55 ns time window (Fig. 2B). Since UCF is generated on the anti-Stokes side of the secondary laser, auto-fluorescence-free images can again be easily created, using a short pass filter. In theory, UCF does not require time-gating in order to create a background-free image. However, in this case we used time-gating to suppress a minor scatter contribution (IRF-limited decay at 11 ns in Fig. 2B) from the continuum laser. Both Fig. 2C and E show an image very similar to the OADF image in Fig. 1E that displays no emission contributions from the polystyrene microspheres. An image created from the photons in the 7–17 ns range (Fig. 2D), shows no features related to either the DNA-AgNCs emission or the auto-fluorescence from the polystyrene beads, confirming that this signal is derived from the laser scatter and detector dark counts. The excitation intensity required for UCF is significantly lower than that of TPE for organic fluorophores,20 due to the consecutive photon absorption and the long-lived intermediate dark state. Consequently, the UCF signal depends linearly on the excitation intensity, unlike the quadratic dependence for TPE. To verify the linear dependence, we measured the UCF signal as a function of excitation intensity. Fig. 3A shows a clear linear trend in the 40 kW cm−2 to 1 MW cm−2 regime (see also Fig. SI3, ESI†). Furthermore, we compared the UCF spectrum with the primary emission spectrum (excitation at 560 nm) in PVA. Despite a minor 10 nm red-shift of the UCF spectrum, both spectra present the typical Gaussian-shaped DNA-AgNC emission (Fig. 3B). Similar minor variations of the average fluorescence lifetimes can be seen, comparing the direct excitation (2.6 ns in solution, Fig. SI1, ESI†), the OADF (2.0 ns in PVA, Fig. 1B) and the UCF (2.3 ns in PVA, Fig. 2B). In a next study we will investigate these differences at the single molecule level and check if certain DNA-AgNCs conformations/spectral subpopulations have different efficiencies for generating OADF and UCF signals, which can account for the variations in emission maximum and fluorescence lifetime. We also tested whether we could observe UCF in solution. Fig. SI4 (ESI†) shows the evolution of the OADF/PF and UCF/PF ratio as a function of secondary excitation intensity. Both the OADF/PF and UCF/PF ratios are lower in solution in comparison to the polymer case, as mentioned previously. Like the polymer case shown in Fig. 3, the UCF signal in solution increases linearly with secondary excitation intensity. The OADF/PF increases as a function of secondary excitation intensity and will saturate at a specific intensity, when all dark states are depopulated. Estimation of this saturation OADF/PF ratio and the quantum yield of fluorescence upon primary excitation (Q) allow us to estimate QD1. For the red-emitting DNA-AgNCs (in solution) presented here, we estimate QD1 between 3.9–20% (see ESI† for estimation).
 | ||
| Fig. 2 Upconversion fluorescence microscopy. (A) Energy diagram for UCF (upconversion fluorescence) of DNA-AgNCs. Vertical colored arrows indicate absorption of a photon from the secondary (765–850 nm) excitation laser and the fluorescence emission at 630 nm. The primary 560 nm excitation laser is blocked. (B) UCF decay curve (decay after illumination with 765–850 nm) for DNA-AgNCs embedded in PVA. (C–E) Fluorescence images of a heterogeneous sample of fluorescently-labeled polystyrene microspheres (acting as auto-fluorescence) and PVA containing DNA-AgNCs (representing the signal of interest). The image was constructed using (C) all the detected photons (0–65 ns) (D) the photons in the previously primary fluorescence range (7–17 ns) and (E) the UCF signal (46–55 ns). The time gates used to generate images (D) and (E) are shown in (B) with the same colors. The scale bar in (C) corresponds to 10 μm. The image was acquired with a resolution of 100 × 100 pixels and an integration time of 5 ms per pixel. The secondary excitation intensity was 978 kW cm−2. | ||
 | ||
| Fig. 3 Characterization of the UCF signal. (A) Secondary excitation intensity dependence of the UCF signal. Overall integration time is 50 s per data point. (B) Emission spectrum of DNA-AgNCs in PVA for direct excitation at 560 nm (black curve) and a UCF emission spectrum excited with 765–850 nm broadband laser (red curve). The cut-offs in the spectra are due to long and short pass filters. | ||
In summary, we presented two new imaging modalities, OADF and UCF microscopy, which are based, respectively, on the indirect and direct dark state formation of DNA-AgNCs. Both OADF and UCF modalities were able to fully remove the unwanted auto-fluorescence from fluorescent polystyrene beads. Advantages of OADF are the lower primary and secondary excitation power needed to create images. However, time-gating is necessary to separate the signal of interest from the auto-fluorescence. OADF can be further improved by screening for DNA-AgNCs with a higher QD1. Benefits of UCF microscopy include the use of a single excitation source and the redundancy of time-gating. In addition, UCF was proven to depend linearly on the excitation intensity. Future experiments will probe the absorption from the ground state to the dark state and from the dark state to the emissive state to determine the OADF and UCF excitation efficiency. Additionally we would like to point out that the presented OADF and UCF modalities are not necessarily limited to DNA-AgNCs specific dark states, but that triplet and other dark states, present in organic fluorophores or fluorescent proteins could potentially also be applied.33–36
We gratefully acknowledge financial support from the “Center for Synthetic Biology” at Copenhagen University funded by the UNIK research initiative of the Danish Ministry of Science, Technology and Innovation (Grant 09-065274), bioSYNergy, University of Copenhagen's Excellence Programme for Interdisciplinary Research, the Villum Foundation (Project number VKR023115), the Carlsberg Foundation (CF14-0388), the Danish Council of Independent Research (Project number DFF-7014-00027).
Conflicts of interest
There are no conflicts to declare.Notes and references
- L. Cai, N. Friedman and X. S. Xie, Nature, 2006, 440, 358–362 CrossRef CAS PubMed.
- M. B. J. Roeffaers, B. F. Sels, H. Uji-i, F. C. De Schryver, P. A. Jacobs, D. E. De Vos and J. Hofkens, Nature, 2006, 439, 572–575 CrossRef CAS PubMed.
- S. W. Hell, Nat. Methods, 2009, 6, 24–32 CrossRef CAS PubMed.
- D. J. Stephens and V. J. Allan, Science, 2003, 300, 82–86 CrossRef CAS PubMed.
- J. Rao, A. Dragulescu-Andrasi and H. Yao, Curr. Opin. Biotechnol., 2007, 18, 17–25 CrossRef CAS PubMed.
- M. Nyk, R. Kumar, T. Y. Ohulchanskyy, E. J. Bergey and P. N. Prasad, Nano Lett., 2008, 8, 3834–3838 CrossRef CAS PubMed.
- F. Helmchen and W. Denk, Nat. Methods, 2005, 2, 932–940 CrossRef CAS PubMed.
- J. Zhang, R. E. Campbell, A. Y. Ting and R. Y. Tsien, Nat. Rev. Mol. Cell Biol., 2002, 3, 906–918 CrossRef CAS PubMed.
- W. E. Moerner and M. Orrit, Science, 1999, 283, 1670–1676 CrossRef CAS PubMed.
- K. Trofymchuk, A. Reisch, P. Didier, F. Fras, P. Gilliot, Y. Mely and A. S. Klymchenko, Nat. Photonics, 2017, 11, 657–663 CrossRef CAS PubMed.
- L. Gu, D. J. Hall, Z. Qin, E. Anglin, J. Joo, D. J. Mooney, S. B. Howell and M. J. Sailor, Nat. Commun., 2013, 4, 2326 Search PubMed.
- S. J. Strickler and R. A. Berg, J. Chem. Phys., 1962, 37, 814–822 CrossRef CAS.
- Z. Liao, M. Tropiano, S. Faulkner, T. Vosch and T. J. Sorensen, RSC Adv., 2015, 5, 70282–70286 RSC.
- R. M. Rich, D. L. Stankowska, B. P. Maliwal, T. J. Sørensen, B. W. Laursen, R. R. Krishnamoorthy, Z. Gryczynski, J. Borejdo, I. Gryczynski and R. Fudala, Anal. Bioanal. Chem., 2013, 405, 2065–2075 CrossRef CAS PubMed.
- C. I. Richards, J. C. Hsiang, D. Senapati, S. Patel, J. Yu, T. Vosch and R. M. Dickson, J. Am. Chem. Soc., 2009, 131, 4619–4621 CrossRef CAS PubMed.
- G. Marriott, S. Mao, T. Sakata, J. Ran, D. K. Jackson, C. Petchprayoon, T. J. Gomez, E. Warp, O. Tulyathan, H. L. Aaron, E. Y. Isacoff and Y. Yan, Proc. Natl. Acad. Sci. U. S. A., 2008, 105, 17789–17794 CrossRef CAS PubMed.
- K. Svoboda and R. Yasuda, Neuron, 2006, 50, 823–839 CrossRef CAS PubMed.
- Y. Liu, Y. Lu, X. Yang, X. Zheng, S. Wen, F. Wang, X. Vidal, J. Zhao, D. Liu, Z. Zhou, C. Ma, J. Zhou, J. A. Piper, P. Xi and D. Jin, Nature, 2017, 543, 229 CrossRef CAS PubMed.
- J. Wang, R. Deng, M. A. MacDonald, B. Chen, J. Yuan, F. Wang, D. Chi, T. S. Andy Hor, P. Zhang, G. Liu, Y. Han and X. Liu, Nat. Mater., 2013, 13, 157 CrossRef PubMed.
- D. J. Gargas, E. M. Chan, A. D. Ostrowski, S. Aloni, M. V. P. Altoe, E. S. Barnard, B. Sanii, J. J. Urban, D. J. Milliron, B. E. Cohen and P. J. Schuck, Nat. Nanotechnol., 2014, 9, 300 CrossRef CAS PubMed.
- C. Cerretani, M. R. Carro-Temboury, S. Krause, S. A. Bogh and T. Vosch, Chem. Commun., 2017, 53, 12556–12559 RSC.
- T. Vosch, Y. Antoku, J. C. Hsiang, C. I. Richards, J. I. Gonzalez and R. M. Dickson, Proc. Natl. Acad. Sci. U. S. A., 2007, 104, 12616–12621 CrossRef CAS PubMed.
- J. T. Petty, C. Y. Fan, S. P. Story, B. Sengupta, A. S. Iyer, Z. Prudowsky and R. M. Dickson, J. Phys. Chem. Lett., 2010, 1, 2524–2529 CrossRef CAS PubMed.
- J. T. Petty, C. Fan, S. P. Story, B. Sengupta, M. Sartin, J.-C. Hsiang, J. W. Perry and R. M. Dickson, J. Phys. Chem. B, 2011, 115, 7996–8003 CrossRef CAS PubMed.
- I. L. Volkov, P. Y. Serdobintsev and A. I. Kononov, J. Phys. Chem. C, 2013, 117, 24079–24083 CAS.
- I. Volkov, T. Sych, P. Serdobintsev, Z. Reveguk and A. Kononov, J. Lumin., 2016, 172, 175–179 CrossRef CAS.
- S. A. Patel, M. Cozzuol, J. M. Hales, C. I. Richards, M. Sartin, J. C. Hsiang, T. Vosch, J. W. Perry and R. M. Dickson, J. Phys. Chem. C, 2009, 113, 20264–20270 CAS.
- E. Thyrhaug, S. A. Bogh, M. R. Carro-Temboury, C. S. Madsen, T. Vosch and D. Zigmantas, Nat. Commun., 2017, 8, 15577 CrossRef CAS PubMed.
- S. H. Yau, N. Abeyasinghe, M. Orr, L. Upton, O. Varnavski, J. H. Werner, H. C. Yeh, J. Sharma, A. P. Shreve, J. S. Martinez and T. Goodson, Nanoscale, 2012, 4, 4247–4254 RSC.
- B. C. Fleischer, J. T. Petty, J. C. Hsiang and R. M. Dickson, J. Phys. Chem. Lett., 2017, 8, 3536–3543 CrossRef CAS PubMed.
- K. D. Weston, M. Dyck, P. Tinnefeld, C. Muller, D. P. Herten and M. Sauer, Anal. Chem., 2002, 74, 5342–5349 CrossRef CAS PubMed.
- Q. Cui, Y. Shao, K. Ma, S. Xu, F. Wu and G. Liu, Analyst, 2012, 137, 2362–2366 RSC.
- C. M. Marian, M. Etinski and V. Rai-Constapel, J. Phys. Chem. A, 2014, 118, 6985–6990 CrossRef CAS PubMed.
- D. P. Mahoney, E. A. Owens, C. Fan, J. C. Hsiang, M. M. Henary and R. M. Dickson, J. Phys. Chem. B, 2015, 119, 4637–4643 CrossRef CAS PubMed.
- A. E. Jablonski, R. B. Vegh, J. C. Hsiang, B. Bommarius, Y. C. Chen, K. M. Solntsev, A. S. Bommarius, L. M. Tolbert and R. M. Dickson, J. Am. Chem. Soc., 2013, 135, 16410–16417 CrossRef CAS PubMed.
- P. Tinnefeld, J. Hofkens, D. P. Herten, S. Masuo, T. Vosch, M. Cotlet, S. Habuchi, K. Mullen, F. C. De Schryver and M. Sauer, ChemPhysChem, 2004, 5, 1786–1790 CrossRef CAS PubMed.
Footnote |
| † Electronic supplementary information (ESI) available: Materials and methods section, additional PF/OADF and UCF decay curves, OADF and UCF microscopy images. See DOI: 10.1039/c8cc01521j |
| This journal is © The Royal Society of Chemistry 2018 |