Continuous purification of active pharmaceutical ingredients utilizing polymer membrane surface wettability†
Joseph
Imbrogno
 a,
Luke
Rogers
a,
Dale A.
Thomas
ab and
Klavs F.
Jensen
a,
Luke
Rogers
a,
Dale A.
Thomas
ab and
Klavs F.
Jensen
 *ac
*ac
aDepartment of Chemical Engineering, Massachusetts Institute of Technology, Cambridge, MA 02139, USA. E-mail: kfjensen@mit.edu
bDepartment of Mechanical Engineering, Massachusetts Institute of Technology, Cambridge, MA 02139, USA
cDepartment of Materials Science and Engineering, Massachusetts Institute of Technology, Cambridge, MA 02139, USA
First published on 28th November 2017
Abstract
Continuous processing of pharmaceuticals opens opportunities for continuous separation based on wettability of polymer membranes. Dual use of hydrophobic and hydrophilic membranes realize in-line liquid–liquid extraction in the synthesis of four essential APIs. A secondary membrane with opposite wetting characteristics proves critical to phase separation of aqueous–organic reaction streams.
Throughout the past 70 years, membranes have seen exponential growth in many industries, such as biotechnology, food, petroleum, and water treatment, due to their low energy cost.1–3 In contrast, they have not seen widespread use in pharmaceutical synthesis due to the often harsh or chemically incompatible nature of many of the solvents used when producing pharmaceuticals.4 Additionally, nearly all pharmaceuticals are still produced using batch or semi-batch unit operations. However, the relatively new movement towards continuous production of pharmaceuticals presents an exciting opportunity for membrane based applications.5–7 Purification after synthesis, whether it be the final purification or an intermediate step before further downstream processing such as crystallization, is a vital part of the process that often goes overlooked, due to underdeveloped unit operations in flow chemistry. Since the final drug product cannot be produced without these steps, these processes need to be optimized alongside upstream reaction engineering and synthesis.
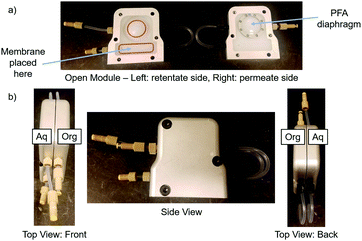
Chemically inert membranes, such as hydrophobic polytetrafluoroethylene (PTFE), can be used for phase separation, purification, and extraction during or after synthesis of a pharmaceutical by utilizing membrane wettability. This is made possible by the organic phase selectively wetting the PTFE membrane upon contact, as shown previously via contact angle measurements.8,9 This is due to the fact that most organic phases are relatively more non-polar than the aqueous phase. This effect, coupled with integrated pressure control, allows for the complete separation of aqueous/organic or organic/organic phases.10–12 This is a powerful tool during synthesis because it allows for continuous purification after extraction, instead of using semi-batch or batch unit operations. Surface wettability has been used previously on model systems or at the microfluidic scale, but never for separating complex multi-component mixtures as described here.13–16 Liquid–liquid extraction (LLE) and phase separation are often required to remove impurities, facilitate solvent exchange, or solubilize materials in order to avoid clogging that can lead to system failure. In this work, a unique membrane module with integrated pressure control that decouples the separation from downstream disturbances was utilized (Fig. 1).10 A detailed description of this module can be found in the ESI† Section S2.7.
 | ||
| Fig. 1 Schematic of membrane separator (a) open and (b) closed. A PTFE membrane and PFA diaphragm can be chosen from various pore sizes and thicknesses and placed into the module. | ||
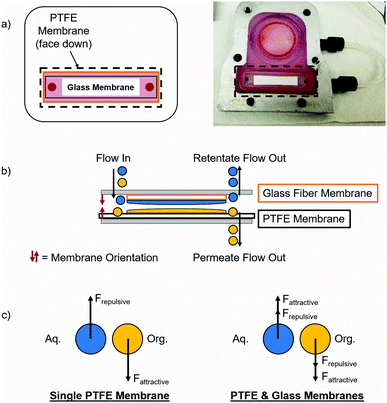
Separating complex mixtures, such as those present during pharmaceutical production, can be challenging even when using this type of module. In previous work, these modules had difficulty providing complete separation in the final liquid–liquid extraction for the synthesis of lidocaine, diazepam, atropine, and diphenhydramine.17 In order to increase the operating window for these modules, a secondary hydrophilic glass microfiber membrane was added that enhanced the separation by attracting the aqueous phase. With this addition, each of the two phases experienced both attraction and repulsion that helped separate them, as shown in Fig. 2. Fundamental experiments were conducted to visualize the effects of adding a secondary membrane into the module. It is important to note that the secondary glass membrane is only being used to attract the aqueous phase, i.e. there is no separate permeate collected. The flow path of the aqueous phase is the same as if only a PTFE membrane was present, except that it will flow through and around the glass membrane before exiting on the retentate side of the module.
When this secondary hydrophilic membrane was applied to the crude mixtures obtained during the final synthesis steps of the production of several pharmaceuticals, including lidocaine, diazepam, atropine, and diphenhydramine, complete phase separation was achieved after continuous LLE. These complex mixtures contained several organic solvents as well as aqueous salt solutions. The goal was to extract the active pharmaceutical ingredients (API's) into the organic phase; hexanes for lidocaine and diphenhydramine, ethyl acetate for diazepam, and dichloromethane/dimethylformamide (DCM/DMF) for atropine. Previously, this type of separation was very difficult when using a single hydrophobic PTFE membrane, since the interfacial tension was too low, typically leading to breakthrough of the aqueous phase into the organic phase. When using dual membranes, complete phase separation occurred and the API's were quantitatively extracted into their respective organic phases. Thus, this approach represents a promising step towards the reliable extraction and phase separation of commercially relevant API's in a fully continuous operation, even when using low interfacial tension mixtures.
PTFE was chosen because it is a chemically compatible material that is stable at elevated temperatures (up to ∼200 °C), commercially available in a range of microfiltration (MF) pore sizes (0.1–3.0 μm) (in both supported and unsupported formats), and is hydrophobic so it will be wet by many common organic solvents. All experiments described here utilize a 0.1 μm pore size PTFE membrane with a polypropylene support. After the organic phase contacts the PTFE membrane, it selectively permeates via carefully integrated pressure control. This method is adequate for many different mixtures, but can be difficult when working with very challenging mixtures that have a small operating region. Thus, an enhanced separation method was developed wherein a secondary membrane was added to the system in order to increase the separation between the two phases utilizing intermolecular attractions and capillary force. In order to wick away the aqueous phase, a glass membrane was added to the module that applied an additional driving force for separation.
This was first tested with several model systems containing water–toluene–acetone (Fig. S1, ESI†) or water–ethyl acetate–acetone (Fig. S2, ESI†). The operating ranges where complete phase separation was achieved were determined for systems with 1 or 2 membranes, that is either PTFE alone or PTFE with a glass microfiber membrane. The failure mode occurred when visible retention or breakthrough was present in the system. On average, the system was able to achieve complete separation at a 0.10–0.20 mL min−1 higher acetone flow rate than when only one membrane was used (an increase of up to 20%).
In order to determine if the glass membrane was affecting the equilibrium concentration after the extraction, important for modeling and scale-up purposes, the samples were analyzed using GC-FID of the water–hexane–IPA mixture. Five different experiments (batch, batch + glass microfiber membrane, flow + 1 membrane, flow + 2 membranes with 1.5 cm length, and flow + 2 membranes with 2.5 cm length) were carried out to determine the equilibrium concentration of IPA in the organic phase. The flow rate of IPA was ∼0.50 mL min−1, but exact flow rates are given in Table S1 (ESI†) since the flow rate needed to be slightly lower for the 1 membrane system. GC-FID was used to analyze the samples, which were compared with a calibration curve (Fig. S3, ESI†). It was determined that there was no statistical difference between the equilibrium concentrations of IPA in any of the experiments, as shown in Fig. S4 (ESI†). This allows for facile modeling of the process without the need to correct for non-equilibrium considerations.
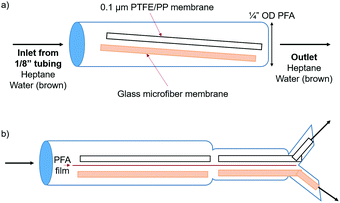
A simple setup was designed in order to prove that the wettability and capillary effect of the glass microfiber membrane were both attracting the aqueous phase and repelling the organic phase. PTFE and glass microfiber membrane sheets were placed into a short length of ¼′′ OD PFA tubing (Fig. 3a).
A biphasic solvent system was tested, comprised of water and heptane. In order to visualize the phase segregation, the aqueous phase was dyed brown and the heptane phase was colorless. Several configurations were tested, as shown in Fig. S5 and Videos (ESI†). Strong attraction of the aqueous phase to the glass microfiber membrane was apparent. The aqueous phase was even pulled around the PFA barrier due to the cohesive forces between the water molecules and the intermolecular forces with the glass membrane. The organic phase did not wet the glass membrane and therefore an easier segregation of the two phases was possible.
It is important to note that the surface area of the glass material must be high if the goal is to separate phases at high flow rates. In comparison, the aqueous phase exhibited similar attraction to a solid glass sheet; however, the maximum flow rates while maintaining complete separation were lower due to the lower surface area. Therefore, a material with high surface area, like that of a porous membrane, is required to operate efficiently at high flow rates. The second format was identical to the first, except that the two membranes were separated by a piece of 0.005′′ PFA film in order to segregate each flow stream into one half of the tubing. In order to further utilize this system, a Y-connector was placed at the open end of the ¼′′ OD tubing (Fig. 3b). PTFE and glass microfiber membranes were placed into each half of the Y-connector in order to completely separate the two phases. This format allowed for complete phase separation up to a flow rate of 17 mL min−1 each of water and heptane, 34 mL min−1 total. This was also successful when adding IPA to the flow stream up to flow rates of 6, 6, and 2 mL min−1 water, heptane, and IPA, respectively.
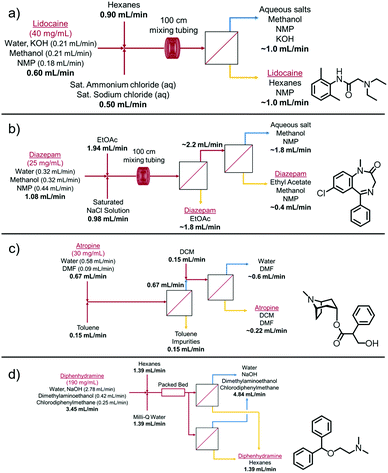
In order to test the effectiveness of this secondary membrane performance on real systems, it was applied to four APIs that were produced in our lab and required purification via LLE followed by phase separation before being sent for further downstream processing. Schematics of this purification process are shown in Fig. 4.
 | ||
| Fig. 4 Flow schematic representations for the LLE and phase separation of (a) lidocaine, (b) diazepam, (c) atropine and (d) diphenhydramine. | ||
The four examples tested here were lidocaine, diazepam, atropine, and diphenhydramine. The concentrations tested here range from 25–190 mg mL−1. These continuous syntheses were developed previously and each had a different composition (as shown in Fig. 4);18–21 however, they all had very low interfacial tensions due to the presence of solvents such as methanol and NMP. In addition, some of the organic phases being utilized already had a low interfacial tension with the aqueous phase, such as ethyl acetate (e.g. 6.8 mN m−1 for ethyl acetate vs. 49.7 mN m−1 for hexane–water mixtures).22 Since the applied pressure is intrinsically linked with the phase separation performance, these modules are not being operated at their maximum flux capabilities. Further discussion is described in Section S2.7 of the ESI.†
Lidocaine was to be extracted into the hexanes phase and the impurities and other solvents were to remain in the aqueous phase. After complete phase separation, lidocaine was the major constituent peak and only one other small impurity peak was present in the HPLC spectrum (Fig. S9a, ESI†). In addition to operating at these flow rates, the system was scaled up to higher flow rates that were similar to what would be required for a 3000 dose per day scale (50 mg dose), with an average lidocaine concentration of (40 mg mL−1) before purification. The flow rates were scaled up to 2.00 mL min−1 for the reaction stream, 3.00 mL min−1 for hexane, and 1.65 mL min−1 for the saturated salt stream. The system was run continuously for 1 h, with complete separation for the entirety of the run (Fig. S6, ESI†).
Diazepam was used as the second example, but due to the difficult nature of this separation, one separator was not enough to achieve complete separation. In this case, some retention was observed after the first separator, so the aqueous outlet was fed directly into the feed of a second separator (with the same membrane setup), which was then able to achieve complete separation of the mixture (Fig. S7, ESI†). This can also be achieved using 2–3 separators in parallel. The results were shown to be as selective as the gravity based extraction based on HPLC analysis (Fig. S9b, ESI†).
Atropine involved a two-step extraction and separation process. This system was run in-line during the continuous production of atropine due to the unstable nature of the atropine product. After mixing and phase separation, the impurities were extracted into the toluene phase and the atropine remained in the aqueous phase. This aqueous phase was then mixed with DCM in a tee mixer and separated using a second membrane separator. After this second extraction and complete phase separation (Fig. S8, ESI†), atropine was present in the DCM/DMF organic phase (Fig. S9c, ESI†).
The last example tested was diphenhydramine, which utilized two membrane separators in parallel. Complete phase separation was achieved after the crude product stream exited a packed bed reactor. Diphenhydramine was successfully extracted into the hexanes phase, leaving only impurities and aqueous soluble solvents in the aqueous phase (Fig. S9d, ESI†).
In summary, adding a secondary membrane with contrasting surface wettability enhanced phase separation of mixtures with low surface tension differences between the organic and aqueous phases. Wettability, high surface area, and capillary effects were responsible for the attraction of the aqueous phase to the hydrophilic glass microfiber membrane. The system successfully separated a 1![[thin space (1/6-em)]](https://www.rsc.org/images/entities/char_2009.gif) :
:![[thin space (1/6-em)]](https://www.rsc.org/images/entities/char_2009.gif) 1 water–heptane mixture up to 34 mL min−1 total flow rate. The dual membrane separator system was finally applied to 4 API's (lidocaine, diazepam, atropine, and diphenhydramine). After LLE, 100% complete phase separation was achieved yielding nearly 100% selectivity for all products for at least 1 h. These separators are also able to handle highly concentrated streams, as long as the solutes are still well solubilized in each stream and the interfacial tension is still primarily a function of the two solvent streams. When necessary, more difficult LLE's can be carried out using multi-stage counter-current extraction, as shown previously.11,12 This work describes an important step towards the fully continuous purification and phase separation of pharmaceuticals. Additionally, this work shows that membrane based phase separation is a robust unit operation, even when synthesizing 3000 doses per day of an API.
1 water–heptane mixture up to 34 mL min−1 total flow rate. The dual membrane separator system was finally applied to 4 API's (lidocaine, diazepam, atropine, and diphenhydramine). After LLE, 100% complete phase separation was achieved yielding nearly 100% selectivity for all products for at least 1 h. These separators are also able to handle highly concentrated streams, as long as the solutes are still well solubilized in each stream and the interfacial tension is still primarily a function of the two solvent streams. When necessary, more difficult LLE's can be carried out using multi-stage counter-current extraction, as shown previously.11,12 This work describes an important step towards the fully continuous purification and phase separation of pharmaceuticals. Additionally, this work shows that membrane based phase separation is a robust unit operation, even when synthesizing 3000 doses per day of an API.
We would like to thank Novartis and DARPA for funding this project. Also, Marcella Lusardi for assisting with GC-FID experiments and Andrea Adamo for insightful discussions.
Conflicts of interest
There are no conflicts to declare.Notes and references
- Y. Cohen and J. Glater, Desalin. Water Treat., 2010, 15, 222–227 CrossRef.
- G. Daufin, J. P. Escudier, H. Carrère, S. Bérot, L. Fillaudeau and M. Decloux, Food Bioprod. Process., 2001, 79, 89–102 CrossRef CAS.
- K. P. Lee, T. C. Arnot and D. Mattia, J. Membr. Sci., 2011, 370, 1–22 CrossRef CAS.
- S. Hellweg, U. Fischer, M. Scheringer and K. Hungerbuhler, Green Chem., 2004, 6, 418–427 RSC.
- K. P. Cole, J. M. Groh, M. D. Johnson, C. L. Burcham, B. M. Campbell, W. D. Diseroad, M. R. Heller, J. R. Howell, N. J. Kallman, T. M. Koenig, S. A. May, R. D. Miller, D. Mitchell, D. P. Myers, S. S. Myers, J. L. Phillips, C. S. Polster, T. D. White, J. Cashman, D. Hurley, R. Moylan, P. Sheehan, R. D. Spencer, K. Desmond, P. Desmond and O. Gowran, Science, 2017, 356, 1144–1150 CrossRef CAS PubMed.
- C. Badman and B. L. Trout, J. Pharm. Sci., 2015, 104, 779–780 CrossRef CAS PubMed.
- Z. Brennan, Regularoty affairs professionals society, 2016 Search PubMed.
- D. Janssen, R. De Palma, S. Verlaak, P. Heremans and W. Dehaen, Thin Solid Films, 2006, 515, 1433–1438 CrossRef CAS.
- D. Y. Kwok and A. W. Neumann, Adv. Colloid Interface Sci., 1999, 81, 167–249 CrossRef CAS.
- A. Adamo, P. L. Heider, N. Weeranoppanant and K. F. Jensen, Ind. Eng. Chem. Res., 2013, 52, 10802–10808 CrossRef CAS.
- N. Weeranoppanant, A. Adamo, G. Saparbaiuly, E. Rose, C. Fleury, B. Schenkel and K. F. Jensen, Ind. Eng. Chem. Res., 2017, 56, 4095–4103 CrossRef CAS.
- Y. Shen, N. Weeranoppanant, L. Xie, Y. Chen, M. R. Lusardi, J. Imbrogno, M. G. Bawendi and K. F. Jensen, Nanoscale, 2017, 9, 7703–7707 RSC.
- W. Gaakeer, M. De Croon, J. Van Der Schaaf and J. Schouten, Chem. Eng. J., 2012, 207, 440–444 CrossRef.
- I. V. Gürsel, S. K. Kurt, J. Aalders, Q. Wang, T. Noël, K. D. Nigam, N. Kockmann and V. Hessel, Chem. Eng. J., 2016, 283, 855–868 CrossRef.
- M. Kashid, Y. Harshe and D. W. Agar, Ind. Eng. Chem. Res., 2007, 46, 8420–8430 CrossRef CAS.
- G. Takei, M. Nonogi, A. Hibara, T. Kitamori and H.-B. Kim, Lab Chip, 2007, 7, 596–602 RSC.
- A. Adamo, R. L. Beingessner, M. Behnam, J. Chen, T. F. Jamison, K. F. Jensen, J.-C. M. Monbaliu, A. S. Myerson, E. M. Revalor, D. R. Snead, T. Stelzer, N. Weeranoppanant, S. Y. Wong and P. Zhang, Science, 2016, 352, 61–67 CrossRef CAS PubMed.
- A.-C. Bédard, A. R. Longstreet, J. Britton, Y. Wang, H. Moriguchi, R. W. Hicklin, W. H. Green and T. F. Jamison, Bioorg. Med. Chem., 2017, 25, 6233–6241 CrossRef PubMed.
- C. Dai, D. R. Snead, P. Zhang and T. F. Jamison, J. Flow Chem., 2015, 5, 133–138 CrossRef CAS.
- J.-C. M. Monbaliu, T. Stelzer, E. Revalor, N. Weeranoppanant, K. F. Jensen and A. S. Myerson, Org. Process Res. Dev., 2016, 20, 1347–1353 CrossRef CAS.
- D. R. Snead and T. F. Jamison, Chem. Sci., 2013, 4, 2822–2827 RSC.
- D. J. Donahue and F. E. Bartell, J. Phys. Chem., 1952, 56, 480–484 CrossRef CAS.
Footnote |
| † Electronic supplementary information (ESI) available: Materials, experimental methods, and membrane separator description. See DOI: 10.1039/c7cc08218e |
| This journal is © The Royal Society of Chemistry 2018 |


