
Applying macromolecular crowding to 3D bioprinting: fabrication of 3D hierarchical porous collagen-based hydrogel constructs
Wei Long
Ng
 ab,
Min Hao
Goh
b,
Wai Yee
Yeong
*a and
May Win
Naing
*b
ab,
Min Hao
Goh
b,
Wai Yee
Yeong
*a and
May Win
Naing
*b
aSingapore Centre for 3D Printing (SC3DP), School of Mechanical and Aerospace Engineering, Nanyang Technological University (NTU), 50 Nanyang Avenue, Singapore 639798, Singapore. E-mail: wyyeong@ntu.edu.sg
bBio-Manufacturing Programme, Singapore Institute of Manufacturing Technology (SIMTech), Agency for Science, Technology and Research (A*STAR), 71 Nanyang Drive, 638075, Singapore. E-mail: winnaingm@SIMTech.a-star.edu.sg
First published on 16th January 2018
Abstract
Native tissues and/or organs possess complex hierarchical porous structures that confer highly-specific cellular functions. Despite advances in fabrication processes, it is still very challenging to emulate the hierarchical porous collagen architecture found in most native tissues. Hence, the ability to recreate such hierarchical porous structures would result in biomimetic tissue-engineered constructs. Here, a single-step drop-on-demand (DOD) bioprinting strategy is proposed to fabricate hierarchical porous collagen-based hydrogels. Printable macromolecule-based bio-inks (polyvinylpyrrolidone, PVP) have been developed and printed in a DOD manner to manipulate the porosity within the multi-layered collagen-based hydrogels by altering the collagen fibrillogenesis process. The experimental results have indicated that hierarchical porous collagen structures could be achieved by controlling the number of macromolecule-based bio-ink droplets printed on each printed collagen layer. This facile single-step bioprinting process could be useful for the structural design of collagen-based hydrogels for various tissue engineering applications.
Introduction
A three-dimensional (3D) porous scaffold offers a conducive microenvironment for living cells to remodel and organize into functional tissue.1 The pore sizes of the porous 3D scaffolds provide essential cues that regulate cellular behavior and functions.2 The bulk of native tissue comprises collagen (approximately 30% of the total body proteins), which provides structural stability and strength to numerous tissues such as skin, bone, cartilage or even teeth. Due to its well-characterized structure as an extracellular matrix protein, collagen type I has been widely utilized for mimicking tissue properties and controlling cellular functions.3–7Notably, highly-complex hierarchical porous structures are commonly found in most biological tissues such as skin,8–10 cornea11 and even bone.12 The importance of such hierarchical porous structures in native tissues has been critically reviewed elsewhere13–15 and it would be of utmost interest to recreate such complex hierarchical porous structures for tissue engineering applications. To date, fabrication of such hierarchical porous structures found in native tissues remains highly challenging.16 Some of the conventional approaches for fabrication of 3D porous scaffolds such as freeze drying, solvent casting-particulate leaching, gas foaming, phase separation and electrospinning have limited control and consistency over the scaffold architecture.17 Furthermore, these fabrication processes can be detrimental to living cells and cell seeding is usually performed on the pre-fabricated scaffolds. Hence, there is a demand for an alternative biocompatible strategy that can offer good control over the pore sizes within a 3D matrix with high consistency.
3D bioprinting is an emerging field that has attracted tremendous attention for numerous tissue engineering applications;18–20 it enables synchronized printing of living cells and biomaterials to fabricate highly-complex 3D tissue-engineered constructs. The main bioprinting techniques include microvalve-based,21–23 laser-based,24–26 inkjet-based27–29 and extrusion-based techniques.30–33 Particularly, DOD bioprinting (microvalve-based, laser-based and inkjet-based) offers a highly versatile and automated platform that facilitates the precise deposition of nano-liter sized droplets of desired materials onto pre-defined positions to create highly-complex heterogeneous 3D constructs. The microvalve-based bioprinting technique is selected as it is a more reliable DOD printing technique that enables precise deposition of multiple types of cells and biomaterials with high-throughput rates (up to 1 kHz) and high cellular viabilities (>80%).21
Macromolecular crowding (MMC) is a concept that has been developed to describe the inter- and intra-cellular space;34 it is a phenomenon that drives the cell biochemistry through its effect on fundamental processes such as protein folding and interactions with nucleic acids. MMC can shift the reaction equilibria and accelerate the rates of numerous chemical reactions such as enzymatic catalysis, receptor–ligand interactions and supramolecular aggregation.35 Most of the previous studies on MMC incorporated macromolecules within the culture media to reduce disparity between the in vivo and in vitro microenvironments and the commonly-used macromolecules include dextran sulfate, Ficoll 70, Ficoll 400 and Ficoll mixtures (different ratios of Ficoll 70 and 400).36–38 The addition of such macromolecules to the culture medium enhanced extracellular matrix (ECM) deposition by living cells in 2D cell culture systems. A surrogate marker known as fractional volume occupancy (FVO), which is highly dependent on the hydrodynamic radii (RH) of the macromolecules, is used to assess the degree of crowdedness within the solution.39 The physiological range of FVOs has been evaluated by calculating the total FVO of albumin, fibrinogen, globulin in the blood plasma and interstitial fluid, which lies in the range of 9–54% FVO.40 There has been little work performed on the influence of MMC in a 3D cell culture system; recent studies on MMC in 3D cell culture systems have demonstrated that the presence of macromolecules (Ficoll 400, up to 25 mg mL−1 ∼ 8% FVO) can influence the collagen fibrillogenesis process.41,42 A recent work demonstrated that polyvinylpyrrolidone (PVP, MW: 360 kDa) macromolecules have been employed at significantly higher FVOs as compared to other reported macromolecules in a 2D cell culture system to enhance extracellular matrix (ECM) deposition and cell proliferation in a dose-dependent manner.40
The presence of macromolecules alters the fibrillogenesis process via an excluded volume effect (EVE) and we hypothesize that the use of a printable macromolecule-based bio-ink could be employed to tune the pore sizes within a 3D-printed collagen-based matrix via DOD bioprinting to create 3D hierarchical porous structures. An ideal macromolecule-based bio-ink should have low printable viscosity (∼mPa s range)21 and high fractional volume occupancy (FVO) for an enhanced excluded volume effect.39 A recent study has demonstrated that the use of PVP-based bio-inks improved the homogeneity and viability of printed cells during/after bioprinting.43 In this study, we first evaluate the influence of MMC on collagen fibrillogenesis and cell behavior within 3D matrices and then optimize the printing process for different bio-inks to fabricate 3D hierarchical porous collagen-based constructs. Lastly, the microstructures of the 3D printed constructs are characterized using FE-SEM imaging and printing of primary human fibroblasts is also performed to evaluate the biocompatibility of the printing process.
Experimental section
Cell culture
Primary normal human dermal fibroblasts (NHDF from Promocell, Germany) are used in this study. Cells are cultured in the fibroblast growth medium (Promocell, Germany) containing fetal calf serum, basic fibroblast growth factor (bFGF) and insulin at 37 °C and 5% CO2 inside an incubator (Forma™ Steri-Cycle™ CO2 Incubator, Thermo Fisher Scientific). The culture medium is changed once every 3 days and the cells are routinely passaged in tissue culture flasks (passages 3–5). The adherent primary cells are routinely harvested using a DetachKit (Promocell, Germany) at 90% confluency.Preparation of collagen–PVP–fibroblast matrices of varying FVOs
In this work, 12-well insert plates are used to prepare the 3D collagen-based constructs to study the influence of MMC on collagen–fibroblast matrices using polyvinylpyrrolidone (PVP) macromolecules (MW: 360 kDa, from Sigma-Aldrich, USA). To fabricate 3D collagen–PVP–fibroblast matrices of different FVOs, PVP is first dissolved in 10× PBS at concentrations of 0 mg mL−1, 37.8 mg mL−1, 75.6 mg mL−1 and 113.4 mg mL−1 to form the stock solutions for 0%, 180%, 360% and 540% FVO, respectively (Table 1). The resulting matrices consist of rat tail collagen type I (3.34 mg ml−1) from Corning®, USA (70% of total volume), fibroblast growth medium from PromoCell, Germany (10% of total volume), polyvinylpyrrolidone (360 kDa) dissolved in 10× PBS solution (10% of total volume), and normal human dermal fibroblasts (1.5 × 10⁶ cells per ml) suspended in a fibroblast growth medium (FGM) from Promocell, Germany (10% of total volume). The resulting pre-fibrillated collagen–fibroblast solution is then neutralized using 1 M NaOH to pH 7; 350 μl of final neutralized collagen–fibroblast solution is added to each of the 12-well inserts (final collagen concentration of 2.4 mg ml−1, cell concentration of 0.15 × 10⁶ cells per ml and desired FVO of 0%, 18%, 36% and 54%) and incubated at 37 °C and 5% CO2 for an hour inside an incubator (Forma™ Steri-Cycle™ CO2 Incubator, Thermo Fisher Scientific) prior to addition of 1 ml fibroblast growth medium (Promocell, Germany) to the bottom of the culture insert. The fibroblast growth medium is supplemented with 100 μM ascorbic acid (Sigma-Aldrich, USA) from Day 1 onwards and a constant medium change is performed once every 3 days.| 3D matrices | 0% FVO | 18% FVO | 36% FVO | 54% FVO |
|---|---|---|---|---|
| Collagen | 3.5 mL | 3.5 mL | 3.5 mL | 3.5 mL |
| FGM | 0.5 mL | 0.5 mL | 0.5 mL | 0.5 mL |
| PVP in 10× PBS | 0.5 mL (0 mg mL−1) | 0.5 mL (37.8 mg mL−1) | 0.5 mL (75.6 mg mL−1) | 0.5 mL (113.4 mg mL−1) |
| Cell suspension | 0.5 mL | 0.5 mL | 0.5 mL | 0.5 mL |
| Total volume | 5 mL | 5 mL | 5 mL | 5 mL |
Influence of MMC on collagen microstructures in 3D culture
To fully understand the influence of MMC on collagen fibrillogenesis, the collagen–fibroblast matrices are prepared at varying FVOs (0–54%) and transferred to a 96-well plate (100 μl per well). The collagen assembly is then immediately monitored at 37 °C by a time-lapse measurement of light absorbance at 313 nm using a Tecan Infinite M200 spectrophotometer and analysis of the collagen formation kinetics is performed by measuring the lag phase (tlag) and the half-time (t1/2) prior to complete collagen fiber assembly.A field-emission scanning electron microscopy (FE-SEM) study is also performed to analyze the influence of MMC on the collagen microstructures within the 3D collagen–PVP–fibroblast matrices. The samples are first dehydrated using graded ethanol solutions (25%, 50%, 75%, 95% and lastly 100% ethanol for 20 min each). Next, the samples are placed in a critical point dryer from Leica EM CPD030, Germany and flushed with cold liquid CO2 at 10 °C over a period of 2 hours to preserve the nanostructure within the 3D collagen matrices. The dried samples are then carefully sectioned using a sterile surgical blade to expose the cross-sectional area of the collagen-based constructs. The cross-sectional areas of the specimens are mounted onto aluminium stubs and coated with platinum (Pt) using a Polarin SC7640 Sputter Coater from Quorum Technologies, United Kingdom. The cross-sections are examined with an Ultra-Plus Field Emission Scanning Electron Microscope (FE-SEM) from Carl Zeiss, Germany. The electron images are taken at 2 keV accelerating voltage. Lastly, ImageJ analysis is performed on the FE-SEM images to evaluate the fiber diameter and pore size within the 3D collagen–fibroblast matrices. To analyze the pore size of 3D collagen–fibroblast matrices, a suitable threshold value is first applied to FE-SEM images before analyzing Feret's diameter of the pores. FE-SEM imaging is conducted (n = 4 for each FVO) and the analysis results are presented as mean ± standard deviation.
Influence of MMC on cell behaviour in 3D culture
PrestoBlue® cell viability assay (Thermo Fisher Scientific) is used according to the manufacturer's protocol to quantify the cell proliferation rate by measuring the relative fluorescence units (RFUs) using a Tecan Infinite M200 spectrophotometer (n = 4 for each FVO at different time points). The cell proliferation rate can be quantified based upon the RFUs, whereby an increase in cell number is represented by a higher RFU value.The 3D collagen–fibroblast matrices (0–54% FVO, n = 4 for each FVO at different time points) are embedded in Tissue-Tek® optimum cutting temperature (OCT) and snap frozen in liquid nitrogen prior to cryostat sectioning using a research cryostat (Leica CM3050 S) at −22 °C. The 10 μm cryosections are then fixed in a mixture of methanol and acetone (in a 1![[thin space (1/6-em)]](https://www.rsc.org/images/entities/char_2009.gif) :1 ratio) at −20 °C for 20 minutes, followed by air-drying in a fume hood. The dried samples were then washed with tris buffered saline (TBS) supplemented with 0.1% Triton-X (washed thrice, 5 minutes per wash at room temperature). Non-specific binding of antibodies is blocked using 10% fetal bovine serum (heat inactivated) in tris buffered saline (TBS) supplemented with 0.1% Triton-X for an hour at room temperature and then incubated with anti-fibronectin antibodies (Abcam; dilution 1:100) at 4 °C overnight. The samples were then washed with tris buffered saline (TBS) supplemented with 0.1% Triton-X (washed thrice, 5 minutes per wash at room temperature). Secondary antibodies (Alexa Fluor 568 from Abcam; dilution 1:1000) are then added over an hour at room temperature. Cell nuclei are counterstained using VectaShield Hardset™ with DAPI. Samples are then left to dry for 24 hours prior to visualization using an Olympus fluorescent microscope (IX83 Inverted Microscope) and built-in cellSens software.
:1 ratio) at −20 °C for 20 minutes, followed by air-drying in a fume hood. The dried samples were then washed with tris buffered saline (TBS) supplemented with 0.1% Triton-X (washed thrice, 5 minutes per wash at room temperature). Non-specific binding of antibodies is blocked using 10% fetal bovine serum (heat inactivated) in tris buffered saline (TBS) supplemented with 0.1% Triton-X for an hour at room temperature and then incubated with anti-fibronectin antibodies (Abcam; dilution 1:100) at 4 °C overnight. The samples were then washed with tris buffered saline (TBS) supplemented with 0.1% Triton-X (washed thrice, 5 minutes per wash at room temperature). Secondary antibodies (Alexa Fluor 568 from Abcam; dilution 1:1000) are then added over an hour at room temperature. Cell nuclei are counterstained using VectaShield Hardset™ with DAPI. Samples are then left to dry for 24 hours prior to visualization using an Olympus fluorescent microscope (IX83 Inverted Microscope) and built-in cellSens software.
Preparation of bio-inks
Rheological characterization of PVP-based bio-inks
The influence of the polymer concentration on the PVP-based bio-inks (0–3% w/v) is evaluated using a Discovery hybrid rheometer (TA Instruments, USA). All measurements are performed in triplicate within the linear viscoelastic region. The viscosities of different PVP-based bio-inks are measured at shear rates ranging from 10 to 1000 s−1 at a constant temperature of 28 °C (temperature of printing chamber).Printing optimization
A 3D bioprinter (RegenHU Biofactory®, Switzerland) with multiple microvalve-based print-heads of 100 μm nozzle diameter is used in this study. The microvalve-based print-heads are first sterilized by dispensing 70% ethanol through the print-heads, followed by 30 min of UV sterilization prior to printing. A constant printing pressure of 0.25 bar is applied throughout all of the experiments.Characterization of the printed hierarchical porous constructs
FE-SEM imaging is performed to analyze the 3D collagen microstructure within the printed collagen constructs according to the preparation steps mentioned in the earlier section. ImageJ analysis is performed on the FE-SEM images to evaluate the pore size and porosity within the 3D collagen–fibroblast matrices at different regions (top, middle and bottom). To analyze the pore size and porosity of 3D collagen–fibroblast matrices, a suitable threshold value is first applied to FE-SEM images before analyzing Feret's diameter of the pores and the analysis results are presented as mean ± standard deviation. Further characterization is also performed to analyze the printing accuracy of the pre-defined hierarchical configuration by studying the transition zone between each printed region.Biocompatibility study
To demonstrate the feasibility of incorporating living cells in our proposed Bioprinting-Macromolecular Crowding Process (BMCP), an additional printing cartridge consisting of 1 million fibroblasts per ml in 2% PVP-based bio-ink is used to print discrete cell droplets onto each printed collagen layer. The cells in the PVP-based bio-ink are printed in the following manner: NaHCO3–collagen–cells in PVP–NaHCO3. The printed constructs (consisting of 6-layered structures, n = 6) are then incubated over a period of 10 days to evaluate the cell proliferation and spreading. Quantitative analysis is conducted using the PrestoBlue® assay to measure the normalized relative fluorescence units (RFUs) over a period of 10 days (Days 3, 7 and 10). The printed collagen–fibroblast constructs are stained using live/dead cell viability assays (Thermo Fisher Scientific, USA) at different time points (Days 3, 7 and 10) according to the manufacturer's protocol for better visualization of the living cells within the 3D printed collagen matrix.Statistical analysis
All experimental results are presented as mean ± standard deviation. Statistical comparisons are performed using Student's t-test. Significance levels are as follows: p < 0.001 (***), p < 0.01 (*). Values are considered to be significantly different when p value is <0.01.Results and discussion
Influence of MMC on collagen microstructures in 3D culture
Collagen–fibroblast matrix scaffolds are successfully prepared under all tested crowding conditions with varying fractional volume occupancy (0%, 18%, 36% and 54% FVO). A PVP concentration of up to 54% FVO is chosen to match the physiological range of fractional volume occupancy (FVO) found in native tissues.39 Three key parameters (pH, ionic strength and temperature) are known to influence the collagen fibrillogenesis process and affect the final collagen architecture. An evaluation of pH and ionic strength as a function of varying FVOs shows that there is no significant change in pH from 7.25 ± 0.02 in 0% FVO to 7.23 ± 0.02 in 54% FVO. In addition, there is only a slight increase in ionic strength from 150.1 ± 2.6 in 0% FVO to 158.7 ± 1.6 in 54% FVO. Therefore, an increase in FVO has no significant effect on both pH and ionic strength. As reported in a previous study, this negligible change in both pH and ionic strength does not contribute significantly to any alteration in the collagen fibrillogenesis process.44The rate of collagen I fibril formation is then quantified using a turbidity test at an absorbance of 313 nm (ref. 41) over a period of 30 minutes (at every 1 minute interval) at a constant temperature of 37 °C (Fig. 1a). The collagen molecules undergo a fibrillogenesis process when the conditions are adjusted to near physiological values (i.e. pH of 6.5–8.5 and temperature of 20–37 °C).45–47 The collagen assembly can be determined via turbidity measurement as the assembled collagen fibers absorb light at 313 nm. The collagen nucleation (lag phase) is indicated by the 313 nm absorbance at a value close to zero, following which the absorbance increases significantly during fibrillogenesis (growth phase) until it reaches a final plateau which represents the complete fiber assembly. Under all crowding conditions, a typical sigmoidal curve is observed with a lag phase (nucleation) having absorbance values close to zero, a growth phase (fibrillogenesis) and a final plateau corresponding to the complete fiber assembly. A significant decrease in the lag phase (tlag) is measured at 54% FVO as compared to the control 0% FVO group (a significant decrease from ∼9.2 min to ∼0 min). Generally, the tlag decreases with increasing PVP concentration. Macromolecular crowding also influenced the t1/2 with a significant decreased time for all tested PVP concentration as compared to the control group (from 14.4 ± 0.3 min in 0% FVO to 1.5 ± 0.4 min in 54% FVO). As shown in the experimental results, macromolecular crowding has a significant effect on the fiber formation and fibrillogenesis kinetics in a dose-dependent manner (Fig. 1b).
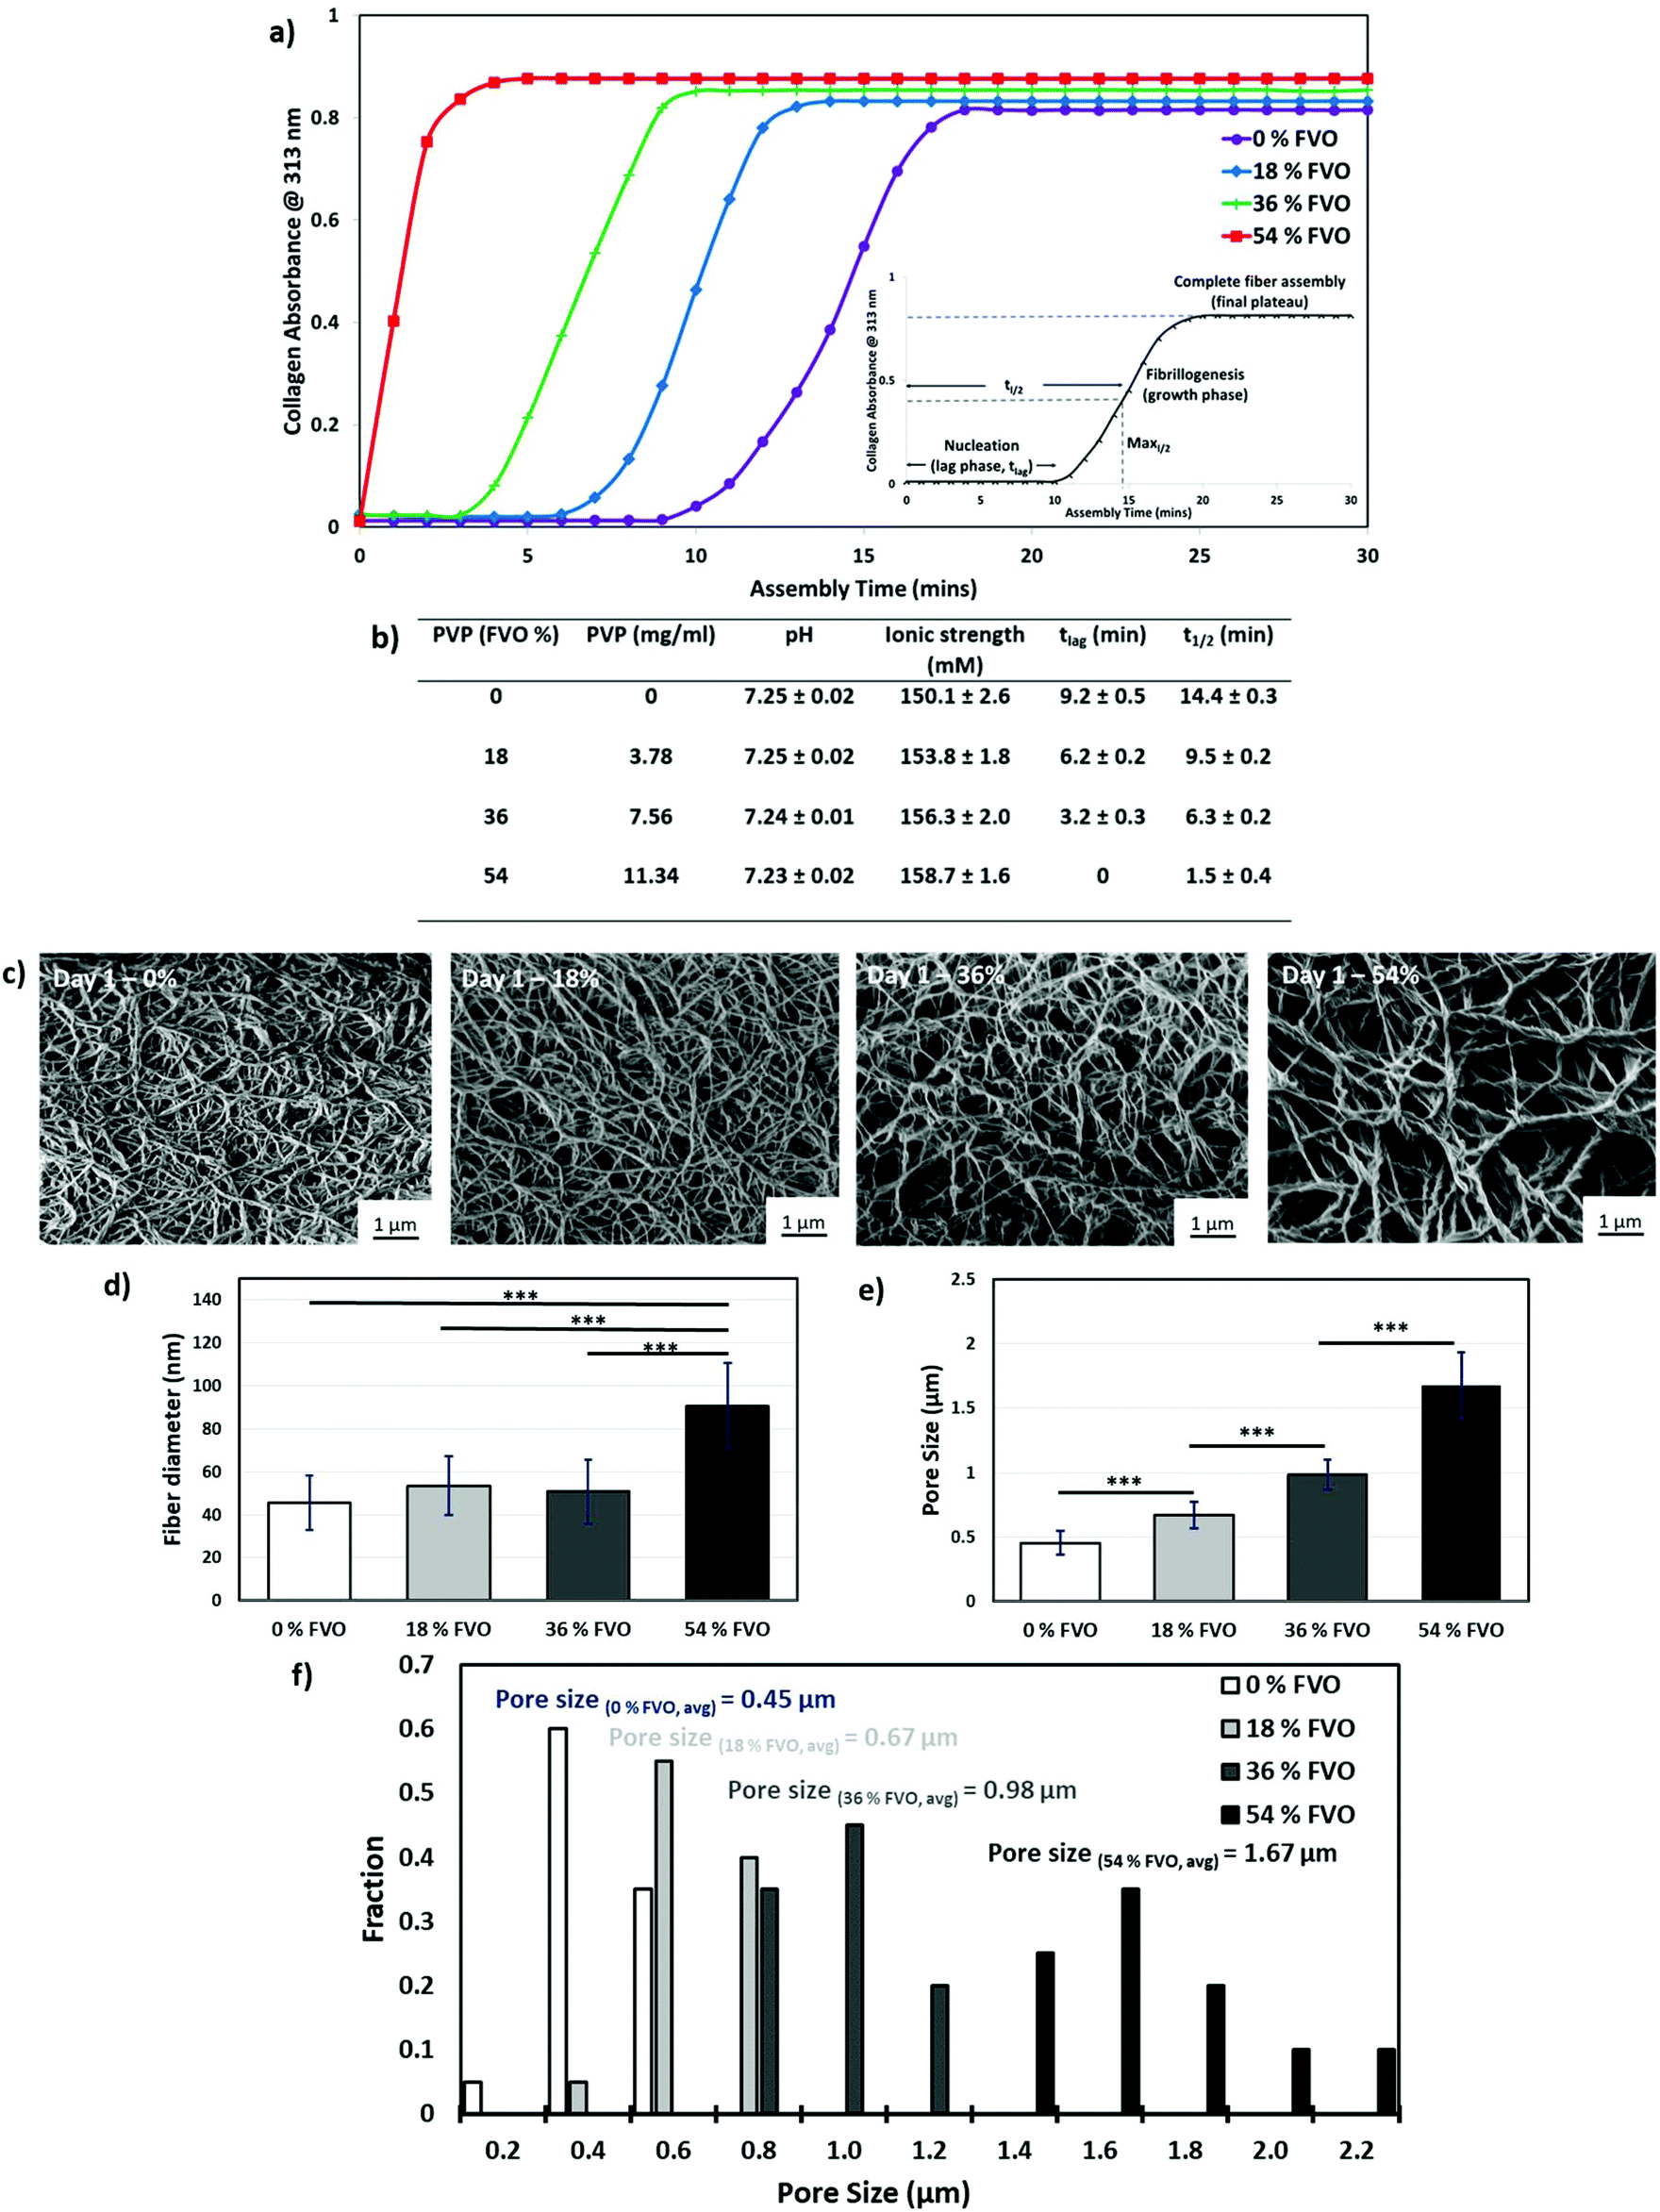 | ||
| Fig. 1 Influence of MMC on collagen fibrillogenesis. (a) Turbidimetric analysis of collagen fibrillogenesis kinetics under the influence of varying FVOs (0–54%). (b) Table summarizing the effect of MMC on pH, ionic strength and collagen formation kinetics. (c) Representative FE-SEM images of 3D collagen–fibroblast matrices at different FVOs (0–54%) and analysis of (d) fiber diameter, (e) pore size and (f) distribution of pore size. Significance levels are as follows: p < 0.001 (***), p < 0.01 (*). | ||
An in-depth evaluation of the collagen–fibroblast matrices is performed using field-emission scanning electron microscopy (FE-SEM) to analyze the ultrastructure within the 3D matrices. The collagen–fibroblast matrices are first dehydrated using graded ethanol, followed by critical-point drying to preserve the ultrastructure of the collagen hydrogel prior to FE-SEM imaging. The ultrastructure of the matrix scaffold is vastly altered by supplementing the pre-fibrillated ECM solution with increasing FVO as shown in Fig. 1c. The collagen matrix (control sample: 0 mg ml−1 PVP) produces ECM networks consisting of thin and highly interwoven fibers with an overall homogeneous fiber matrix density, whereas the matrices that are prepared under macromolecular crowding show a looser fiber meshwork (as indicated by highly-porous structures with thicker fibers) with increasing PVP concentration. A significant increase in the collagen fiber diameter is observed only when a high 54% FVO (Fig. 1d) is used as compared to other groups. In contrast, a significant change in the pore size is observed across all groups (0.45 ± 0.09 μm in 0% FVO, 0.67 ± 0.10 μm in 18% FVO, 0.98 ± 0.12 μm in 36% FVO and 1.67 ± 0.26 μm in 54% FVO – Fig. 1e). The increase in FVO (from 0–54%) has also resulted in a wider distribution of pore sizes (Fig. 1f) which is possibly due to a diffusion flux of PVP macromolecules across the thin layers of the collagen precursor. The addition of PVP macromolecules within collagen hydrogels reduces the available solvent volume and induces an increase in the effective concentration of collagen monomers, hence resulting in a higher number of nucleation sites that accelerates the collagen fibrillogenesis process.39,40,42 An increase in PVP concentration has induced a more significant crowding effect that accelerates the collagen fibrillogenesis process.40 The presence of macromolecules within the collagen matrix accelerates the collagen fibrillogenesis process and increases the pore size of the collagen matrix.42 Hence, the results indicate that MMC plays a critical role in modulating the pore size of the collagen–fibroblast matrices in a dose-dependent manner.
Influence of MMC on cell behaviour in 3D culture
To the best of our knowledge, prior work on MMC mainly focused on 2D cell culture systems and this study investigates the influence of MMC on fibroblast proliferation and ECM secretion within 3D collagen matrices.FE-SEM images (Fig. 2a) show that the primary human skin fibroblasts within the 3D collagen-based constructs spread and elongate over time under all tested crowding conditions (0–54% FVO). To evaluate the cell proliferation assay within the 3D matrices, the PrestoBlue® cell viability reagent is used according to the manufacturer's protocol to analyze the cell growth based on the fluorescence readout on a microplate reader. The number of cells at any given time point is expressed in relative fluorescence units (RFUs) normalized to the control group (0% FVO at Day 1). It is observed that a higher FVO generally resulted in a significant decrease in normalized RFUs over a period of 7 days (with increasing FVO) as shown in Fig. 2b. This suggests that a higher FVO generally results in a slower cell growth within the 3D collagen–fibroblast matrices over time; the key reason for the slower cell proliferation rate is mainly due to the increase in pore size associated with a higher FVO. Previous studies48,49 have shown that smaller pore sizes generally increase the cell proliferation rate.
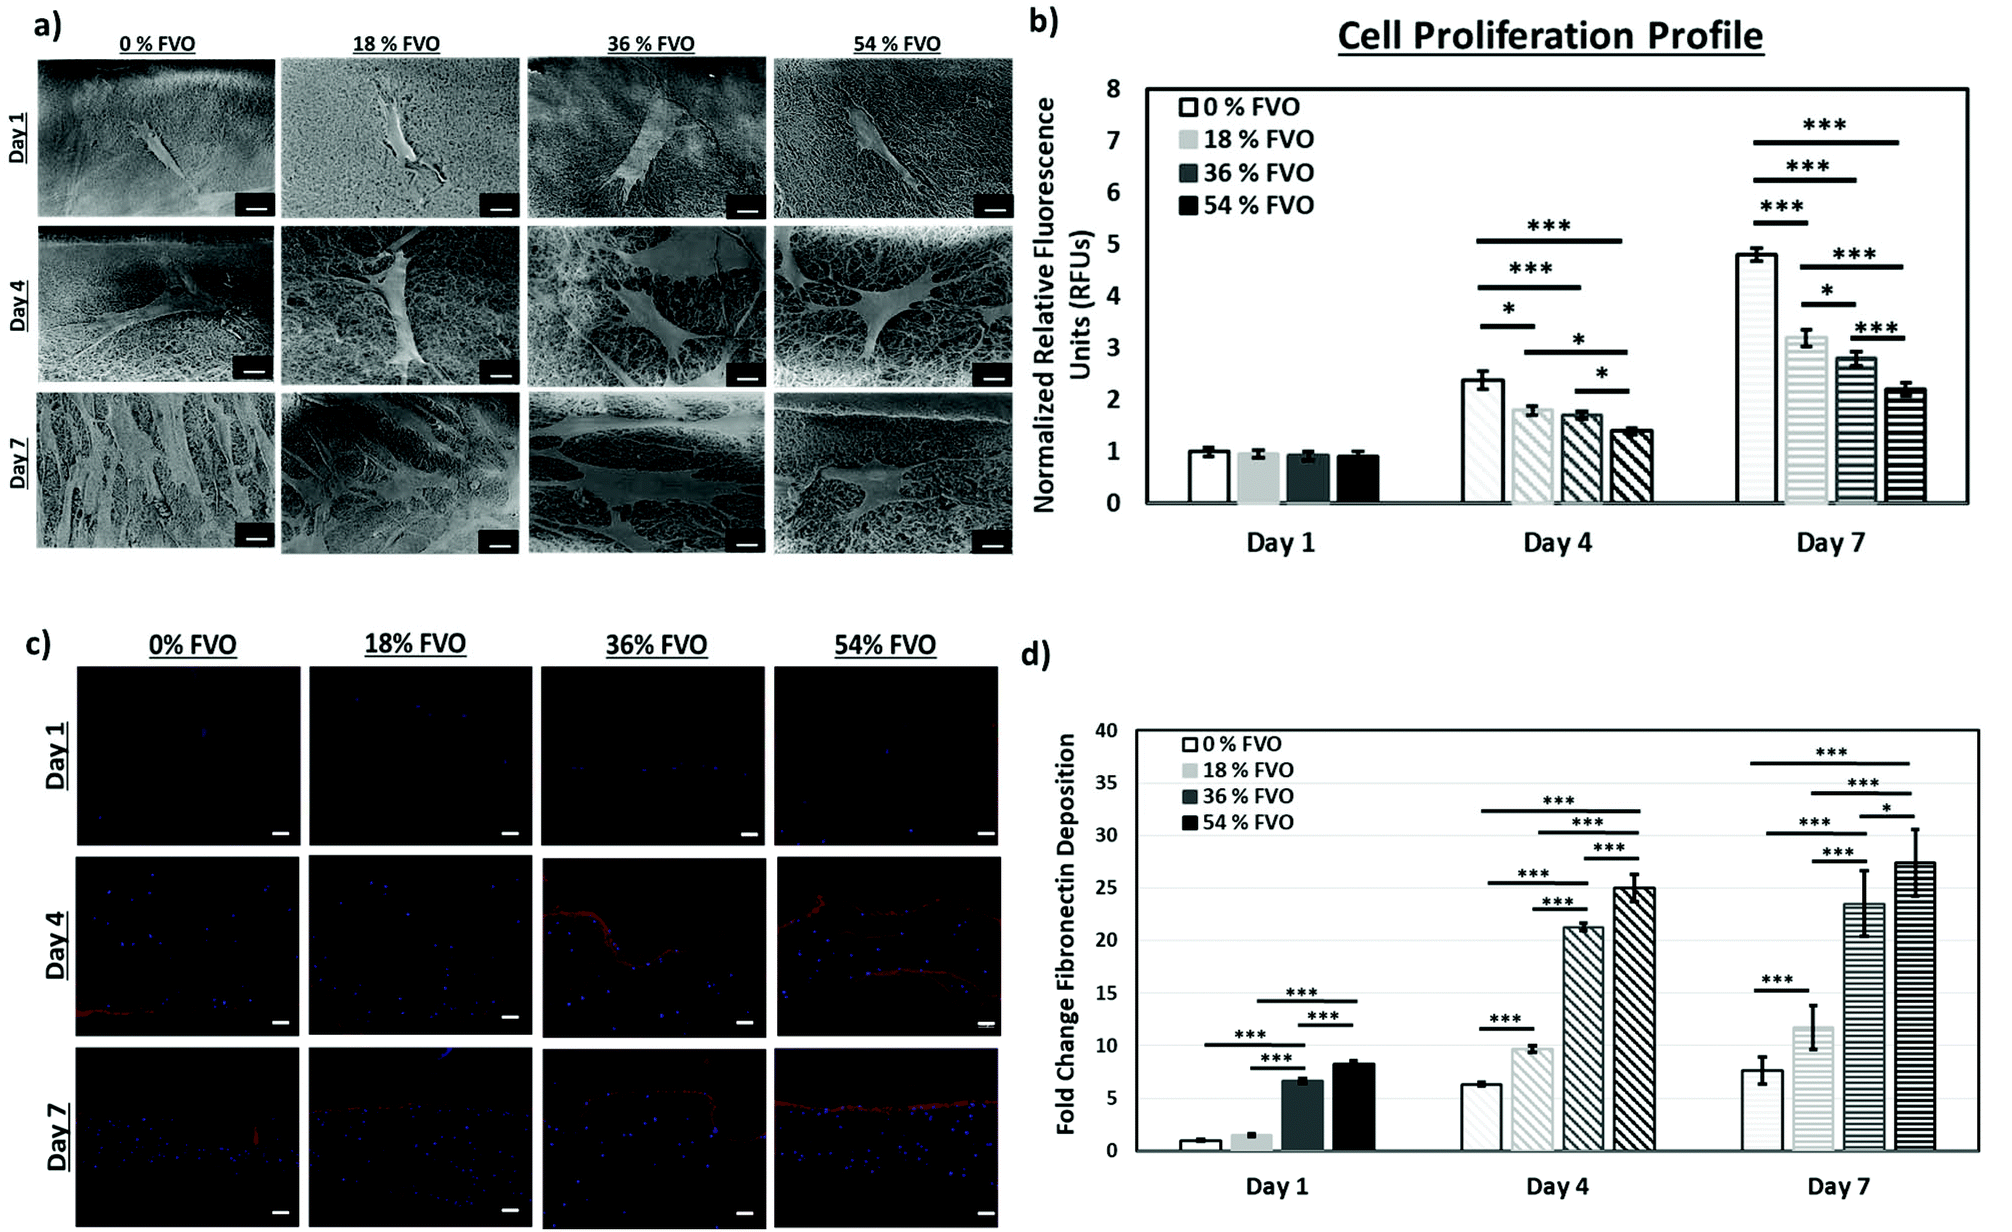 | ||
| Fig. 2 Influence of MMC on cell behavior in 3D culture. (a) Representative FE-SEM images of cell morphology within 3D collagen–fibroblast matrices at varying FVOs over time; scale bar: 10 μm. (b) Cell proliferation in 3D collagen–fibroblast matrices at varying FVOs over time. (c) Representative fluorescence images of fibronectin deposition in red counterstained with DAPI; scale bar: 100 μm. (d) Analysis of fold change in fibronectin deposition at varying FVOs over time. Significance levels are as follows: p < 0.001 (***), p < 0.01 (*). | ||
To evaluate fibronectin deposition within the 3D collagen–fibroblast matrices, immunofluorescence staining is performed. Higher fibronectin deposition (an important ECM protein for growth factor sequestrating and signaling50) is observed in the 3D collagen–fibroblast matrices with higher FVO (with larger pore sizes). The ECM deposition is calculated based on the area for positive staining (red) normalized to the 0% FVO sample at Day 1; the fibronectin deposition is significantly higher with increasing FVO over a period of 7 days as shown in Fig. 2c and d.
Rheological characterization of PVP-based bio-inks
Here, we demonstrate a new printing strategy termed Bioprinting-Macromolecular Crowding Process (BMCP) to deposit nano-liter sized droplets of collagen monomers, a cross-linker (sodium bicarbonate, NaHCO3) and PVP macromolecules at pre-defined positions to manipulate pore sizes within each printed collagen layer and eventually fabricate complex 3D hierarchical porous collagen-based structures. As compared to the conventional fabrication approaches, this facile single-step printing strategy facilitates DOD printing in a contactless and highly-automated manner.The PVP-based bio-inks that are used in this study have to satisfy the stringent printability requirements of DOD microvalve-based printheads (e.g. printable viscosity, printing stability and resolution) as shown in Fig. 3a. Different concentrations of PVP macromolecules (0, 1, 2 and 3% w/v) are prepared to investigate the influence of the polymer concentration on the printability of PVP-based bio-inks. The rheological properties of the PVP-based bio-inks are conducted within the linear viscoelastic region and the viscosities of different PVP-based bio-inks are measured at shear rates ranging from 10 to 1000 s−1 at a constant temperature of 28 °C (temperature of printing chamber) in triplicate. The PVP-based bio-inks exhibit Newtonian behavior as the viscosity of bio-inks does not change with increasing shear rates (Fig. 3b). The viscosities of PVP-based bio-inks generally increase with increasing PVP concentration, a large increase in the bio-ink viscosity is observed when the PVP concentration increases from ∼5.23 mPa s in 2% w/v to ∼12.03 mPa s in 3% w/v.
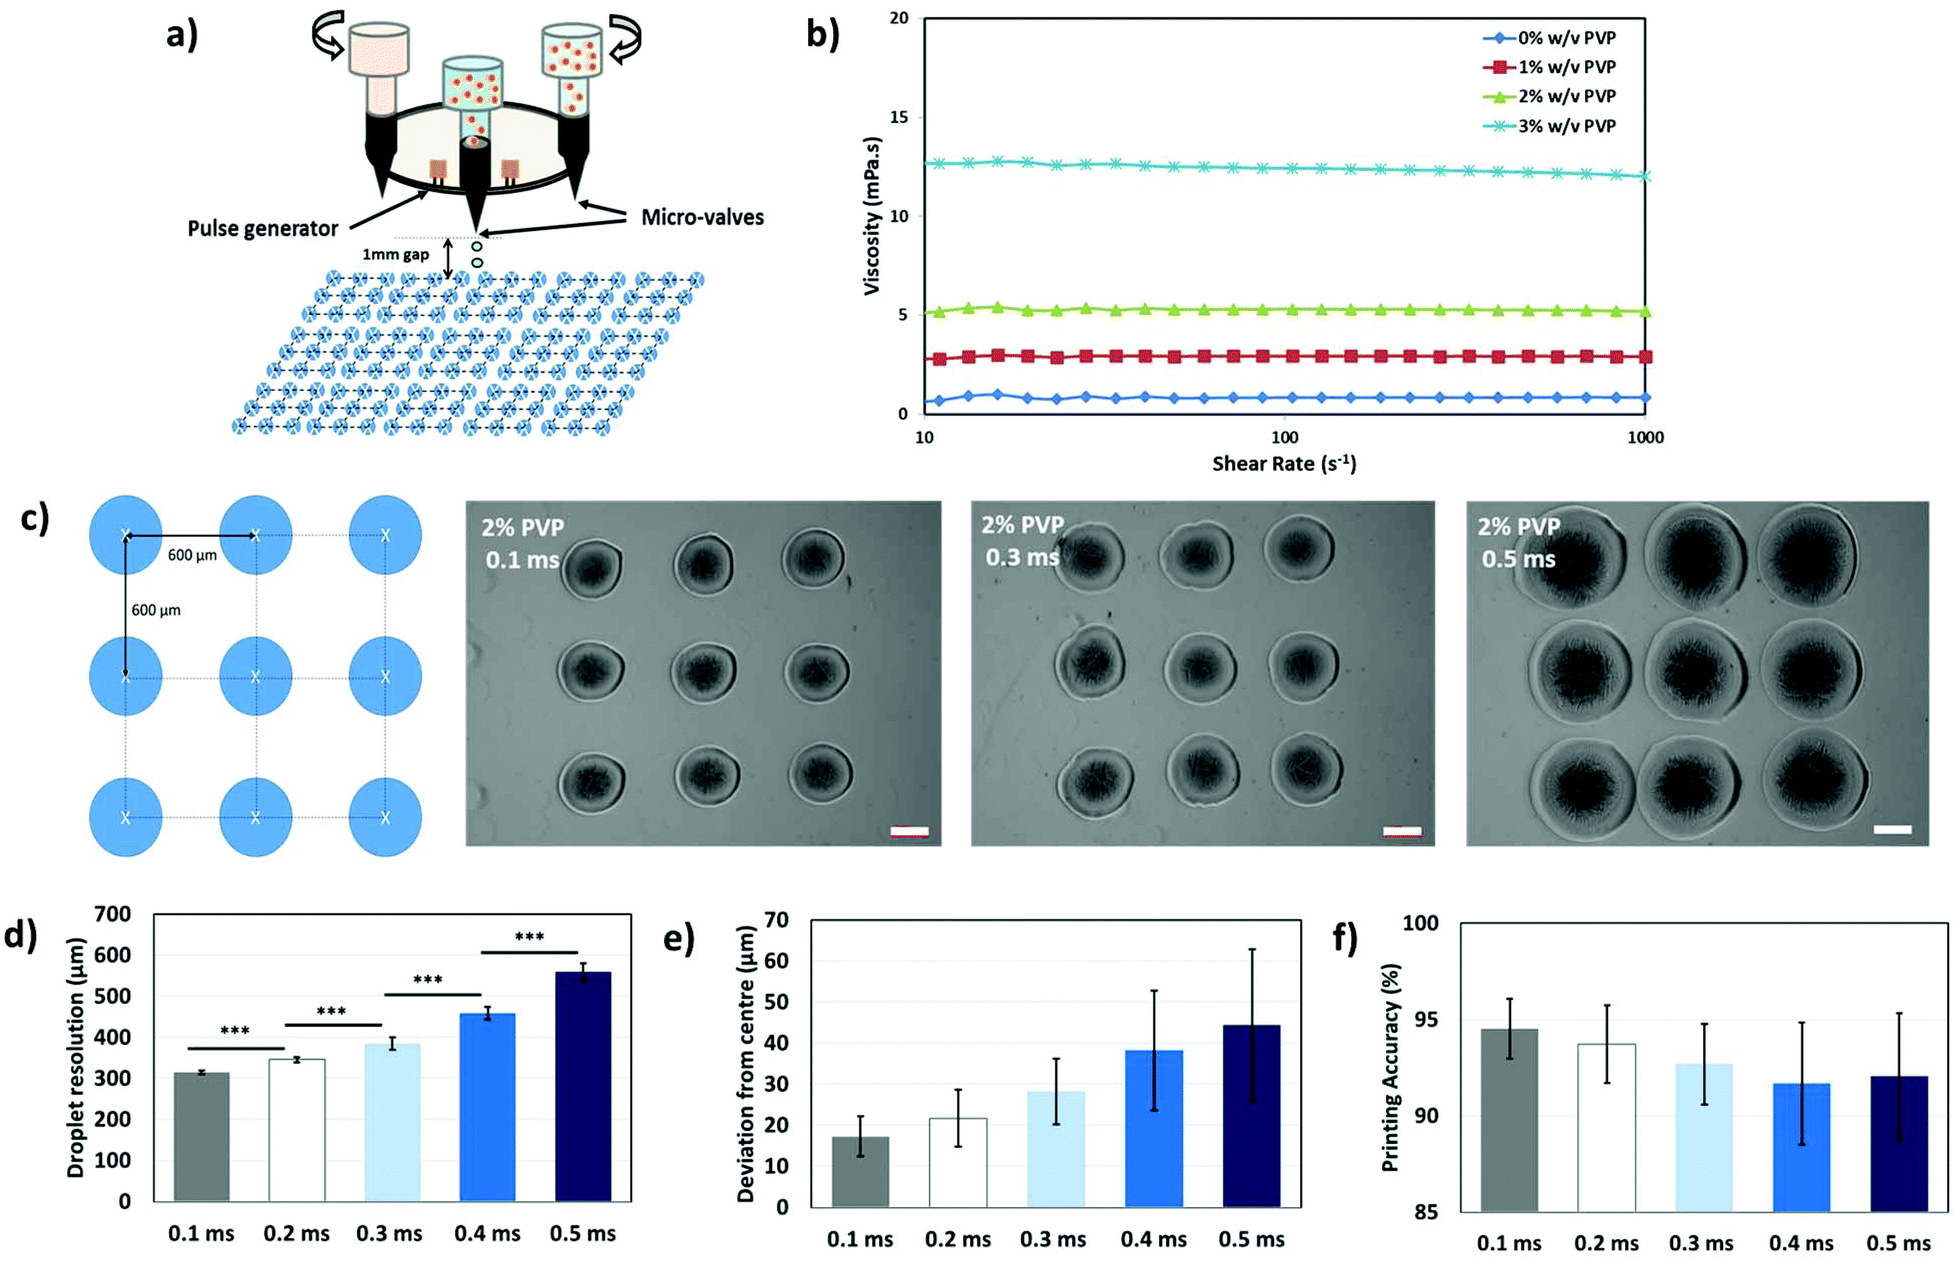 | ||
| Fig. 3 (a) Schematic drawing of drop-on-demand microvalve-based printing for PVP-based bio-inks. (b) Rheological characterization of different PVP-based bio-inks (0–3% w/v) from 10–1000 s−1. (c) Arrays of 3 × 3 PVP droplets are printed at a constant spacing of 600 μm (centre marked by white ×) and representative images of the printed PVP droplets at different valve opening times (VOTs) from 0.1–0.5 ms; scale bar: 200 μm. ImageJ analysis of the (d) droplet resolution, (e) deviation from the centre and (f) printing accuracy. | ||
Printing optimization
A 3D bioprinter (RegenHU Biofactory®, Switzerland) with multiple microvalve-based printheads of 100 μm nozzle diameter is used to evaluate the printability of PVP-based bio-inks. 15 arrays of 3 × 3 PVP-based droplets (n = 135) are deposited at a fixed printing pressure of 0.25 bar onto 35 mm × 10 mm culture dishes. The objective of this work is to evaluate and identify a PVP-based bio-ink with the highest printable concentration (higher FVO) that will be further optimized to achieve good droplet resolution and high printing accuracy for contactless DOD printing. Good printability is observed for 0–2% w/v PVP-based bio-inks (depicted by the deposition of discrete 3 × 3 droplets), whereas poor printability is evident in the 3% w/v PVP-based bio-ink (discrete droplets cannot be dispensed due to the formation of the fluid meniscus at the nozzle orifice even with increasing printing pressure). Hence, the 2% w/v PVP-based bio-ink is selected due to its higher PVP concentration and relatively good printability.The valve opening time (VOT) is a critical system parameter that influences the droplet formation in a microvalve-based printing system.21,23 Hence, optimization of the VOT is conducted to achieve contactless DOD printing of PVP droplets with high droplet resolution and printing accuracy. Additional 15 arrays of 3 × 3 PVP-based droplets (2% w/v PVP) are printed at varying VOTs (0.1, 0.2, 0.3, 0.4 and 0.5 ms) to evaluate the effect of varying VOTs on the droplet resolution, deviation from centre and printing accuracy (Fig. 3c). The images are first processed (marking of the centre position and applying a square grid over printed droplets) and then characterized using ImageJ analysis software (Fig. 3f). The droplet resolution generally improves with decreasing VOT (from 558.3 ± 22.0 μm at 0.5 ms to 314.0 ± 4.9 μm at 0.1 ms). Further analysis on the deviation of the printed droplets away from the centre of the pre-defined positions has showed that the deviation generally decreases with increasing VOT (from 44.4 ± 18.3 μm at 0.5 ms to 17.2 ± 4.9 μm at 0.1 ms). To ensure a fair comparison between the different sample groups, analysis of printing accuracy (deviation in distance from pre-defined positions as a percentage of droplet resolution) is performed on all printed droplets (2% w/v at varying VOTs). The printing accuracy generally improves with lower VOT (from 92.0 ± 3.3% at 0.5 ms to 94.5 ± 1.6% at 0.1 ms). In the subsequent work, a VOT of 0.1 ms is applied to achieve PVP printing at a printing resolution of 314.0 ± 4.9 μm and printing accuracy of 94.5 ± 1.6%.
Collagen (low concentration collagen: 3.34 mg ml−1 from Corning, USA) is directly printed using micro-valve based printheads (nozzle diameter of 100 μm). Optimization of the collagen printing parameters is performed to achieve thin and homogeneous collagen layers at high-throughput rates. Discrete collagen droplets are deposited along the adjacent lines (at a fixed spacing of 0.8 mm spacing and a droplet dispensing frequency of 55.6 Hz) at different feed rates (200, 400, 600, 800 and 1000 mm min−1). Increasing feed rates generally shorten the printing time for each printed collagen layer (from ∼127 seconds at 200 mm min−1 to ∼33 seconds at 1000 mm min−1) and reduce the thickness of each printed collagen layer (from 75.0 ± 3.8 μm at 200 mm min−1 to 19.8 ± 3.3 μm at 1000 mm min−1). The feed rate of 1000 mm min−1 forms inconsistent gaps within the collagen layer, resulting in a non-homogeneous collagen layer. Hence, an optimal feed rate of 800 mm min−1 is selected for subsequent collagen printing (∼22.5 ± 3.1 μm collagen thickness) within 40 seconds of printing time.
The printed collagen monomer layer has to be adequately crosslinked with an alkaline solution to facilitate a pH-dependent collagen cross-linking process.45,46 A mild alkaline buffer solution, sodium bicarbonate (NaHCO3, 0.8 M) is used in this study to facilitate the homogeneous crosslinking of individual collagen layer. Discrete NaHCO3 droplets are printed at different droplet spacings (1, 2, 3 and 4 mm) directly below and above each printed collagen layer (NaHCO3–collagen–NaHCO3). A NaHCO3 droplet spacing of 2 mm results in an optimal collagen cross-linking; a layer of a cross-linked collagen hydrogel could be observed immediately after printing (a stable collagen layer even when inverted). A droplet spacing of 1 mm results in excessive cross-linking of the collagen layer (a stable cross-linked collagen layer with excessive free-flowing NaHCO3 buffer solution), whereas a droplet spacing of ≥3 mm crosslinking results in poor collagen cross-linking (as indicated by free-flowing collagen solution on the tilted culture dishes). Hence, the optimal printing parameters include a feed rate of 800 mm min−1 for collagen printing and a constant NaHCO3 droplet spacing of 2 mm to facilitate the printing of thin and homogeneously cross-linked collagen layers (circular layer of 2 cm diameter) at a high-throughput rate (22.5 ± 3.1 μm collagen thickness within 40 seconds).
Characterization of the printed hierarchical porous constructs
The presence of highly-complex hierarchical porous structures is commonly found in most biological tissues.14 As a proof-of-concept, 6-layered hierarchical porous collagen structures consisting of 3 different regions are printed to closely mimic the dermal region of native skin (smaller pores at the superficial papillary dermal region and bigger pores at the deeper reticular dermal region).8,9 Using a single print-head containing the 2% w/v PVP-based bio-ink, the PVP concentration can be controlled by varying the number of PVP droplets per shot (no. of printed droplets during each valve opening time) at pre-defined positions. The number of PVP droplets per shot within each printed region is varied (top region: 1 PVP droplet ∼18% FVO, middle region: 2 PVP droplets ∼36% FVO, bottom region: 3 PVP droplets ∼54% FVO) to fabricate hierarchical porous collagen-based structures. The PVP concentration within each printed layer is calculated based on the volume ratio between the cross-linked collagen layer and PVP droplets. Different numbers of PVP droplets (1, 2 or 3 droplets per shot) are deposited homogeneously at each pre-defined positions (1 mm constant spacing in both x- and y-axes) on each collagen layer to manipulate the collagen fibrillogenesis process and to fabricate 6-layered graded collagen constructs (Fig. 4a). The discrete NaHCO3 droplets, that are deposited homogeneously below and above each printed collagen layer, facilitate complete crosslinking of the thin collagen layer rapidly51 and also serve as a binding agent between the two adjacent printed collagen layers (Fig. 4b). Hence, no delamination is observed between each printed collagen layer. The PVP droplets can be visualized as tiny spheres with hydrodynamic radii exerting an excluded volume effect (EVE) on the surrounding collagen molecules; an increasing PVP concentration hinders solute diffusion and accelerates collagen fibrillogenesis. The presence of macromolecules tunes the internal architecture of the collagen matrix and increases the pore size of the collagen matrix (Fig. 4c).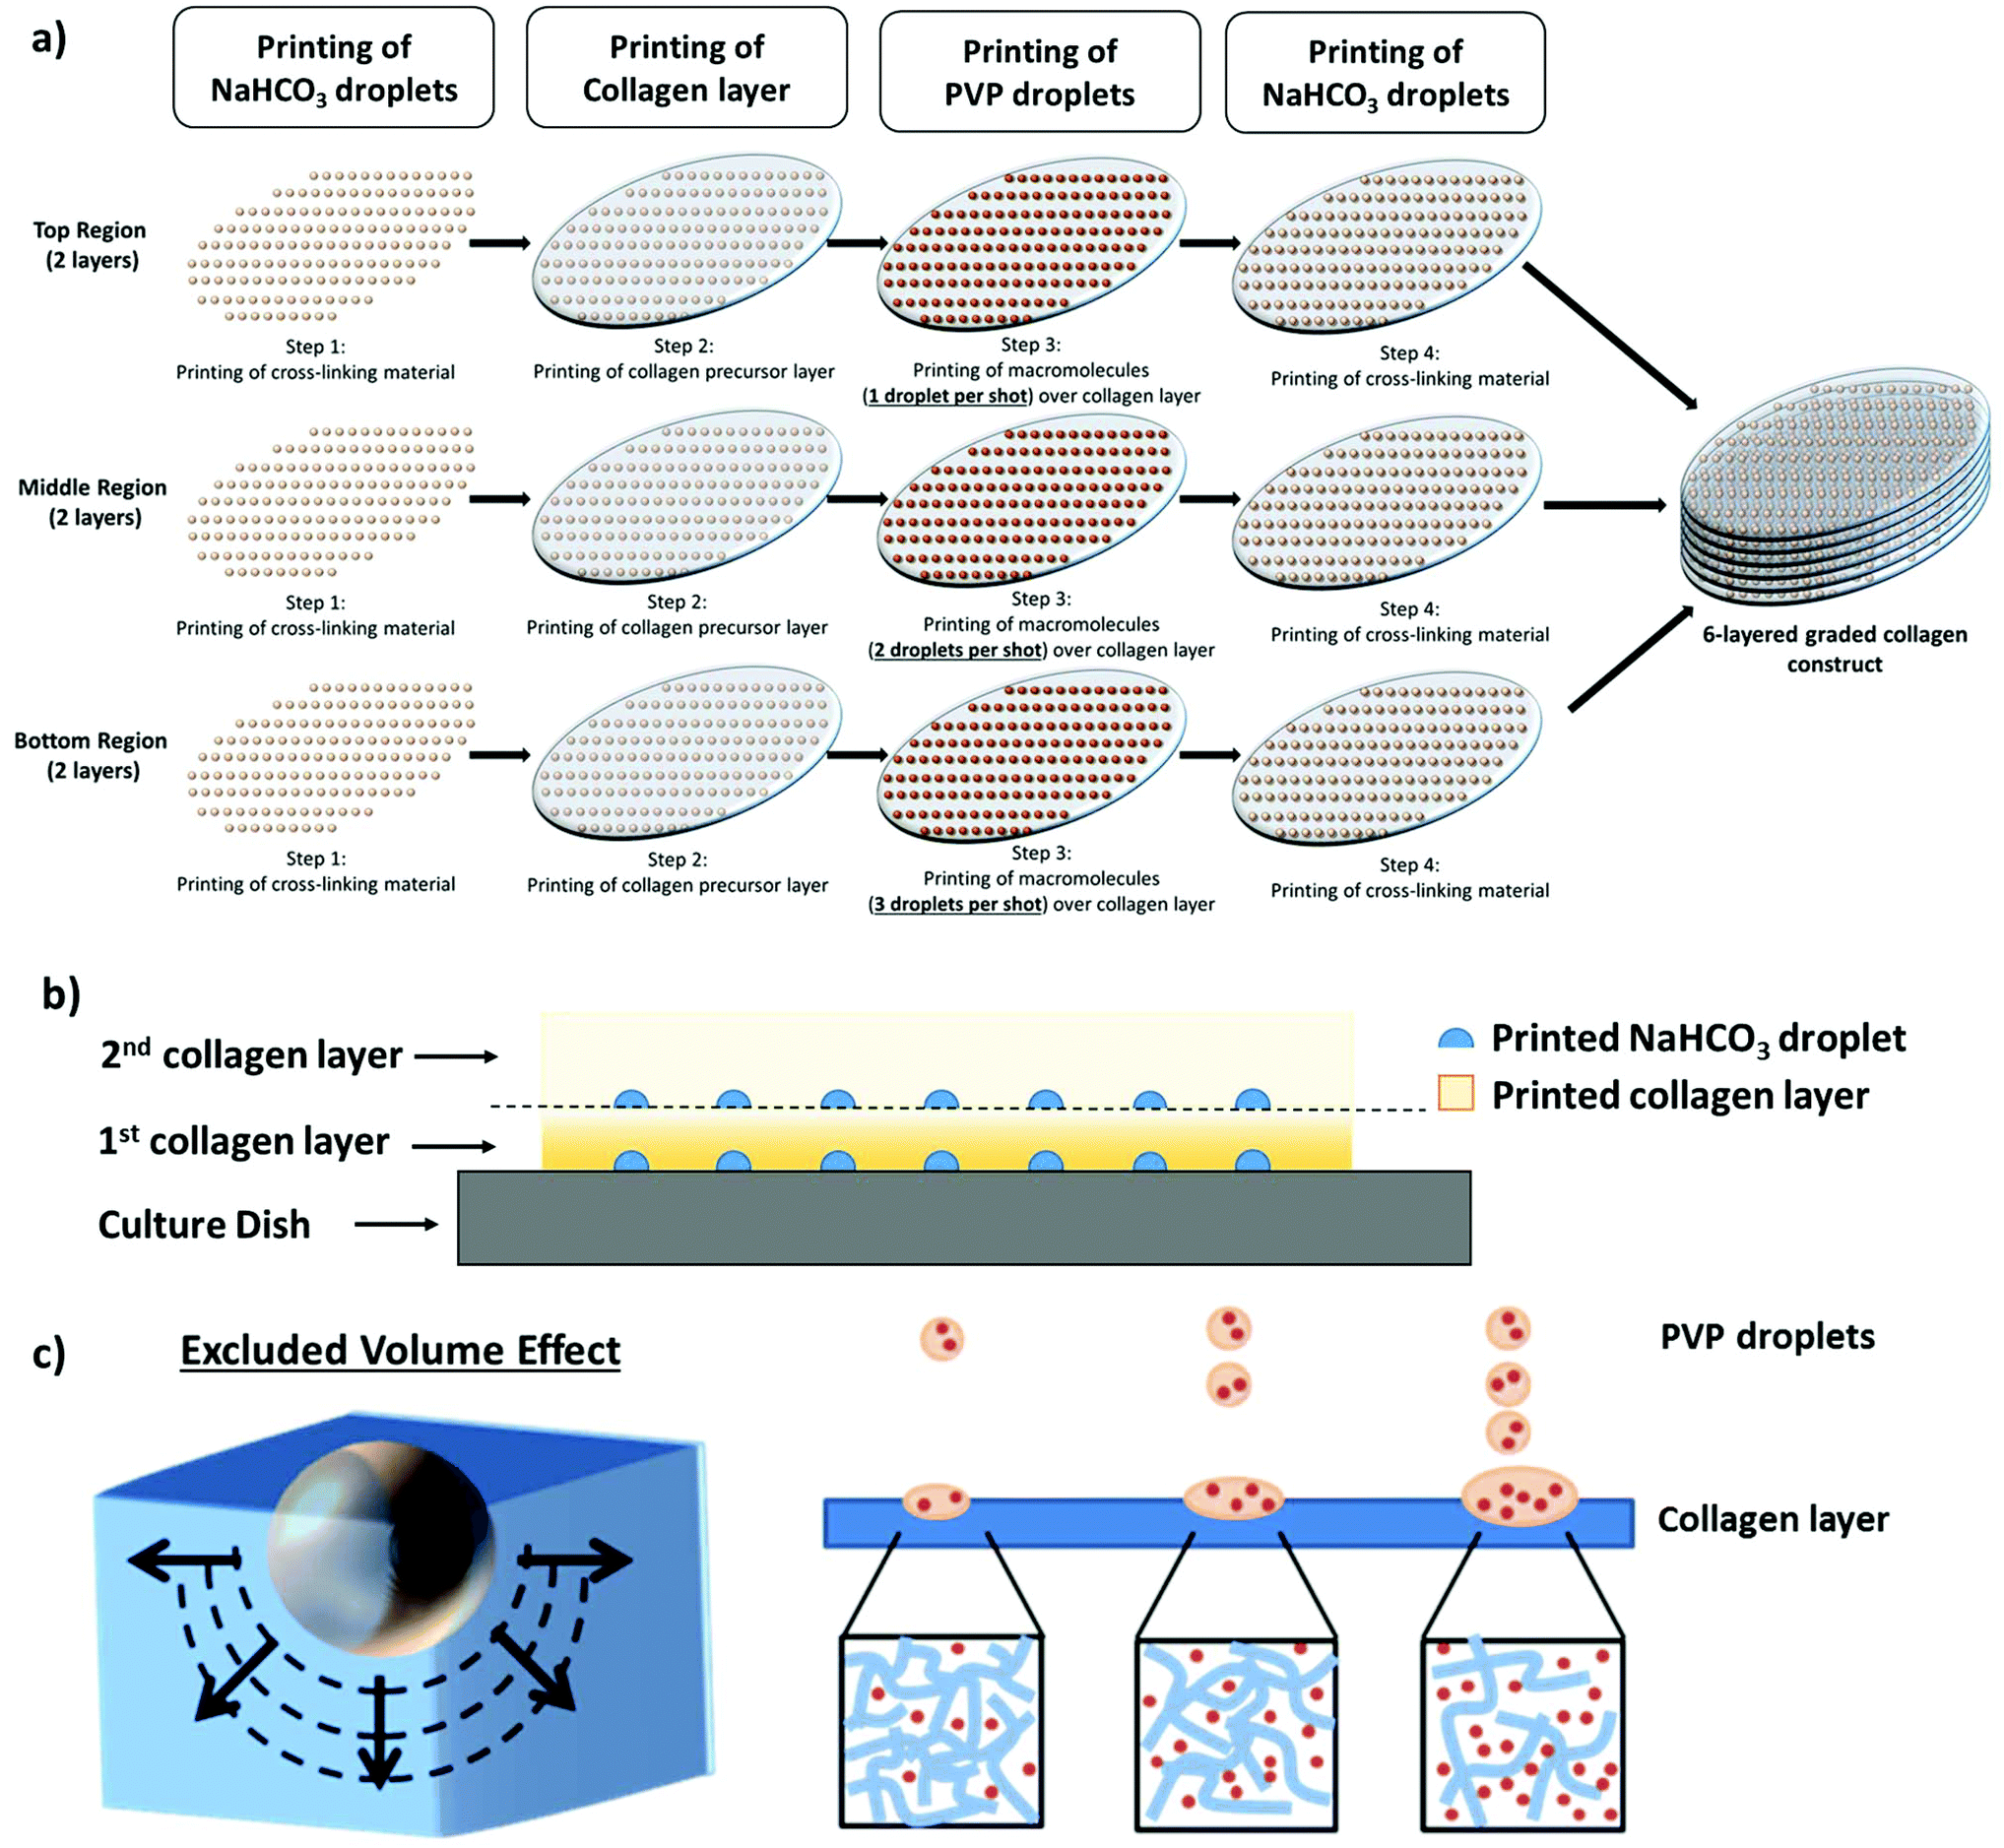 | ||
| Fig. 4 (a) Schematic drawing of the Bioprinting-Macromolecular Crowding Process (BMCP); 6-layered hierarchical collagen constructs are printed by a bottom-up layer-by-layer fabrication approach. The microstructure within each printed collagen layer is manipulated by the number of printed PVP droplets at each pre-defined position as indicated by the red dots. (b) Schematic drawing depicting the collagen crosslinking with printed sodium bicarbonate (NaHCO3) droplets and bonding between the adjacent collagen layers. (c) Influence of PVP concentration on the collagen architecture; increasing the number of PVP droplets exert a more significant excluded volume effect (EVE) on surrounding collagen fibrils. | ||
The representative FE-SEM images shown in Fig. 5a illustrate a hierarchical porous collagen structure that varies in pore size and porosity across the thickness of the entire construct. Further magnification of the hierarchical porous collagen constructs reveals distinct differences in the architecture of the 3 different regions. ImageJ analysis of the collagen architecture in the top region shows a low porosity of 7.4% with an average pore size of 0.50 ± 0.13 μm, whereas the collagen architecture of the bottom region shows a higher porosity of 46.7% with an average pore size of 1.62 ± 0.51 μm. A significant difference in the pore sizes across the different regions is observed. Generally, the results indicate that the pore sizes within each printed region increases with increasing PVP droplets (from 0.50 ± 0.13 μm in the top region to 1.62 ± 0.51 μm in the bottom region). The pre-defined hierarchical configuration of the printed collagen constructs (3 different regions of equal thickness – top, middle and bottom) is enclosed by the blue dotted lines (Fig. 5d). The printing strategy is dependent on the PVP concentration within each printed layer (from a high PVP concentration in the bottom region to a low PVP concentration in the top region). Due to the differences in the PVP concentration across the 3 printed regions, it is highly possible that the PVP macromolecules diffuse from the bottom region (high PVP concentration) to the top region (low PVP concentration). As such, we further characterize the printing accuracy of the pre-defined hierarchical configuration by analyzing the transition zone (significantly larger/smaller pore size than surrounding pore size within the same region – as indicated by the red dotted lines) between each region. The printed 6-layered constructs have an average thickness of 156.5 ± 5.7 μm; two different transition zones are observed (a transition zone of 11.2 ± 2.1 μm from the bottom to the middle region and a transition zone of 6.7 ± 1.9 μm from the middle to the top region). A higher PVP concentration (54% FVO) results in a higher diffusion flux in the bottom–middle region (formation of a wider transition zone) as compared to the middle–top region. Although it is challenging to restrict the macromolecule diffusion across the different regions, this bioprinting strategy facilitates the fabrication of 3D hierarchical porous collagen-based structures with a significant difference in pore sizes across each pre-defined region (top, middle and bottom). The importance of hierarchical porous structures in native tissues has been highlighted;13–15 fabrication of such hierarchical porous structures using conventional approaches remains highly challenging16 and the use of the proposed Bioprinting-Macromolecular Crowding Process (BMCP) has potential for fabrication of complex hierarchical porous structures for tissue engineering applications.
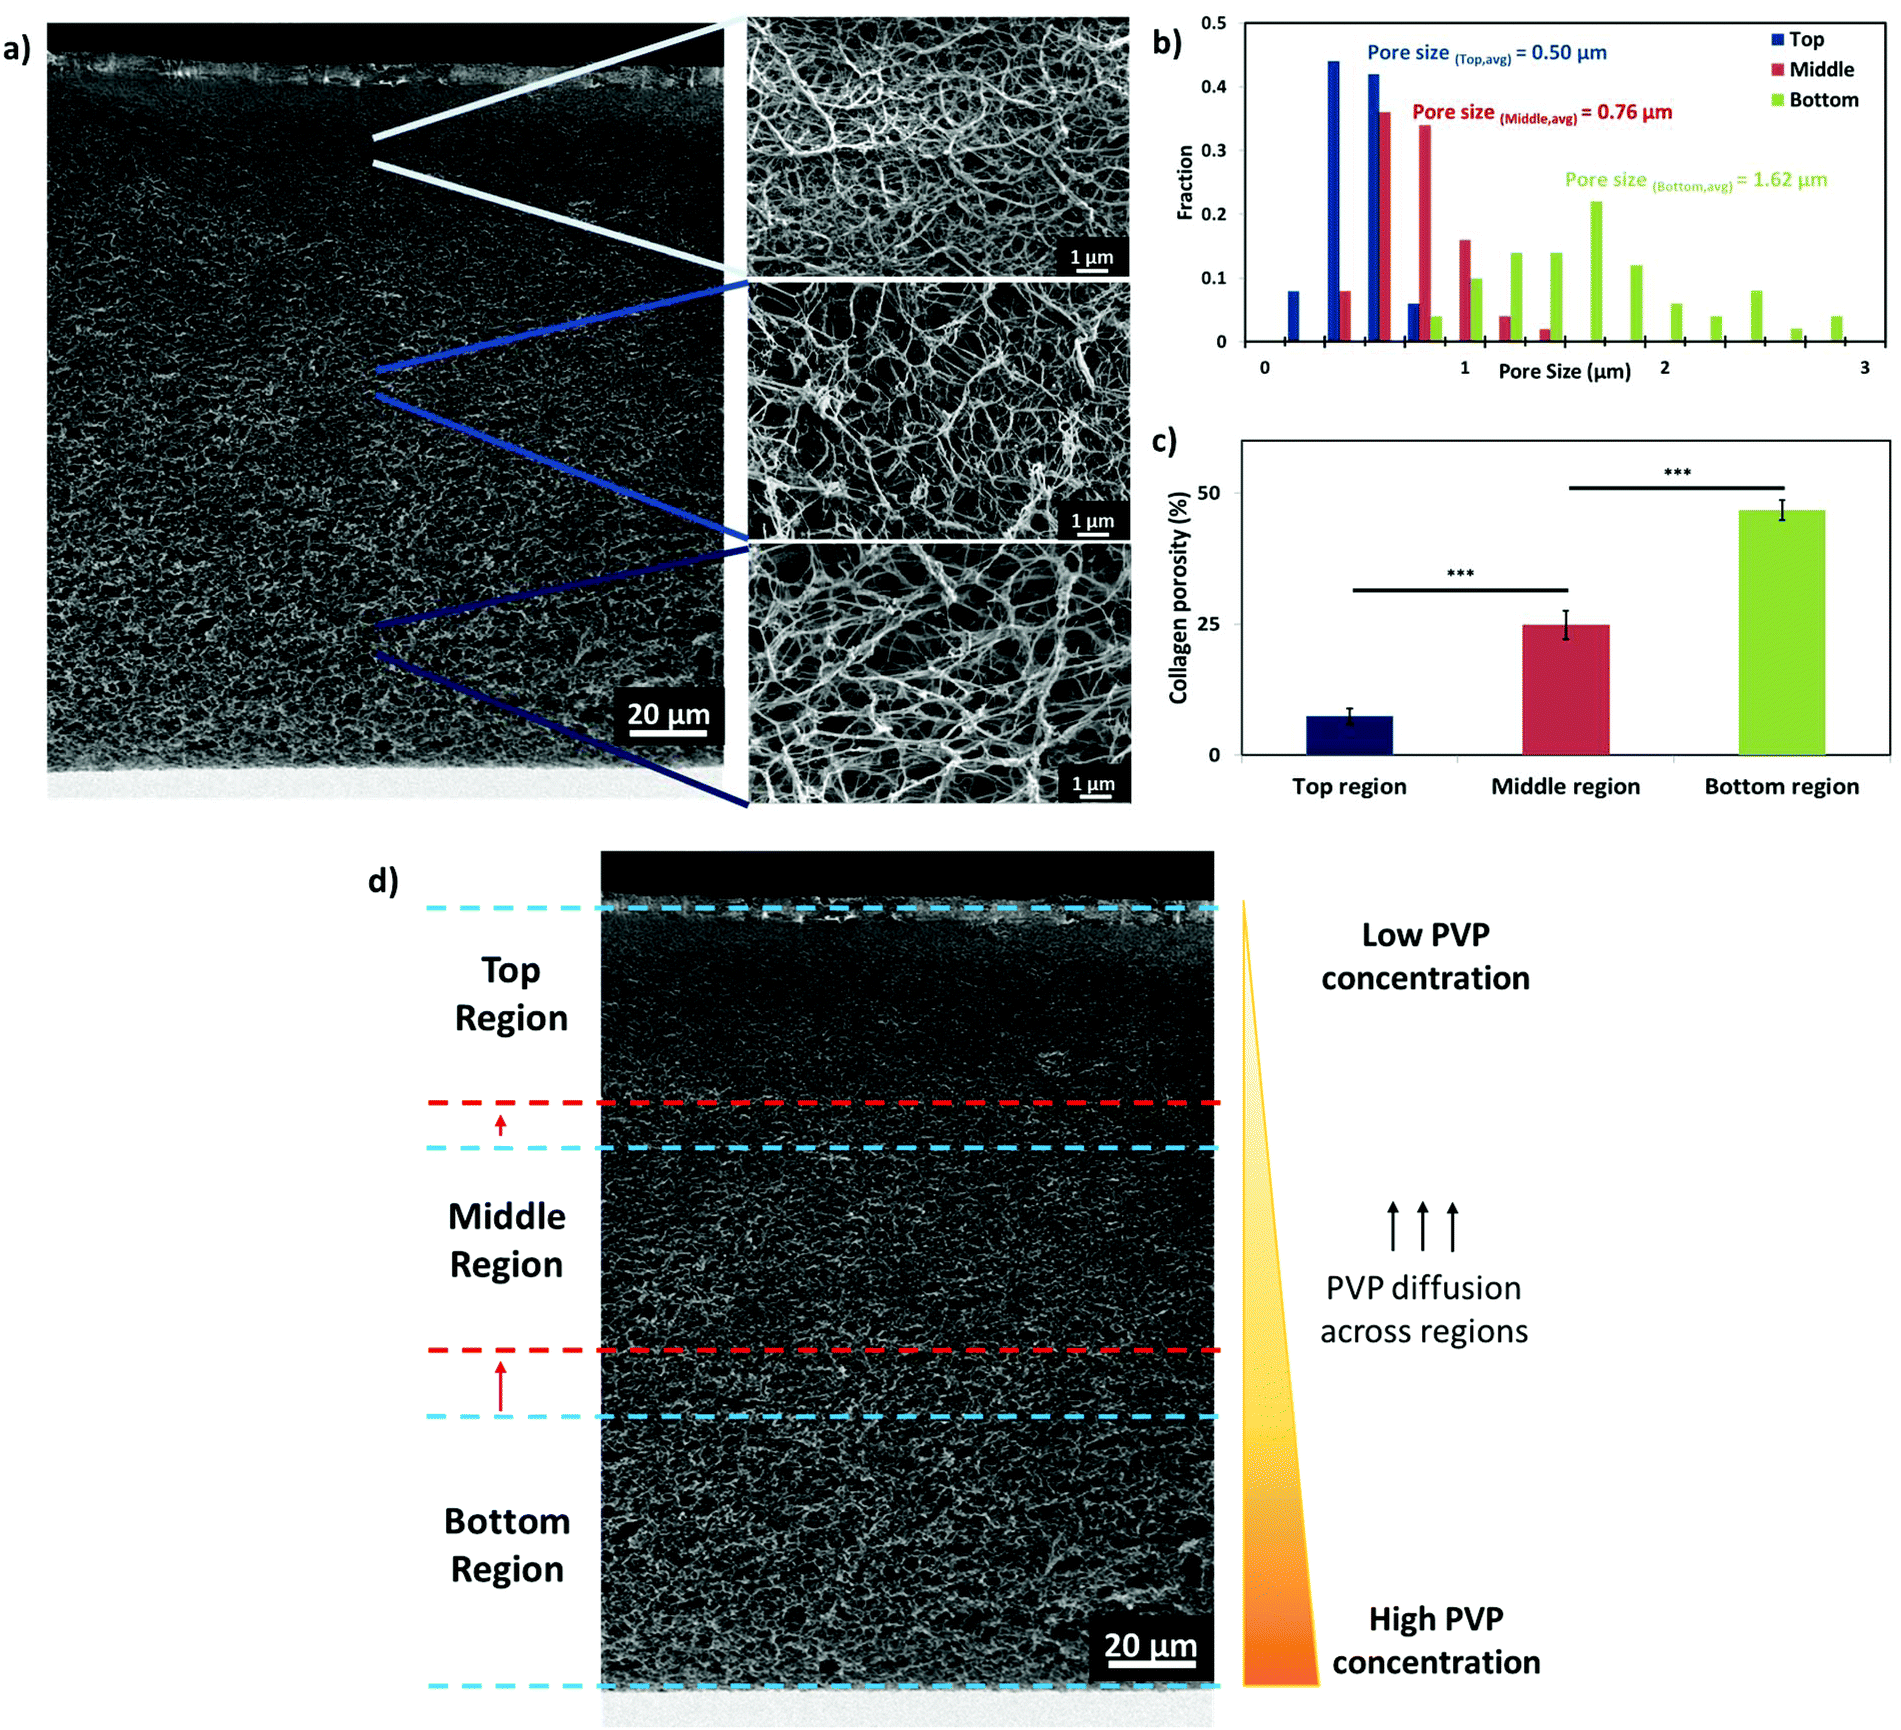 | ||
| Fig. 5 (a) FE-SEM images of representative bioprinted hierarchical porous collagen-based structures. Analysis of (b) pore size and (c) porosity of bioprinted collagen structures within the 3 different regions. (d) Printing accuracy according to the pre-defined hierarchical configuration; scale bar: 20 μm. | ||
Biocompatibility study
To demonstrate the feasibility of incorporating living cells in our proposed Bioprinting-Macromolecular Crowding Process (BMCP), an additional printing cartridge consisting of 1 million fibroblasts per ml in PVP-based bio-inks is used to print discrete cell droplets onto each printed collagen layer. The cells in the PVP-based bio-ink are printed in the following manner: NaHCO3–collagen–cells in PVP–NaHCO3. The printed constructs (consisting of 6-layered structures, n = 6) are then incubated over a period of 10 days to evaluate cell proliferation and spreading.To have a good visualization of the living cells within the printed collagen matrix, a live/dead staining kit is used to stain the primary fibroblasts within thin, transparent collagen constructs. It is to be noted that there is a presence of both “focused” and “unfocused” cells on the same plane in the microscopic images as the cells are deposited at all 6 different layers. The increase in the number of living cells (are represented by green colour in Fig. 6a) over a period of 10 days indicates that the BMCP is biocompatible and does not exert a detrimental effect on the printed cells. Quantitative analysis is also conducted using the PrestoBlue® assay; the measured relative fluorescence units (RFUs) are directly proportional to the number of living cells and all measured values are normalized to Day 3 for easy comparison. The normalized RFUs over a period of 10 days have confirmed that the primary cells are continually proliferating within the printed collagen constructs. Furthermore, ImageJ analysis of the stained living cells (cell perimeter and cell area) indicates that the elongated fibroblasts are gradually spreading within the collagen matrix (as highlighted by the increase in the cell perimeter over time in Fig. 6c). The experimental results from the PrestoBlue® assay and cell spreading profile serve as fundamental indicators to demonstrate that the BMCP is biocompatible with living cells. Therefore, our proposed BMCP can also be utilized for fabrication of hierarchical structures containing living cells.
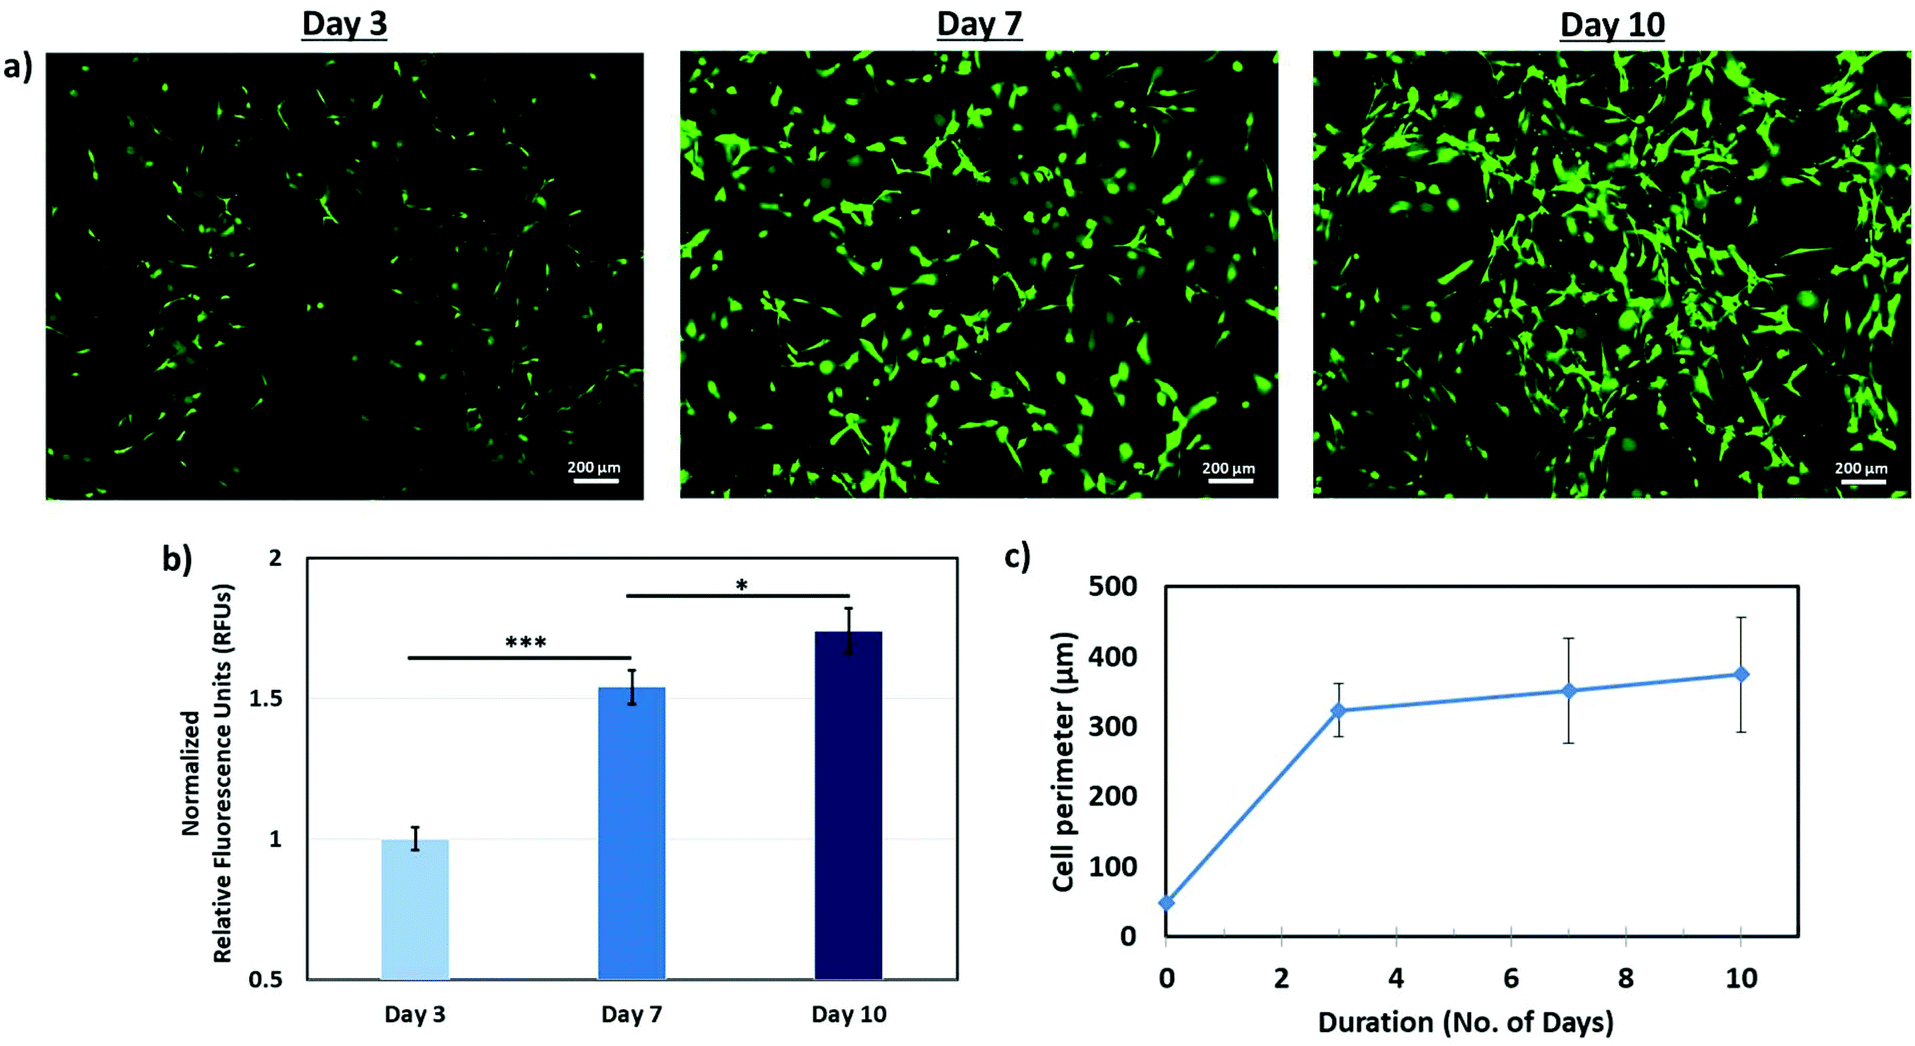 | ||
| Fig. 6 (a) Representative fluorescence images of printed primary normal human dermal fibroblasts within 3D hierarchical collagen matrices at different time intervals (Days 3, 7 and 10); scale bar: 200 μm. (b) Analysis of cell proliferation using normalized relative fluorescence units (RFUs) from the PrestoBlue® assay at different time intervals (Days 3, 7 and 10). Analysis of cell spreading by evaluating (c) the cell perimeter at different time intervals plotted with maximum/minimum error bars. | ||
Conclusions
This work demonstrates that collagen architectures (pore size and porosity) within each printed layer can be manipulated by varying the PVP concentration in our proposed Bioprinting-Macromolecular Crowding Process (BMCP). The uniform deposition of discrete droplets of cross-linkers (NaHCO3) and macromolecules (PVP) over each thin layer of printed collagen (∼20 μm) facilitates the rapid and homogeneous cross-linking. The presence of PVP macromolecules not only accelerates the collagen fibrillogenesis process but also tunes the collagen architecture in a controlled manner. The PVP macromolecules exert an excluded volume effect (which is dependent on both electrostatic repulsions and non-specific steric hindrances) on the surrounding collagen molecules; an increasing PVP concentration results in formation of larger pores and increased porosity within the 3D collagen matrices. Our work demonstrates a new printing strategy that facilitates the fabrication of hierarchical porous collagen-based constructs via the drop-on-demand bioprinting process in a highly-controlled manner. As collagen is a widely used biomaterial, this facile single-step bioprinting process could be useful for fabrication of complex 3D tissue models for tissue engineering applications.Author contributions
All authors designed the experiments and analysed the experimental results. W. L. Ng fabricated the samples and performed the experiments. M. H. Goh provided assistance with FE-SEM imaging.Conflicts of interest
The authors declare no conflict of interest.Acknowledgements
The authors would like to acknowledge the A*STAR Graduate Academy for the A*STAR Graduate Scholarship (Singapore) and funding support from the NTU Start-up Grant and SC3DP-NRF funding.References
- L. L. Hench and J. M. Polak, Science, 2002, 295, 1014–1017 CrossRef CAS PubMed.
- Q. L. Loh and C. Choong, Tissue Eng., Part B, 2013, 19, 485–502 CrossRef CAS PubMed.
- B. Walters and J. Stegemann, Acta Biomater., 2014, 10, 1488–1501 CrossRef CAS PubMed.
- W. Yang, L. Li, G. Su, Z. Zhang, Y. Cao, X. Li, Y.-P. Shi and Q. Zhang, Biomater. Sci., 2017, 5, 1766–1776 RSC.
- P. Pal, P. Dadhich, P. K. Srivas, B. Das, D. Moulik and S. Dhara, Biomater. Sci., 2017, 5, 1786–1799 RSC.
- J. Sapudom, X. Wu, M. Chkolnikov, M. Ansorge, U. Anderegg and T. Pompe, Biomater. Sci., 2017, 5, 1858–1867 RSC.
- K. M. Blum, T. Novak, L. Watkins, C. P. Neu, J. M. Wallace, Z. R. Bart and S. L. Voytik-Harbin, Biomater. Sci., 2016, 4, 711–723 RSC.
- D. J. Tobin, Chem. Soc. Rev., 2006, 35, 52–67 RSC.
- W. L. Ng, S. Wang, W. Y. Yeong and M. W. Naing, Trends Biotechnol., 2016, 34, 689–699 CrossRef CAS PubMed.
- W. L. Ng, Z. Q. Tan, W. Y. Yeong and M. W. Naing, Biofabrication, 2018, 10, 025005 CrossRef PubMed.
- K. M. Meek and C. Knupp, Prog. Retinal Eye Res., 2015, 49, 1–16 CrossRef PubMed.
- A. M. Ferreira, P. Gentile, V. Chiono and G. Ciardelli, Acta Biomater., 2012, 8, 3191–3200 CrossRef CAS PubMed.
- K. Leong, C. Chua, N. Sudarmadji and W. Yeong, ACS Biomater. Sci. Eng., 2008, 1, 140–152 CAS.
- X.-Y. Yang, L.-H. Chen, Y. Li, J. C. Rooke, C. Sanchez and B.-L. Su, Chem. Soc. Rev., 2017, 481–558 RSC.
- H.-B. Yao, H.-Y. Fang, X.-H. Wang and S.-H. Yu, Chem. Soc. Rev., 2011, 40, 3764–3785 RSC.
- X. Miao and D. Sun, Materials, 2009, 3, 26–47 CrossRef.
- W.-Y. Yeong, C.-K. Chua, K.-F. Leong and M. Chandrasekaran, Trends Biotechnol., 2004, 22, 643–652 CrossRef CAS PubMed.
- C. K. Chua and W. Y. Yeong, Bioprinting: principles and applications, World Scientific, 2014 Search PubMed.
- S. V. Murphy and A. Atala, Nat. Biotechnol., 2014, 32, 773–785 CrossRef CAS PubMed.
- R. R. Jose, M. J. Rodriguez, T. A. Dixon, F. Omenetto and D. L. Kaplan, ACS Biomater. Sci. Eng., 2016, 2, 1662–1678 CrossRef CAS.
- W. L. Ng, J. M. Lee, W. Y. Yeong and M. Win Naing, Biomater. Sci., 2017, 5, 632–647 RSC.
- S. Moon, S. K. Hasan, Y. S. Song, F. Xu, H. O. Keles, F. Manzur, S. Mikkilineni, J. W. Hong, J. Nagatomi, E. Haeggstrom, A. Khademhosseini and U. Demirci, Tissue Eng., Part C, 2010, 16, 157–166 CrossRef CAS PubMed.
- W. L. Ng, W. Y. Yeong and M. W. Naing, Proceedings of the International Conference on Progress in Additive Manufacturing, 2016, pp. 397–402, DOI: DOI:10.3850/2424-8967_V02-236.
- L. Koch, O. Brandt, A. Deiwick and B. Chichkov, Int. J. Bioprint., 2017, 3, 42–53 Search PubMed.
- Z. Zhang, R. Xiong, R. Mei, Y. Huang and D. B. Chrisey, Langmuir, 2015, 31, 6447–6456 CrossRef CAS PubMed.
- L. Koch, M. Gruene, C. Unger and B. Chichkov, Curr. Pharm. Biotechnol., 2013, 14, 91–97 CAS.
- C. Xu, M. Zhang, Y. Huang, A. Ogale, J. Fu and R. R. Markwald, Langmuir, 2014, 30, 9130–9138 CrossRef CAS PubMed.
- R. E. Saunders and B. Derby, Int. Mater. Rev., 2014, 59, 430–448 CrossRef CAS.
- T. Xu, W. Zhao, J.-M. Zhu, M. Z. Albanna, J. J. Yoo and A. Atala, Biomaterials, 2013, 34, 130–139 CrossRef CAS PubMed.
- W. L. Ng, W. Y. Yeong and M. W. Naing, Int. J. Bioprint., 2016, 2, 53–62 Search PubMed.
- I. T. Ozbolat and M. Hospodiuk, Biomaterials, 2016, 76, 321–343 CrossRef CAS PubMed.
- W. L. Ng, W. Y. Yeong and M. W. Naing, Procedia CIRP, 2016, 49, 105–112 CrossRef.
- W. L. Ng, W. Y. Yeong and M. W. Naing, Proceedings of the 1st International Conference on Progress in Additive Manufacturing, 2014, pp. 441–446, DOI: DOI:10.3850/978-981-09-0446-3_065.
- R. J. Ellis, Trends Biochem. Sci., 2001, 26, 597–604 CrossRef CAS PubMed.
- A. P. Minton, J. Biol. Chem., 2001, 276, 10577–10580 CrossRef CAS PubMed.
- R. R. Lareu, K. H. Subramhanya, Y. Peng, P. Benny, C. Chen, Z. Wang, R. Rajagopalan and M. Raghunath, FEBS Lett., 2007, 581, 2709–2714 CrossRef CAS PubMed.
- P. Benny, C. Badowski, E. B. Lane and M. Raghunath, Tissue Eng., Part A, 2014, 21, 183–192 CrossRef PubMed.
- A. Satyam, P. Kumar, X. Fan, A. Gorelov, Y. Rochev, L. Joshi, H. Peinado, D. Lyden, B. Thomas and B. Rodriguez, Adv. Mater., 2014, 26, 3024–3034 CrossRef CAS PubMed.
- C. Chen, F. Loe, A. Blocki, Y. Peng and M. Raghunath, Adv. Drug Delivery Rev., 2011, 63, 277–290 CrossRef CAS PubMed.
- R. Rashid, N. S. J. Lim, S. M. L. Chee, S. N. Png, T. Wohland and M. Raghunath, Tissue Eng., Part C, 2014, 20, 994–1002 CrossRef CAS PubMed.
- J.-Y. Dewavrin, N. Hamzavi, V. Shim and M. Raghunath, Acta Biomater., 2014, 10, 4351–4359 CrossRef CAS PubMed.
- V. Magno, J. Friedrichs, H. M. Weber, M. C. Prewitz, M. V. Tsurkan and C. Werner, Acta Biomater., 2017, 109–119 CrossRef CAS PubMed.
- W. L. Ng, W. Y. Yeong and M. W. Naing, Materials, 2017, 10, 190 CrossRef PubMed.
- F. Gobeaux, G. Mosser, A. Anglo, P. Panine, P. Davidson, M.-M. Giraud-Guille and E. Belamie, J. Mol. Biol., 2008, 376, 1509–1522 CrossRef CAS PubMed.
- Y. Li, A. Asadi, M. R. Monroe and E. P. Douglas, Mater. Sci. Eng., C, 2009, 29, 1643–1649 CrossRef CAS.
- K. E. Sung, G. Su, C. Pehlke, S. M. Trier, K. W. Eliceiri, P. J. Keely, A. Friedl and D. J. Beebe, Biomaterials, 2009, 30, 4833–4841 CrossRef CAS PubMed.
- M. Achilli and D. Mantovani, Polymers, 2010, 2, 664–680 CrossRef CAS.
- S. G. Kumbar, S. P. Nukavarapu, R. James, L. S. Nair and C. T. Laurencin, Biomaterials, 2008, 29, 4100–4107 CrossRef CAS PubMed.
- S.-M. Lien, L.-Y. Ko and T.-J. Huang, Acta Biomater., 2009, 5, 670–679 CrossRef CAS PubMed.
- M. M. Martino, F. Tortelli, M. Mochizuki, S. Traub, D. Ben-David, G. A. Kuhn, R. Müller, E. Livne, S. A. Eming and J. A. Hubbell, Sci. Transl. Med., 2011, 3 CAS , 100ra189.
- C. Li, A. Faulkner-Jones, A. R. Dun, J. Jin, P. Chen, Y. Z. Xing, Z. Q. Yang, Z. B. Li, W. M. Shu, D. S. Liu and R. R. Duncan, Angew. Chem., Int. Ed., 2015, 54, 3957–3961 CrossRef CAS PubMed.
| This journal is © The Royal Society of Chemistry 2018 |