 Open Access Article
Creative Commons Attribution 3.0 Unported Licence
Correction: ATR-FTIR spectroscopy with chemometric algorithms of multivariate classification in the discrimination between healthy vs. dengue vs. chikungunya vs. zika clinical samples
Marfran C. D.
Santos
a,
Yasmin M.
Nascimento
bc,
Joelma D.
Monteiro
bc,
Brenda E. B.
Alves
bc,
Marília F.
Melo
bc,
Anne A. P.
Paiva
bc,
Hannaly W. B.
Pereira
bc,
Leandro G.
Medeiros
bc,
Ingryd C.
Morais
c,
João Ciro
Fagundes Neto
bc,
José V.
Fernandes
b,
Josélio M. G.
Araújo
bc and
Kássio M. G.
Lima
*a
aBiological Chemistry and Chemometrics, Institute of Chemistry, Federal University of Rio Grande do Norte, Natal 59072-970, Brazil. E-mail: kassiolima@gmail.com; Tel: +55 84 3342 2323
bLaboratory of Molecular Biology for Infectious Diseases and Cancer, Department of Microbiology and Parasitology, Federal University of Rio Grande do Norte, Natal 59072-970, Brazil
cLaboratory of Virology, Institute of Tropical Medicine, Federal University of Rio Grande do Norte, Natal 59072-970, Brazil
First published on 12th September 2018
Abstract
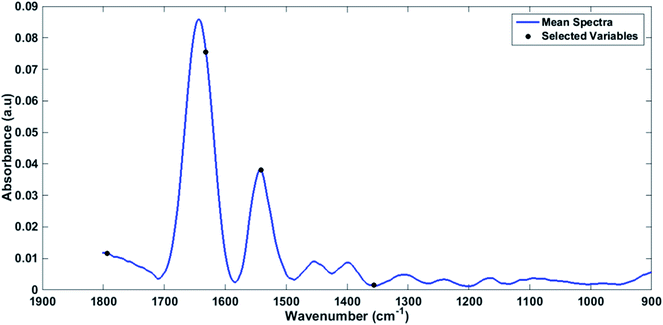
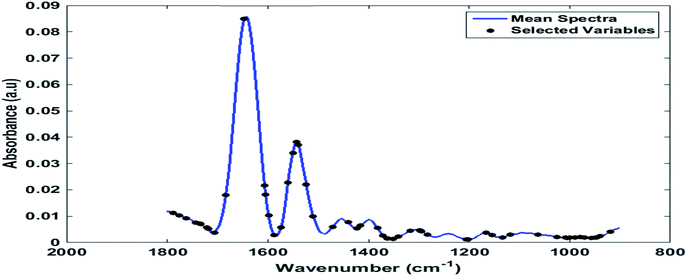
Correction for ‘ATR-FTIR spectroscopy with chemometric algorithms of multivariate classification in the discrimination between healthy vs. dengue vs. chikungunya vs. zika clinical samples’ by Marfran C. D. Santos et al., Anal. Methods, 2018, 10, 1280–1285.
The authors regret that incorrect images were included in Fig. 1–3 of the original article. The correct versions of Fig. 1–3 are presented below.
The Royal Society of Chemistry apologises for these errors and any consequent inconvenience to authors and readers.
| This journal is © The Royal Society of Chemistry 2018 |


