 Open Access Article
Creative Commons Attribution 3.0 Unported Licence
Raman spectroscopic library of medieval pigments collected with five different wavelengths for investigation of illuminated manuscripts†
G.
Marucci
 a,
A.
Beeby
 b,
A. W.
Parker
 c and
C. E.
Nicholson
 *a
*a
aNorthumbria University, Applied Sciences, Newcastle upon Tyne, NE1 8ST, UK. E-mail: k.nicholson@northumbria.ac.uk
bDurham University, Chemistry Department, DH1 3LE, UK
cCentral Laser Facility, Research Complex at Harwell, STFC Rutherford Appleton Laboratory, Harwell Campus, Didcot, OX11 0QX, UK
First published on 20th February 2018
Abstract
Raman spectroscopy is widely applied in the cultural heritage field to perform non-destructive measurements in situ, in order to identify materials, specifically pigments. The spectra collected can be challenging to interpret because certain source laser wavelengths may be absorbed by specific pigments, leading to large fluorescence backgrounds which obscure the weak Raman signals, or worse cause photodegradation of the sample. Furthermore, the reference spectra for a specific pigment obtained from a particular laser wavelength is not always available and is a crucial step in the detective work of pigment identification, especially when the resonance Raman effect can enhance some signals. As the range of lasers available increases, spectral libraries do not always record spectra acquired with the same wavelength used to carry out the measurements in field. In this work, reference spectra of 32 different compounds, mostly used in mediaeval manuscripts as pigments and inks, are recorded. Five different wavelengths were used as excitation sources. The aim is to provide a useful and more complete reference source to enable better planning of which laser wavelength is the most appropriate to study a specific set of pigments, and to allow comparisons between spectra acquired with the same wavelength, leading to the unequivocal pigment identification in a step by step manner.
Introduction
The use of analytical techniques for the study of objects of historical and artistic interest has increased in the last thirty years, providing useful information about artists' techniques, the provenance of materials, the nature of degradation processes,1 authentication and dating. The priceless nature of works of art has driven scientists to employ non-invasive and non-destructive techniques. This, coupled with the high insurance values of the articles, essentially prevents the analysis of objects in host laboratories: work has to be done within the conservation studios of the host institution. Over the past decade, this has been achieved with the advent of portable, instrumentation that can be taken to the host libraries or institutions for in situ investigations on the fly. Among the different techniques that are routinely employed for the analysis of artefacts or manuscripts, micro-Raman spectroscopy has proven to be an extremely powerful, due to its portability, specificity, spatial resolution and non-contact, non-destructive nature.2–31 The first effective application of Raman spectroscopy on cultural heritage objects was on illuminated manuscripts to identify pigments,32 and it has since been used to study a wide variety of materials including paper,33 binder media,34 inks,35,36 glass,5,9,10,18 ceramics and pottery,7,8 gemstones,20 stones and rocks from archaeological sites,19,30 degradation products.3 The availability of a spectral library is therefore essential to help identify the materials deployed.34,37–39 A few portable Raman spectrometers are now commercially available, but these should be used with extreme caution: in many examples, the power of the laser light source is much higher than we would advocate and may cause damage to the artefact. Furthermore, commercially available portable instruments usually have a single laser source, in rare cases two, which are not necessarily the best ones to investigate the wide variety of pigments that can be found on the same artefact, positive identifications can often be difficult.26,31 Indeed, pigments respond differently to laser irradiation according to their nature (dyes or pigments, colour, etc.). In certain cases, for example, where the laser wavelength matches or is close to the absorption bands of the pigment being analysed, the Resonance Raman effect can lead to excellent sensitivity, but, in some cases, some absorption can also lead to large interfering, luminescent background signals which hide the low intensity Raman signals. The selection of the most appropriate wavelength for the identification of pigments then is of great interest and importance.Portable equipment means compromises have to be made in comparison with fixed laboratory equipment. Portable systems tend to sacrifice spectral resolution and sensitivity.31 This work provides an updated library of pigments' Raman spectra acquired using different laser wavelengths in order to supply the best spectrum possible for each pigment for comparison to the data collected in situ. The pigments have been chosen as representative of those used in illuminated manuscripts between Vth–XVIth centuries in Europe.32,36,40–67
Experimental
Instrumentation
Two different Raman spectrometers have been used, equipped with different lasers. The first was a Horiba Jobin Yvon LabRAM HR confocal Raman microscope, equipped with a Peltier-cooled CCD and 50× LWD Leica objective. The instrument has four different laser sources available, 488 nm, 532 nm, 632.8 nm and 785 nm providing a diffraction limited laser spot from 1 to 2 μm diameter. Each laser source has different maximum power values that can be reduced using neutral density filter (100% 50%, 25%, 10%, 1%, 0.1% and 0.01%). Reported laser powers were measured after the objective lens in the sample plane. A 600 l mm−1 grating was used for measurements using the 532 nm, 632.8 nm and 785 nm laser, and an 1800 l mm−1 grating used for the 488 nm laser. The minimum wavenumber for each laser wavelength, dictated by the edge filters in the spectrometer were 200 cm−1, 120 cm−1, 70 cm−1, 100 cm−1 respectively for the 488 nm, 532 nm, 632.8 nm and 785 nm lasers. All the acquisition operations were controlled by Lab Spec 6-Horiba Scientific software.For excitation at 830 nm, a Renishaw InVIa micro-Raman spectrometer (Rutherford Appleton Laboratory, Harwell Campus, Didcot), with 830 nm laser source, a silicon CCD detector and Nikon L-PLAN SLWD 50×/0.45. The resulting laser spot was circa 2 μm in diameter. The spectral range recorded was 70–1800 cm−1, with a 1200 l mm−1 grating. The maximum laser power was 55 mW, and this could be reduced to lower levels (50%, 25%, 10%, 5%, 1%, 0.5%, 0.1% and 0.05%). Again, the laser power was recorded after the objective in the sample plane.
A silicon standard sample was used as reference for calibration (520 cm−1). The time of acquisitions and number of accumulations was decided on a sample-by-sample basis.
To be able to compare spectra acquired with different devices, spectra were corrected for the instrumental response by comparison to the spectra obtained for a broad-band source.68,69 A stable white light source (HL-2000-CAL Ocean Optics), whose spectral distribution was known (and can be approximated by a black body radiator of 2939 K), was used to generate a correction curve. The lamp emission spectrum was provided as photons/(Δλt), where Δλ is the bandwidth detected by the spectrometer, and t the time unit. It had to be multiplied by λ2 (where λ is the emission wavelength), in order to obtain the spectrum in terms of photons/t × Δ![[small upsilon, Greek, macron]](https://www.rsc.org/images/entities/char_e0d5.gif) of Raman shift. The calibration lamp spectrum was recorded for every wavelength laser using the same scan-conditions as used for the sample measurements and covering the same wavenumber range. Using this correction curve, all of the Raman spectra were corrected for instrument response. No background subtraction was performed, since one of the goals of this work was to provide a library that helps to decide which the best wavelength to investigate a certain pigment is, so any luminescent background that may detract from the signal or prove diagnostic was recorded. All the spectra have been normalized to a maximum intensity of 1 in the graphs (Fig. 1–30) available in the ESI (ESI†). In the ESI,† the raw ASCII data of the spectra can be found. Corrected for the instrument response. Thus, relative intensities of peaks may be obtained and compared directly.
of Raman shift. The calibration lamp spectrum was recorded for every wavelength laser using the same scan-conditions as used for the sample measurements and covering the same wavenumber range. Using this correction curve, all of the Raman spectra were corrected for instrument response. No background subtraction was performed, since one of the goals of this work was to provide a library that helps to decide which the best wavelength to investigate a certain pigment is, so any luminescent background that may detract from the signal or prove diagnostic was recorded. All the spectra have been normalized to a maximum intensity of 1 in the graphs (Fig. 1–30) available in the ESI (ESI†). In the ESI,† the raw ASCII data of the spectra can be found. Corrected for the instrument response. Thus, relative intensities of peaks may be obtained and compared directly.
Classification of the spectra
A classification of the quality of the spectra collected (Table 1) was made, in order to establish the optimum wavelength for investigating the presence of a specific pigment, and which wavelength provides the maximum number of positive identifications. To classify them, a criterion to value the quality of the spectrum had to be established and the signal to noise ratio was considered appropriate. Even though this parameter is meaningful if applied to a single peak or band it does not give an evaluation of the whole spectrum, since to identify a Raman spectrum a “finger printing” approach is often used; analysing the most intense peak and then the following less intense ones to confirm or refute the identification. In this study only the signal to noise ratio of highest peak of every spectrum was used to evaluate the whole spectrum. However, spectra showing only one peak were not included because a single peak is insufficient to unequivocally identify a pigment.70 In spectroscopy, the signal to noise ratio, SNR, is defined aswhere I is the average intensity (net peak height – background) of the signal and σ is its standard deviation.71 However, the noise is the result of different sources. So that
| σ = √(σs2 + σb2 + σd2 + σr2) |
| Pigment | 488 nm | 532 nm | 632.8 nm | 785 nm | 830 nm |
|---|---|---|---|---|---|
| Minium | + | + | ++ | ++ | ++ |
| Haematite | ± | + | + | + | ++ |
| Red ochre | + | + | + | + | + |
| Caput mortuum | + | + | + | ++ | ++ |
| Vermillion | + | + | ++ | ++ | ++ |
| Cinnabar | + | + | ++ | ++ | ++ |
| Realgar | − | ± | ++ | ++ | ++ |
| Kermes | − | − | − | − | − |
| Cochineal | ± | + | − | + | − |
| Orcein | + | + | + | + | + |
| Brazil wood | − | − | − | − | − |
| Purple madder | + | + | + | + | + |
| Alizarin crimson | + | ± | + | + | + |
| Alizarin purple | + | − | − | + | + |
| Raw umber | ± | + | ± | − | + |
| Sepia | − | + | + | + | + |
| Indigo | ± | + | + | + | ++ |
| Azurite | + | + | + | + | + |
| Ultramarine | + | ++ | + | + | + |
| Orpiment | + | ++ | ++ | ++ | ++ |
| Lead tin yellow I | ++ | ++ | ++ | ++ | ++ |
| Yellow ochre | + | + | + | + | ++ |
| Massicot | ++ | ++ | ++ | ++ | ++ |
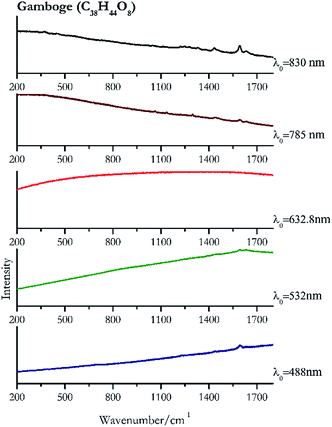
| Gamboge | + | ± | − | + | + |
| White lead | + | + | ++ | ++ | ++ |
| Verdigris | + | + | + | ± | + |
| Malachite | + | + | + | − | + |
| Carbon black | + | + | + | ± | + |
| Ivory black | + | + | + | + | + |
| Lamp black | + | + | + | + | + |
| Iron gall | − | + | − | ± | ± |
| Bistre | + | ± | + | + | + |
To calculate the signal to noise ratio, the contribution of the dark noise and the read out noise were considered negligible, which is appropriate for the scientific grade CCD camera employed in the spectrometers, while the background noise was the result of the square root of the difference of intensities between the spectra before and after background correction. A peak may be defined as at least 2 or 3 times the intensity of the noise.70,72 So that the spectra were classified as “very good” spectrum (++) when the SNR > 100; “good spectrum” (+) when 3 < SNR < 100; “spectrum not identifiable” (±) when SNR < 3 and/or the spectrum presented only one peak; “no spectrum” (−) when no spectrum at all was recorded.
Materials
Pigments and inks investigated were both pigments and dyes, chosen in accordance with the literature, most commonly used in manuscripts between Vth–XVIth centuries, supplied by L. Cornelissen & Son (London) and Kremer Pigmente GmbH & Co. KG (Aichstetten, Germany). Iron gall ink, Brazil wood and kermes were made following ancient recipes.74 Analysis of pure pigments using the 532 nm and 632.8 nm lasers was made by sampling through the wall of a glass vial containing the pigments. Indeed, the use of a confocal microscope allows collecting radiation coming only from the focal plane, so that there is no signal related to the glass.72 However, using the 785 nm excitation source the spectra presented a large background at around 1400 cm−1 (ref. 75) so pellets of pigments were prepared to obtain Raman spectra without glass contribution. The measurements performed with 488 nm and 830 nm excitation were also run on pellets. They were prepared by pressing a mixture of the pigment and a 10% w/w of a wax binder, (BM-0002-1CEREOX® Licowax C Micropowder). To ensure the homogeneity of the samples the mixture of wax and pigment was shaken for 3 minutes with a frequency of 25 s−1, and pellets were then formed using a hydraulic press, with 9 tonnes per surface pressure. The spectra collected do not show any signals attributable to the wax.Results and discussion
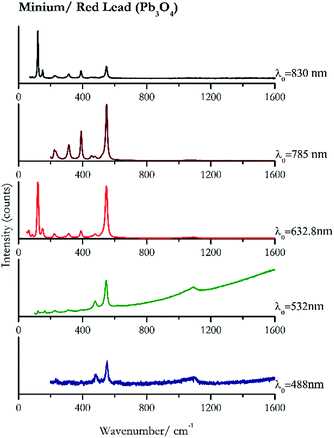
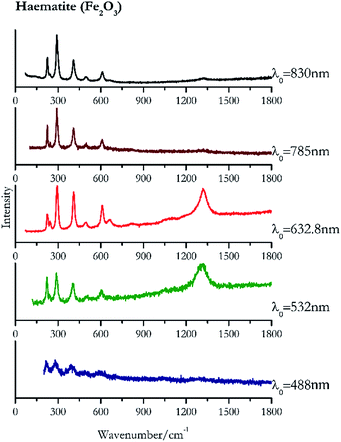
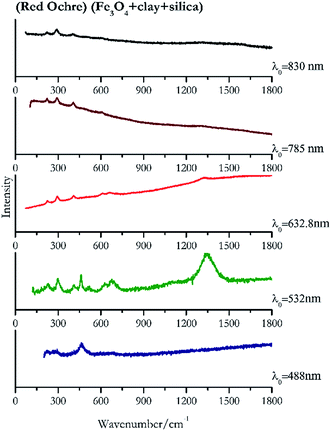
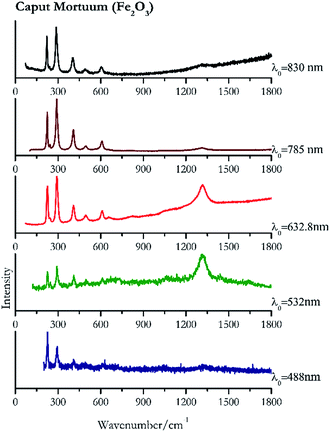
A total of 32 pigments have been analysed using 5 different incident wavelength laser sources. The spectra are represented in Fig. 1–30 (in the ESI†). They are ordered by observed colour (red, purple, blue, yellow, white, green, black and inks). In Table 1 the positive identifications are summarized. Tables 2 to 6 list the wavenumber of the main peaks detected, with references from previous works,37–39,76–81 where spectra have been reported for similar conditions. Each table refers to a single wavelength laser source. The first column provides the highest observed peak in the measured spectral range for that wavelength. In the second column the other peaks, in decreasing order of intensity, can be found; in the other columns the name and the compounds of the pigment. In the last column, the values of power density are recorded.| λ 0 = 488 nm | Spectral range (200–2500 cm−1) | Pigment name | Power density mW μm−2 | |
|---|---|---|---|---|
| Main band cm−1 | ||||
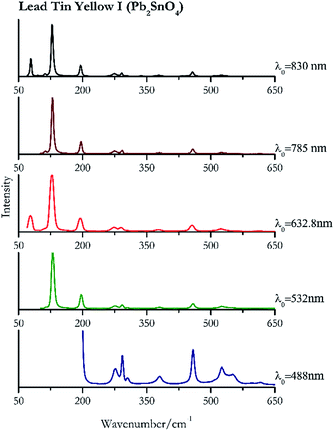
| 200 | 458, 291, 524, 276, 550sh, 379, 305, 616, 595 | Lead tin yellow I | Tin(II) sulfide, lead(II) stannate, Pb2SnO4 | 3.90 |
| 225 | 291, 409 | Caput Mortuum | Iron(III) oxide, Fe2O3 | 0.39 |
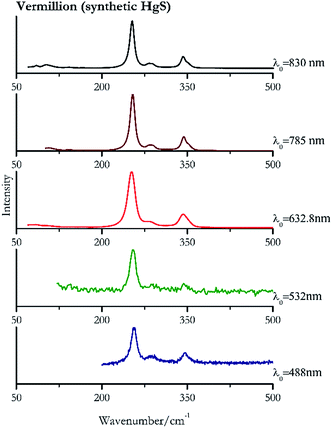
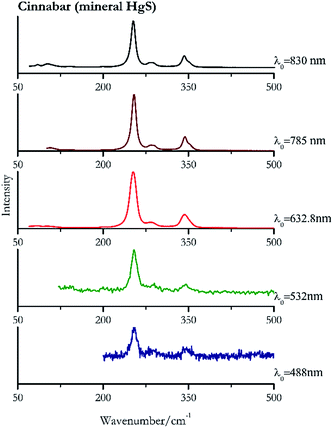
| 255 | 346 | Cinnabar | Mercury(II) sulfide, HgS | 0.39 |
| 255 | 346, 288sh | Vermillion | Synthetic mercury(II) sulfide, HgS | 0.39 |
| 280br | 391 | Haematite | Iron(III) oxide, Fe2O3 | 1.02 |
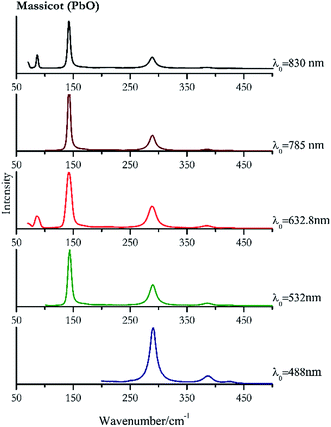
| 289 | 386, 424, | Massicot | Lead(II) oxide, PbO | 3.90 |
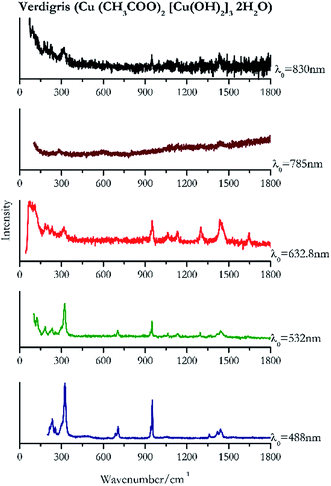
| 324 | 951, 233, 942sh, 1440, 1419, 216sh, 255, 1360, 688, 1668, 1055 | Verdigris | Copper(II) acetate, Cu (CH3COO)2 [Cu(OH)2]3 2H2O | 3.90 |
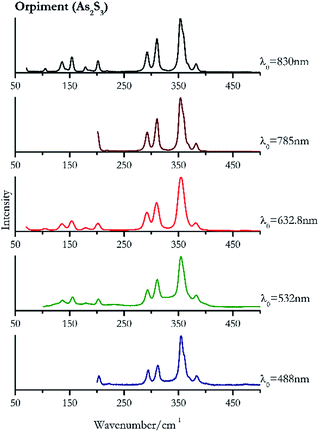
| 354 | 311, 294, 382, 203, | Orpiment | Arsenic(III) sulfide, As2S3 | 3.90 |
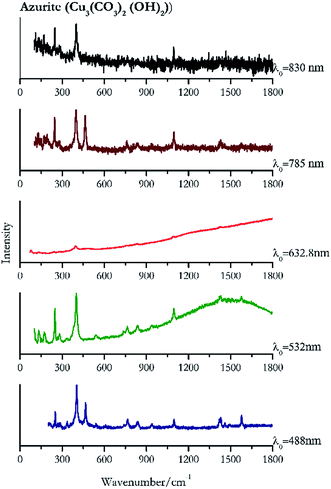
| 402 | 466, 1575, 1429, 1420, 1095, 249, 765, 838,39 938, 1460, 1495, 541, 281, 267 | Azurite | Basic copper(II) carbonate, Cu3(CO3)2 (OH)2) | 1.99 |
| 459 | 1497br, 1617br | Raw umber | Iron(III) oxide, Fe2O3 + Manganese(IV) oxide, MnO2 | 3.90 |
| 461 | 283br, 695br | Red ochre | Iron(III) oxide, Fe3O4 + clay + silica | 3.90 |
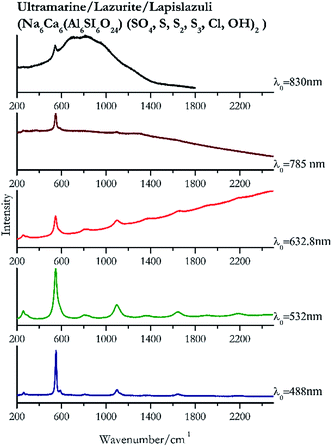
| 549 | 584, 1096, 1648, 256, 806, 2191, 1363 | Ultramarine | Na6Ca6(Al6SI6O24) (SO4, S, S2, S3, cl, OH)2 | 3.90 |
| 550 | 480, 1094br, 390,37 233 | Minium/Red lead | Lead (II, IV) oxide, Pb3O4 | 0.39 |
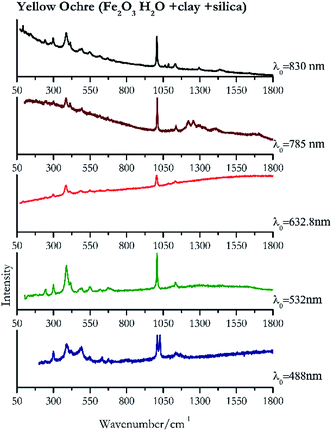
| 1027 | 1008, 385, 1133, 491, 418sh, 297, 632.8, 547, 676, 241, 1084 | Yellow ochre | Iron(III) oxide hydrate, Fe2O3 H2O + clay + silica | 3.90 |
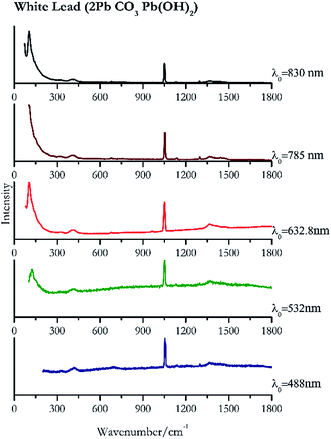
| 1052 | 1056sh, 1365br, 1297, 693, 422br, 1134 | White lead | Basic lead(II) carbonate, 2PbCO3 Pb(OH)2 | 0.39 |
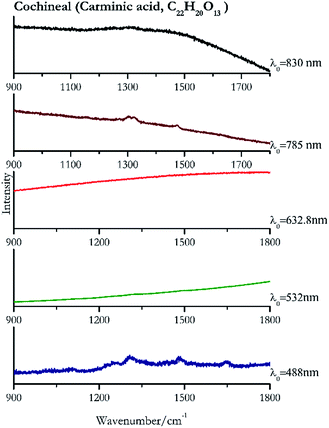
| 1306 | 1479,82 1702,82 1255 | Cochineal | Carminic acid, C22H20O13 | 0.08 |
| 1321 (ref. 82) | 1478, 1280sh, 1161 (ref. 82) | Purple madder | Alizarin C14H8O4 and purpurin C14H8O5 | 3.99 |
| 1322 (ref. 82) | 1476,82 1297sh, 1271 | Alizarin purple | Alizarin C14H8O4 | 3.90 |
| 1477 (ref. 82) | 1325,82 1290,82 1163, 906, 839, 660,82 480 | Alizarin crimson | Alizarin C14H8O4 | 3.90 |
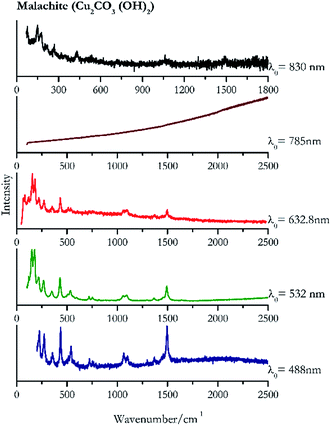
| 1495 | 434, 225, 272, 536, 1062, 1103, 1367, 356, 1297, 721, 755 | Malachite | Basic copper(II) carbonate, Cu2CO3 (OH)2 | 3.90 |
| 1573br | 1347br | Lamp black | Carbon, C | 3.90 |
| 1581br | 1361 br | Carbon black | Carbon, C | 3.90 |
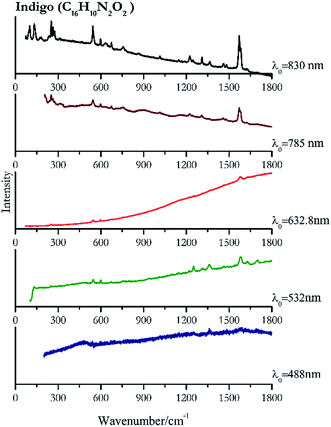
| 1585 | 1703, 1363, 1252 | Indigo | Indigo, C16H10N2O2 | 3.90 |
| 1592br | Bistre | Wood soot, carbon C | 1.99 | |
| 1594br | 1362br, 469br | Ivory black | Calcium hydroxide phosphate, Ca5(OH) (PO4)3 + carbon, C | 3.90 |
| 1594 | 1632 | Gamboge | Gambogic acid, C38H44O8 | 3.90 |
| 1642 | 1608, 1505br, 1278, 1192br, 489 | Orcein | Natural red 28, C28H24N2O7 | 3.90 |
| λ 0 = 532 nm | Spectral range (100–2500 cm−1) | Pigment name | Power density mW μm−2 | |
|---|---|---|---|---|
| Main band cm−1 | ||||
| 130 (ref. 83) | 96,83 458, 293, 275, 252, 379,77 304, 615 (ref. 77) | Lead tin yellow I | Tin(II) sulfide, lead(II) stannate, Pb2SnO4 | 2.06 |
| 143 (ref. 77) | 290, 386, 425, 169sh | Massicot | Lead(II) oxide, PbO | 0.82 |
| 178 (ref. 76, 77 and 84) | 151,76,77 169,76,84 430,77 220,77 266,76,84 1491,76,84 203sh, 532,76,77 535sh,76,77,84 350sh,76,77 509,77 1092,76,84 1060,76,77 720,76,84 1459,77 751,77,84 593 | Malachite | Basic copper(II) carbonate, Cu2CO3 (OH)2 | 2.06 |
| 254 | 290, 342 | Cinnabar | Mercury(II) sulfide, HgS | 0.08 |
| 254 (ref. 77) | 343,77 290 | Vermillion | Synthetic mercury(II) sulfide, HgS | 0.08 |
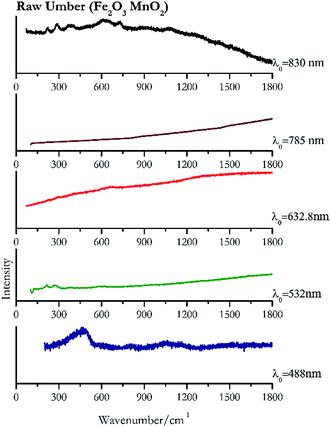
| 268 | 214, 582br | Raw umber | Iron(III) oxide, Fe2O3 + Manganese(IV) oxide, MnO2 | 8.21 |
| 324 | 949,76,84 127,76,84 1439,76,84 297, 183,77 234,76 703,76,77 1296, 254,84 1061,76 1133, 1641br | Verdigris | Copper(II) acetate, Cu (CH3COO)2 [Cu(OH)2]3 2H2O | 2.06 |
| 354 (ref. 83) | 311, 293, 382, 154, 203,83 136,83 180,83 234, 490 br, 589br | Orpiment | Arsenic(III) sulfide, As2S3 | 0.82 |
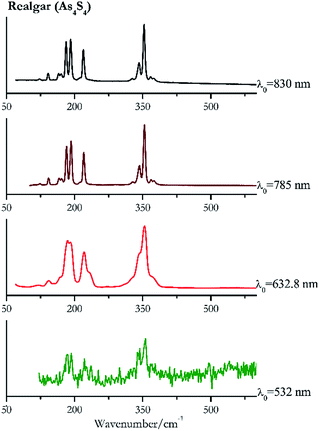
| 356 (ref. 83) | 343,77 338, 192,83 183,77 221 | Realgar | Arsenic(III) sulfide, As4S4 | 0.01 |
| 400 (ref. 77) | 247,77 1096,77 1578,77 1430,77 1417, 132, 171, 281,77 178, 138,77 266, 154, 839, 764,77 542, 737,77 336 | Azurite | Basic copper(II) carbonate, Cu3(CO3)2 (OH)2) | 2.06 |
| 547 | 1089br, 479, 474, 389, 313, 227, 163(a) | Minium/Red lead | Lead (II, IV) oxide, Pb3O4 | 0.82 |
| 548 (ref. 77) | 1097,77 1647,77 2191,77 1644,77 257,77 864, 275, 1369, 1905 (ref. 77) | Ultramarine | Na6Ca6(Al6SI6O24) (SO4, S, S2, S3, cl, OH)2 | 2.06 |
| 1007 | 388, 416, 299,77 1138, 245,83 549, 495, 675 | Yellow ochre | Iron(III) oxide hydrate, Fe2O3 H2O + clay + silica | 2.06 |
| 1050 (ref. 77) | 131, 1370br,77 151sh, 418sh, 1635 | White lead | Basic lead(II) carbonate, 2Pb CO3 Pb(OH)2 | 0.82 |
| 1316 | 291, 227, 409, 613, 497, 247 | Caput Mortuum | Iron(III) oxide, Fe2O3 | 0.82 |
| 1321 | 1479, 1159 (ref. 77) | Purple madder | Alizarin C14H8O4 and purpurin C14H8O5 | 0.82 |
| 1322 | (b) | Cochineal | Carminic acid, C22H20O13 | 0.82 |
| 1322 | 1478 | Alizarin purple | Alizarin C14H8O4 | 0.08 |
| 1323 | 290, 223, 407, 600, 238 | Haematite | Iron(III) oxide, Fe2O3 | 0.82 |
| 1351 | 460, 299, 674, 629, 230, 414 | Red ochre | Iron(III) oxide, Fe2O3 + clay + silica | 0.82 |
| 1480 (ref. 77) | 1326 | Alizarin crimson | Alizarin C14H8O4 | 0.08 |
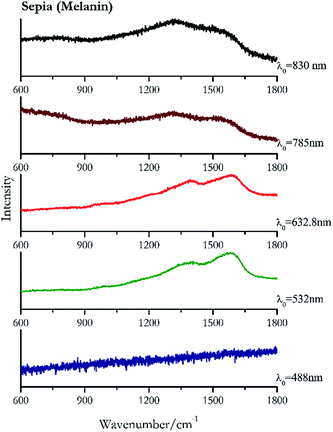
| 1574br | 1405br | Sepia | Melanin C18H10N2O4 | 0.82 |
| 1572 | 1335 | Lamp black | Carbon, C | 8.21 |
| 1582 | 1361, 1701, 1251, 1628, 546, 598, 1461, 1485, 1312, 941, 756, 249, 1222 | Indigo | Indigo, C16H10N2O2 | 8.21 |
| 1582 | 1346 | Carbon black | Carbon, C | 8.21 |
| 1587 | 1351 (ref. 77) | Ivory black | Calcium hydroxide phosphate, Ca5(OH) (PO4)3 + carbon, C | 8.21 |
| 1592br | Bistre | Wood soot | 2.06 | |
| 1600 | 1632.8 | Gamboge | Gambogic acid, C38H44O8 | 2.06 |
| 1639 | 1499, 1335, 1275, 1191, 483 | Orcein | Natural red 28, C28H24N2O7 | 2.06 |
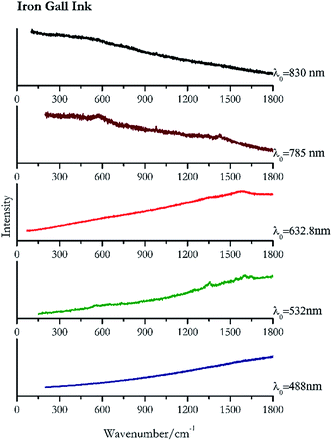
| 1644 | 1601, 1353, 560(c) | Iron Gall ink | Ferric Gallate C21H15FeO15 | 0.96 |
| λ 0 = 632.8 nm | Spectral range (50–2500 cm−1) | Pigment name | Power density mW μm−2 | |
|---|---|---|---|---|
| Main band cm−1 | ||||
| 73 | 1438, 950, 183, 232, 1300, 315, 1133, 1647, 1064(b) | Verdigris | Copper(II) acetate, Cu (CH3COO)2 [Cu(OH)2]3 2H2O | 1.16 |
| 104 | 70, 1050, 1365, 1475br, 412, 963, 677, 325(a) | White lead | Basic lead(II) carbonate, 2Pb CO3 Pb(OH)2 | 2.63 |
| 121 (ref. 37, 38 and 77) | 549,37,38,77 149,77 390,37,38,77 65, 223,37,38,77 313,37,38,77 480,37,38 84,38 456sh, 290sh, 1094br77(b) | Minium/red lead | Lead (II, IV) oxide, Pb3O4 | 2.63 |
| 127 (ref. 77) | 77, 193,77 456,77 273,77 290,77 524,77 377,77 336br | Lead tin yellow I | Tin(II) sulfide, lead(II) stannate, Pb2SnO4 | 1.30 |
| 142 (ref. 37, 38, 77) | 288,37,38,77 86,38 70,38 384,37,38,77 215br, 423 (ref. 38) | Massicot | Lead(II) oxide, PbO | 2.63 |
| 162 | 188, 89, 129, 226, 127, 439, 278, 359, 1501, 506, 1377 | Malachite | Basic copper(II) carbonate, Cu2CO3 (OH)2 | 2.63 |
| 251 (ref. 37 and 77) | 342,37,77 280sh,37,77 86, 104sh | Vermillion | Synthetic mercury(II) sulfide, HgS | 2.63 |
| 253 | 343, 283, 85, 102 | Cinnabar | Mercury(II) sulfide, HgS | 2.63 |
| 291 (ref. 78) | 1316, 226,78 408,78 610,78 822br, 658br, 243sh | Caput Mortuum | Iron(III) oxide, Fe2O3 | 2.63 |
| 293 (ref. 39) | 1320, 409,39 609,38,39 224,39 1086br, 660, 243,38,39 495,38,39 820br | Haematite | Iron(III) oxide, Fe2O3 | 0.26 |
| 354 (ref. 37 and 77) | 309,37,77 291,37 153,37,77 381,37 201,37 66, 180,37 104 | Orpiment | Arsenic(III) sulfide, As2S3 | 1.30 |
| 354 (ref. 37) | 185,77 191,37 221,37,77 230sh, 368sh,37 58, 168sh, 143,37,77 120 | Realgar | Arsenic(III) sulfide, As4S4 | 1.30 |
| 408 | 292,37 224, 657br, 610br | Red ochre | Iron(III) oxide, Fe3O4 + clay + silica | 0.64 |
| 545 (ref. 77) | 1096,77 86, 1370, 1662, 255, 286sh77 | Ultramarine | Na6Ca6(Al6SI6O24) (SO4, S, S2, S3, cl, OH)2 | 2.63 |
| 657 br (ref. 78) | Raw umber | Iron(III) oxide, Fe2O3 + Manganese(IV) oxide, MnO2 | 0.26 | |
| 1005 (ref. 37) | 385,37,38 1134, 1084, 670, 617, 547, 488,38 296,37 241, 92 (ref. 38) | Yellow ochre | Iron(III) oxide hydrate, Fe2O3 H2O + clay + silica | 2.63 |
| 1095 (ref. 38) | 835, 396, 761,38 476br, 79, 240,38 133, 171 | Azurite | Basic copper(II) carbonate, Cu3(CO3)2 (OH)2) | 2.63 |
| 1324 (ref. 81) | 1293, 1475, 1448,81 1157,81 825 (ref. 81) | Purple madder | Alizarin C14H8O4and purpurin C14H8O5 | 2.63 |
| 1324 | 1594br | Carbon black | Carbon, C | 4.68 |
| 1333 (ref. 77) | 1585 | Lamp black | Carbon, C | 2.63 |
| 1477 | 1325,81 1291, 1187,81 1160,81 898,81 837 | Alizarin crimson | Alizarin C14H8O4 | 0.26 |
| 1573br | Iron ink Gall | Ferric Gallate C21H15FeO15 | 2.63 | |
| 1578 | 1253, 1223, 756, 672, 596, 545, 309, 250, 274 | Indigo | Indigo, C16H10N2O2 | 2.63 |
| 1585 | 1373br | Bistre | Wood soot, carbon C | 0.64 |
| 1592br | 1392br | Sepia | Melanin C18H10N2O4 | 0.33 |
| 1597 | 1349 (ref. 77) | Ivory black | Calcium hydroxide phosphate, Ca5(OH) (PO4)3 + carbon, C | 2.63 |
| 1644 | 1518, 1408, 1277, 1189, 629, 595, 821, 525, 479 | Orcein | Natural red 28, C28H24N2O7 | 2.63 |
| λ 0 = 785 nm | Spectral range (100–2500 cm−1) | Pigment name | Power density W μm−2 | |
|---|---|---|---|---|
| Main band cm-1 | ||||
| 549 (ref. 77) | 391, 314,77 224,77 234sh, 456, 480(a) | Minium/red lead | Lead (II, IV) oxide, Pb3O4 | 3.58 |
| 107 | 1051,77 1055sh, 410, 320br, 679,77 1136, 1441, 1640 | White lead | Basic lead(II) carbonate, 2Pb CO3 Pb(OH)2 | 3.58 |
| 129 (ref. 77) | 196,77 457,77 291,77 274, 111, 524,77 379,77 337, 508, 304, 337, 432sh | Lead tin yellow I | Tin(II) sulfide, lead(II) stannate, Pb2SnO4 | 3.58 |
| 142 (ref. 77) | 288,77 384,77 214, 427 | Massicot | Lead(II) oxide, PbO | 3.58 |
| 223 (ref. 77) | 290,77 406 (ref. 77) | Red ochre | Iron(III) oxide, Fe3O4 + clay + silica | 3.58 |
| 253 | 343, 286, 107, 143 | Vermillion | Synthetic mercury(II) sulfide, HgS | 0.96 |
| 254 | 343, 287, 108, 143, 201 | Cinnabar | Mercury(II) sulfide, HgS | 0.32 |
| 290 | 408, 224, 244, 609, 498, 1323br | Haematite | Iron(III) oxide, Fe2O3 | 3.58 |
| 290 | 224, 407, 609, 244, 495, 1316 | Caput mortuum | Iron(III) oxide, Fe2O3 | 3.58 |
| 353 (ref. 77) | 292, 202,77 383, 325, 218, 472, 585, 653, 706 | Orpiment | Arsenic(III) sulfide, As2S3 | 3.58 |
| 354 (ref. 77) | 192,77 181, 220, 343,77 142,77 165, 171,77 368, 374, 328, 212 | Realgar | Arsenic(III) sulfide, As4S4 | 0.96 |
| 397 | 246, 464, 128, 1095, 1428, 762, 834, 1574 | Azurite | Basic copper(II) carbonate, Cu3(CO3)2 (OH)2) | 3.58 |
| 482 | 1274, 1188,90 592,90 524,90 809, 1463, 1492, 1640 (ref. 90) | Orcein | Natural red 28, C28H24N2O7 | 3.58 |
| 550 (ref. 77) | 584sh,77 256 | Ultramarine | Na6Ca6(Al6SI6O24) (SO4, S, S2, S3, cl, OH) | 3.58 |
| 980 | 1430, 1338, 573 br | Iron gall ink | Ferric Gallate C21H15FeO15 | 4.94 |
| 1007 | 1255, 1224, 384, 431, 1138, 495, 1410, 671 | Yellow ochre | Iron(III) oxide hydrate, Fe2O3 H2O + clay + silica | 3.58 |
| 1248br | 1560br | Bistre | Wood soot, carbon C | 4.94 |
| 1293 | 1318,90 1442 | Purple madder | Alizarin C14H8O4 and purpurin C14H8O5 | 3.58 |
| 1303 (ref. 90) | 1321,77 1473 | Cochineal | Carminic acid, C22H20O13 | 3.58 |
| 1350br | 1550br | Sepia | Melanin C18H10N2O4 | 3.58 |
| 1430, | 1136, 227 | Verdigris | Copper(II) acetate, Cu (CH3COO)2 [Cu(OH)2]3 2H2O | 3.58 |
| 1431 | 1584, 1304 | Lamp black | Carbon, C | 3.58 |
| 1474 | 1302, 1323 (ref. 90) | Alizarin purple | Alizarin C14H8O4 | 3.58 |
| 1480 (ref. 90) | 1328, 1292,77 480, 1192, 1462sh, 1451sh,90 841, 1163,77,90 659, 904 (ref. 77 and 90) | Alizarin crimson | Alizarin C14H8O4 | 3.58 |
| 1571 | 1580 sh, 250, 545,77 597,77 262, 674,77 273, 756,77 1223, 1308, 1459, 1362, 1015 (ref. 77) | Indigo | Indigo, C16H10N2O2 | 3.58 |
| 1576 | 1332 | Carbon black | Carbon, C | 3.58 |
| 1585 (ref. 77) | 1329 | Ivory black | Calcium hydroxide phosphate, Ca5(OH) (PO4)3 + carbon, C | 3.58 |
| 1592 (ref. 77) | 1297, 1620sh, 1136, 1062 | Gamboge | Gambogic acid, C38H44O8 | 3.58 |
| λ 0 = 830 nm | Spectral Range (100–2500 cm−1) | Pigment name | Compound | Power density mW μm−2 |
|---|---|---|---|---|
| Main band cm−1 | ||||
| 92 | 315, 949, 179, 1296, 1436br | Verdigris | Copper(II) acetate, Cu (CH3COO)2 [Cu(OH)2]3 2H2O | 0.86 |
| 105 | 74, 1049, 1053, 416br, 679 | White lead | Basic lead(II) carbonate, 2Pb CO3 Pb(OH)2 | 0.12 |
| 120 | 549, 390, 151, 314, 142sh, 230br, 63, 85, 454 | Minium/red lead | Lead (II, IV) oxide, Pb3O4 | 0.86 |
| 128 (ref. 79) | 79, 196,79 457,79 292,79 273,79 112, 524,79 379,79 96, 304,79 339, 432 | Lead tin yellow | Tin(II) sulfide, lead(II) stannate, Pb2SnO4 | 0.37 |
| 142 | 87, 289, 70, 384, 217 | Massicot | Lead(II) oxide, PbO | 0.37 |
| 150 | 179, 77, 218, 269, 430, 1061br, 1495 | Malachite | Basic copper(II) carbonate, Cu2CO3 (OH)2 | 0.86 |
| 254 (ref. 79) | 343,79 283,79 103, 85, 142 | Vermillion | Synthetic mercury(II) sulfide, HgS | 0.12 |
| 254 (ref. 79) | 343,79 283,79 103,79 85 (ref. 79) | Cinnabar | Mercury(II) sulfide, HgS | 0.12 |
| 287 | 222, 406, 605, 489, 241sh | Caput Mortuum | Iron(III) oxide, Fe2O3 | 2.85 |
| 291 | 225, 408, 612, 244, 498, 1321br | Haematite | Iron(III) oxide, Fe2O3 | 2.85 |
| 292 | 610br, 225, 390br, 725 | Raw umber | Iron(III) oxide, Fe2O3 + Manganese(IV) oxide, MnO2 | 1.24 |
| 293 | 405, 398, 221, 608 | Red ochre | Iron(III) oxide, Fe3O4 + clay + silica | 2.85 |
| 353 | 191, 182, 220, 342, 166, 171, 142, 367, 374, 328, 123 | Realgar | Arsenic(II) sulfide, As4S4 | 0.37 |
| 354 | 311, 293, 154, 202, 136, 382, 369sh, 179, 105, 69 | Orpiment | Arsenic(III) sulfide, As2S3 | 0.12 |
| 401 | 248, 1093, 171(a) | Azurite | Basic copper(II) carbonate, Cu3(CO3)2 (OH)2) | 0.86 |
| 488 | 1275, 1192, 600br, 1333br,887, 1080, 432, 528 | Orcein | Natural red 28, C28H24N2O7 | 1.24 |
| 541 | Ultramarine | Na6Ca6(Al6SI6O24) (SO4, S, S2, S3, cl, OH)2 | 8.69 | |
| 979 | (a) | Iron Gall ink | Ferric Gallate C21H15FeO15 | 8.69 |
| 1007 | 386, 415, 297, 92, 1134, 1087, 244, 496, 550, 617, 669, 145, 1297, 1434 | Yellow ochre | Iron(III) oxide hydrate, Fe2O3 H2O + clay + silica | 8.69 |
| 1037 | 1596br | Lamp black | Carbon, C | 0.37 |
| 1298br | 1550br | Bistre | Wood soot, carbon C | 1.24 |
| 1300br | 1554br | Sepia | Melanin C18H10N2O4 | 0.86 |
| 1307 | 1593br | Ivory black | Calcium hydroxide phosphate, Ca5(OH) (PO4)3 + carbon, C | 0.86 |
| 1309 | 1589br | Carbon black | Carbon, C | 0.37 |
| 1318 | 1292, 1470br, 1448br | Purple madder | Alizarin C14H8O4 and purpurin C14H8O5 | 1.24 |
| 1321 | 1472, 1301br | Alizarin purple | Alizarin C14H8O4 | 0.12 |
| 1472 | 1328, 1187 | Alizarin crimson | Alizarin C14H8O4 | 0.37 |
| 1571 | 252, 544, 1582, 133, 101, 265, 275, 599, 1224, 1310, 235, 674, 757, 182, 635, 1364, 1460, 172, 310, 73, 1015, 1246, 1625, 1146, 870, 1702 | Indigo | Indigo, C16H10N2O2 | 1.24 |
| 1593 | 1435, 1632, 1453sh, 1331, 370, 1221, 1247, 1281 | Gamboge | Gambogic acid, C38H44O8 | 8.69 |
To use the library:
(1) Select the table pertinent to the laser wavelength used to carry out the measurements;
(2) Look for the highest intensity peak in the first column;
(3) Check the other peaks in the second column. The third column provides the name of the pigment.
Red pigments
For convenience, the pigments can be divided into two major groups. The first is the iron oxide compounds (haematite, red ochre and caput mortuum, which belongs also to the inks group as well), and the others (cinnabar, vermillion, minium/red lead). All the iron oxide (Fig. 2–4) compounds show the main peaks at around 223 cm−1, between 290 cm−1, around 407 cm−1, but only the spectra acquired with 532 nm and the 632.8 nm excitation beams show an intense peak between 1316 cm−1 and 1323 cm−1. The intensity enhancement is attributed to resonance effects since the absorption edge for Fe2O3 is at 580 nm. Spectra acquired with 488 nm all have poor signals, because of absorption by the pigment. Unfortunately, the red ochre (Fig. 3), which is a mixture of iron oxides, clays and silica, is the one that provided lowest signal to noise ratio with all the laser sources compared to haematite and caput mortuum. The red ochre spectra are indeed affected by fluorescence, likely related to the presence of a heterogeneous matrix. In the second group, minium (Fig. 1), or red lead, is a lead oxide, whose the main peak resulting from 632.8 nm excitation is at 121 cm−1, due to the deformation of the O–Pb–O angle. This was not detectable with the other wavelengths because of the edge filters cutting off low wavenumbers or attenuating the signal, and in literature studies of manuscripts this band is often omitted for this reason. However, contrary to the report by Burgio et al.1 who reported sample damage when using 488 nm and 514.5 nm radiations, it was possible to detect the pigment thanks to a low power density at 0.39 mW μm−2. Cinnabar and vermillion (Fig. 5 and 6) are the mineral and synthetic forms of mercury sulphide, both show indeed the same very strong peak at 251–255 cm−1. They are both detectable with all the five wavelengths, and only low laser power is required when working with 532 nm and 488 nm lasers to prevent saturation of the detector even at short acquisition times. Realgar is a photosensitive mineral95 and its transformation to pararealgar occurred using the 532 nm and the 488 nm wavelength laser source. Unfortunately the minimum power level for both the configurations was sufficient for this transformation and good spectra were not obtained without damaging the sample (Fig. 7).Purple pigments
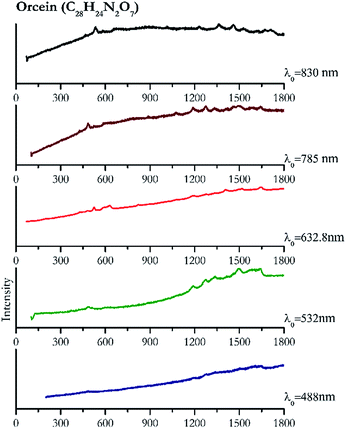
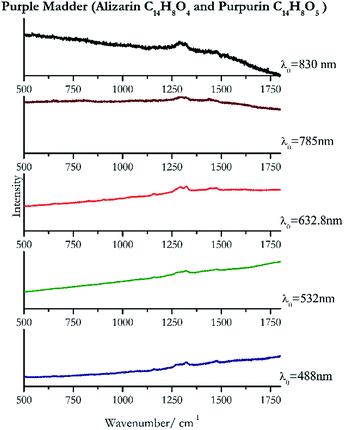
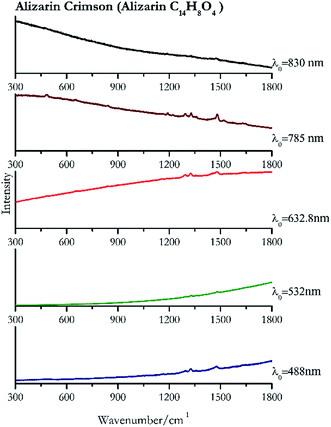
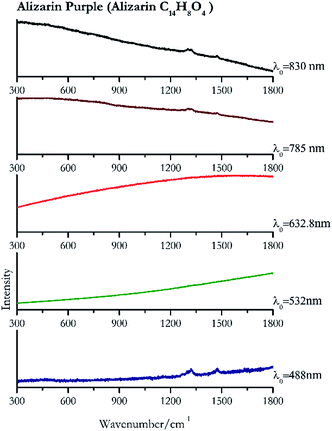
Cochineal (Fig. 8), orcein (Fig. 9), brazil wood, kermes, purple madder (Fig. 10), alizarin crimson (Fig. 11) and alizarin purple (Fig. 12) are all organic compounds and, these spectra are prone to be affected by fluorescence depending on the wavelength of the excitation source. The spectrum collected with the 830 nm and 632.8 nm of cochineal does not show any Raman bands. Orcein, purple madder and alizarin crimson were detectable with all the wavelengths, while alizarin purple did not provide any spectrum with the 532 nm (absorption at 530 nm) and 632.8 nm radiation. For kermes and brazil wood, no spectra could be obtained at any of the five laser wavelengths.Blue pigments
Indigo (Fig. 14) provides better spectra with the NIR and IR laser since it possesses a broad absorption band in the visible range.85 However, it is still possible to recognise the pigment, thanks to the peak at 1580 cm−1 circa and 545 cm−1 also with lower wavelengths, which are superimposed upon the weak fluorescence from this material. Azurite (Fig. 15) yields a good spectrum with all the wavelengths except the 632.8 nm laser source, attributed to the strong absorption by the pigment at ca. 600 nm. When using the infrared sources at 785 and 830 nm, a very low energy (785 nm and 830 nm, 3.58 and 8.69 mW μm−2) was used: at higher levels absorption of the radiation and localised heating of the sample results in its degradation. When the particles of azurite do not disperse the heat efficiently and the rate of heat inside the single grain is higher than the rate of heat outside, they thermo-degrade.86 Ultramarine (Fig. 16) can be identified by the strong band at 550 cm−1 using all excitation wavelengths. The absorption band at around 610 nm means that the 532 nm and 632 nm excitation sources, close to the electronic absorption wavelength, benefit from strong resonance enhancement and yield a progression of bands due to the bending of S3−.87 Indeed, in the spectrum collected with the 488 nm shows clearer a band at 584 cm−1 result of the S2− vibration, which with the other sources appears only as a shoulder of the main peak at 550 cm−1.Brown pigment
The only brown pigment investigated was raw umber (Fig. 13). It is a mixture of iron oxides and manganese oxides. Investigation at 830 nm shows bands at 292 cm−1, 610 cm−1, 225 cm−1, 390 cm−1 and 725 cm−1. Excitation with the green laser presents weak bands at 268 cm−1, 214 cm−1 and 582 cm−1. No satisfactory Raman spectra were obtained with the other laser excitation wavelengths, 488 nm, 632.8 nm, 785 nm or 830 nm.Yellow pigments
Orpiment (Fig. 17) is easily detectable with all the excitation wavelengths, requires only low laser powers to detect, and it may indeed cause saturation of the detector under some conditions. The main chromophore of yellow ochre is limonite, an iron oxy-hydroxide, and this pigment shows the same main peaks of the mineral at all wavelengths. Ochres come in a range of compositions, due to natural variance of the mineral and the Raman spectrum (Fig. 18) can therefore reflect these differences when collecting spectra from real historical artefacts. Lead tin yellow type I (Fig. 19) and massicot (Fig. 20) are both easily identified with the different laser wavelengths, but extra care has to be taken since they are both lead compounds and careful management of the laser power is required to avoid photo degradation: Burgio records alteration at 10 mW with 514.5 nm excitation source.1 In the field, this simply requires using a reliable power meter prior to measurement to ensure one knows precisely the light power being delivered at the sample surface and to work well below the damage thresholds. Lead tin yellow (Fig. 19) and massicot (Fig. 20) were detected with the 488 nm source at 3.9 mW μm−2 and with the 532 nm at 2.06 mW μm−2 for lead tin yellow type I and 0.82 mW μm−2 for massicot, without any degradation. No damage at the sample was noticed with the higher wavelengths and if low values of power (0.37 mW μm−2 with 830 nm laser) were used it was to avoid the detector saturation. The organic nature of gamboge (Fig. 21) causes fluorescence in the spectra, especially with higher frequency sources. The 830 nm laser is the one that yields the best spectrum, with an intense peak at 1593 cm−1.White pigment
When suspecting the presence of white lead (Fig. 22) it is necessary to employ low laser power (0.39 mW μm−2 with 488 nm and 0.12 mW μm−2 with 830 nm) because like other lead compounds it can easily be photodegraded by the laser.88,89 The highest intensity peak is observed at 104 cm−1 that requires a good laser light rejection cut off filter. As it can be seen from the spectra presented in Fig. 22 this band is clearly observed in our system when using the 632.8 nm excitation, where the notch filter has a shorter cut off. However, it remains observable using 830 nm excitation source, but lies on top of the sloping laser beam profile.Green pigments
Verdigris (Fig. 23) and malachite (Fig. 24) both result in good Raman spectra for the shorter wavelengths and do not provide a spectrum with the 785 nm laser because of strong absorption of the light in this region.84 However, the spectra obtained with the 830 nm do present peaks at 150 cm−1, 179 cm−1, 218 cm−1, 269 cm−1 to identify the pigments unambiguously.Black pigments and inks
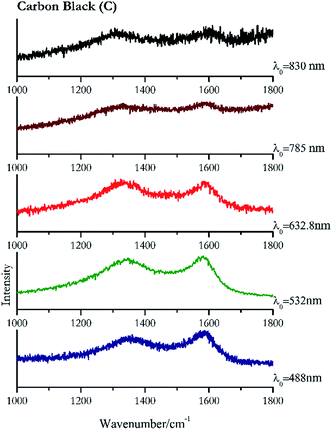
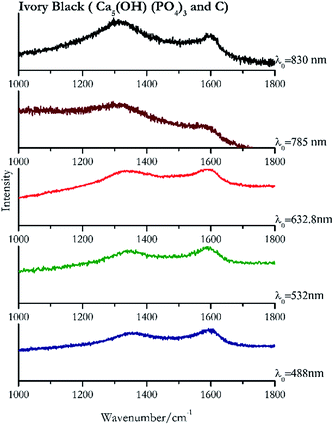
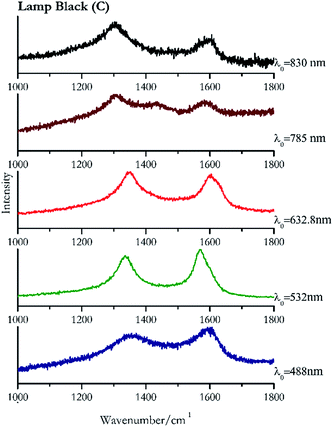
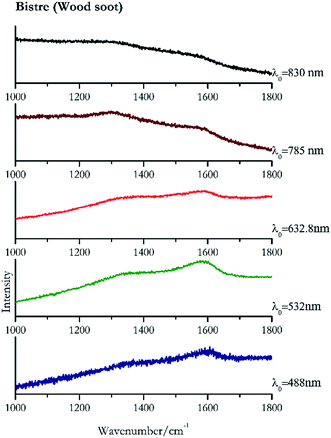
Carbon black, ivory black, lamp black and bistre (Fig. 25, 26, 27 and 28 respectively) are all characterized by broad bands between 1300 cm−1 and 1600 cm−1 due to the amorphous carbon. It is not possible to distinguish one from the others using a Raman spectroscopy.91 In a previous work a band at 965 cm−1 is recorded for ivory black, but it is not present in these spectra. The 785 nm laser seemed to be the one that provided the less intense peaks for all these black pigments. The sepia also shows two broad bands (Fig. 29), but they are generated by melanin, the main constituent of the pigment.92,93 Iron gall ink presents a peak at circa 980 cm−1 in the spectra collected (Fig. 30) with the two NIR sources, then a broad band in between 560 and 570 cm−1 that can be observed in the 532 and 785 nm spectra, as well as one at about 1350 cm−1. The spectrum acquired with the green laser has also peaks at 1601 cm−1 and 1644 cm−1. Historically better spectra have been obtained for this pigment,94 however we were not able to reproduce these results at the lower power densities. Caput mortuum (Fig. 4) has been already considered among the iron oxide based red pigments.Conclusions
This work seeks to provide an updated and useful reference handbook for identification by Raman spectroscopy of pigments of the middle ages meeting the needs of researchers working with portable equipment in situ and the increase in the availability of different wavelength lasers. Table 1 helps in choosing the best excitation wavelength to investigate expected pigments on a specific artefact. Indeed, the discussion of the spectra calls attention to the different phenomena that can occur according to the nature of the pigment and the wavelength used to investigate it, for example in considering the resonance Raman condition and how this effects relative peak intensities in comparison to normal Raman effect. The collection of spectra helps to compare the experimental data with references acquired with the same laser source, to unequivocally identify the pigment. The Tables 2–6 provide a practical guide, which in few steps allows the identification of pigments. Since the intensities of peaks vary according to the exciting source, the operator can search references recorded with the same wavelength used during the measurements. New pigment references collected with wavelengths not used in previous works are also provided. This work also concludes that it is evident that the Raman technique alone is not capable of fully characterizing all the pigments selected, especially the fluorescent organic dyes that are presenting challenges to curators. This highlights the need to turn to other techniques that can provide complementary information.Conflicts of interest
There are no conflicts to declare.Acknowledgements
The authors would like to thank the Northumbria University, Durham University and Rutherford Appleton Laboratory, Harwell Campus, Didcot. G. Marucci is also thankful to C. Aibéo, Rathgenforschungslabor (Berlin), for her advice. Funding for this project was provided through EPSRC DTA studentship at Northumbria University, STFC for instrument time at Harwell, and kind donations from Rob and Felicity Shepherd.Notes and references
- L. Burgio, R. J. H. Clark and S. Firth, Analyst, 2001, 126, 222–227 RSC.
- M. Aceto, A. Agostino, G. Fenoglio, M. Gulmini, V. Bianco and E. Pellizzi, Spectrochim. Acta, Part A, 2012, 91, 352–359 CrossRef CAS PubMed.
- J. Aramendia, L. Gomez-Nubla, K. Castro, I. Martinez-Arkarazo, D. Vega, A. Sanz López de Heredia, A. García Ibáñez de Opakua and J. Madariaga, J. Raman Spectrosc., 2012, 43, 1111–1117 CrossRef CAS.
- C. Boschetti, A. Corradi and P. Baraldi, J. Raman Spectrosc., 2008, 39, 1085–1090 CrossRef CAS.
- P. Colomban, J. Cult. Herit., 2008, 9, E55–E60 CrossRef.
- P. Colomban, J. Raman Spectrosc., 2012, 43, 1529–1535 CrossRef CAS.
- P. Colomban, V. Milande and L. Le Bihan, J. Raman Spectrosc., 2004, 35, 527–535 CrossRef CAS.
- P. Colomban, V. Milande and H. Lucas, J. Raman Spectrosc., 2004, 35, 68–72 CrossRef CAS.
- P. Colomban and A. Tournie, J. Cult. Herit., 2007, 8, 242–256 CrossRef.
- P. Colomban, A. Tournie, M. C. Caggiani and C. Paris, J. Raman Spectrosc., 2012, 43, 1975–1984 CrossRef CAS.
- C. Colombo, F. Bevilacqua, L. Brambilla, C. Conti, M. Realini, J. Striova and G. Zerbi, Anal. Bioanal. Chem., 2011, 401, 757–765 CrossRef CAS PubMed.
- D. de Waal, J. Raman Spectrosc., 2009, 40, 2162–2170 CrossRef CAS.
- M. K. Donais, D. George, B. Duncan, S. M. Wojtas and A. M. Daigle, Anal. Methods, 2011, 3, 1061–1071 RSC.
- D. Hutsebaut, P. Vandenabeele and L. Moens, Analyst, 2005, 130, 1204–1214 RSC.
- B. Kirmizi, P. Colomban and M. Blanc, J. Raman Spectrosc., 2010, 41, 1240–1247 CrossRef CAS.
- B. Kirmizi, P. Colomban and B. Quette, J. Raman Spectrosc., 2010, 41, 780–790 CrossRef CAS.
- D. Lauwers, A. G. Hutado, V. Tanevska, L. Moens, D. Bersani and P. Vandenabeele, Spectrochim. Acta, Part A, 2014, 118, 294–301 CrossRef CAS PubMed.
- D. Mancini, A. Tournie, M. C. Caggiani and P. Colomban, J. Raman Spectrosc., 2012, 43, 294–302 CrossRef CAS.
- M. Pérez-Alonso, K. Castro, I. Martinez-Arkarazo, M. Angulo, M. Olazabal and J. Madariaga, Anal. Bioanal. Chem., 2004, 379, 42–50 CrossRef PubMed.
- I. Reiche and L. Lambacher, J. Raman Spectrosc., 2004, 35, 719–725 CrossRef CAS.
- P. Ricciardi, P. Colomban, A. Tournie, M. Macchiarola and N. Ayed, J. Archaeol. Sci., 2009, 36, 2551–2559 CrossRef.
- P. Ropret and J. M. Madariaga, J. Raman Spectrosc., 2014, 45, 985–992 CrossRef CAS.
- F. Rosi, V. Manuali, T. Grygar, P. Bezdicka, B. G. Brunetti, A. Sgamellotti, L. Burgio, C. Seccaronif and C. Miliani, J. Raman Spectrosc., 2011, 42, 407–414 CrossRef CAS.
- D. C. Smith, Spectrochim. Acta, Part A, 2003, 59, 2353–2369 CrossRef.
- A. Tournie, L. C. Prinsloo, C. Paris, P. Colomban and B. Smith, J. Raman Spectrosc., 2011, 42, 399–406 CrossRef CAS.
- P. Vandenabeele, K. Castro, M. Hargreaves, L. Moens, J. M. Madariaga and H. G. M. Edwards, Anal. Chim. Acta, 2007, 588, 108–116 CrossRef CAS PubMed.
- P. Vandenabeele, H. G. M. Edwards and J. Jehlicka, Chem. Soc. Rev., 2014, 43, 2628–2649 RSC.
- P. Vandenabeele, F. Verpoort and L. Moens, J. Raman Spectrosc., 2001, 32, 263–269 CrossRef CAS.
- P. Vandenabeele, T. L. Weis, E. R. Grant and L. J. Moens, Anal. Bioanal. Chem., 2004, 379, 137–142 CrossRef CAS PubMed.
- M. A. Ziemann, J. Raman Spectrosc., 2006, 37, 1019–1025 CrossRef CAS.
- D. Bersani, C. Conti, P. Matousek, F. Pozzi and P. Vandenabeele, Anal. Methods, 2016, 8, 8395–8409 RSC.
- R. J. H. Clark, Chem. Soc. Rev., 1995, 24, 187–196 RSC.
- L. M. Proniewicz, C. Paluszkiewicz, A. Wesełucha-Birczyńska, H. Majcherczyk, A. Barański and A. Konieczna, J. Mol. Struct., 2001, 596, 163–169 CrossRef CAS.
- P. Vandenabeele, B. Wehling, L. Moens, H. Edwards, M. De Reu and G. Van Hooydonk, Anal. Chim. Acta, 2000, 407, 261–274 CrossRef CAS.
- T. D. Chaplin, R. J. Clark, D. Jacobs, K. Jensen and G. D. Smith, Anal. Chem., 2005, 77, 3611–3622 CrossRef CAS PubMed.
- A. S. Lee, P. J. Mahon and D. C. Creagh, Vib. Spectrosc., 2006, 41, 170–175 CrossRef CAS.
- I. M. Bell, R. J. H. Clark and P. J. Gibbs, Spectrochim. Acta, Part A, 1997, 53, 2159–2179 CrossRef.
- M. Bouchard and D. C. Smith, Spectrochim. Acta, Part A, 2003, 59, 2247–2266 CrossRef CAS.
- L. Burgio and R. J. H. Clark, Spectrochim. Acta, Part A, 2001, 57, 1491–1521 CrossRef CAS.
- M. Aceto, A. Agostino, G. Fenoglio, P. Baraldi, P. Zannini, C. Hofmann and E. Gamillscheg, Spectrochim. Acta, Part A, 2012, 95, 235–245 CrossRef CAS PubMed.
- D. Bersani, P. P. Lottici, F. Vignalil and G. Zanichelli, J. Raman Spectrosc., 2006, 37, 1012–1018 CrossRef CAS.
- S. P. Best, R. J. H. Clark, M. A. M. Daniels, C. A. Porter and R. Withnall, Stud. Conserv., 1995, 40, 31–40 CAS.
- S. Bioletti, R. Leahy, J. Fields, B. Meehan and W. Blau, J. Raman Spectrosc., 2009, 40, 1043–1049 CrossRef CAS.
- K. L. Brown and R. J. H. Clark, J. Raman Spectrosc., 2004, 35, 4–12 CrossRef CAS.
- K. L. Brown and R. J. H. Clark, J. Raman Spectrosc., 2004, 35, 181–189 CrossRef CAS.
- K. L. Brown and R. J. H. Clark, J. Raman Spectrosc., 2004, 35, 217–223 CrossRef CAS.
- S. Bruni, S. Caglio, V. Guglielmi and G. Poldi, Appl. Phys. Mater. Sci. Process, 2008, 92, 103–108 CrossRef CAS.
- L. Burgio, D. A. Ciomartan and R. J. H. Clark, J. Raman Spectrosc., 1997, 28, 79–83 CrossRef CAS.
- G. Chapman, Manuscripta, 1986, 30, 168–169 Search PubMed.
- R. J. Clark, Chem. Soc. Rev., 1995, 24, 187–196 RSC.
- R. J. H. Clark and P. J. Gibbs, J. Archaeol. Sci., 1998, 25, 621–629 CrossRef.
- R. J. H. Clark and J. van der Weerd, J. Raman Spectrosc., 2004, 35, 279–283 CrossRef CAS.
- M. Clarke, Stud. Conserv., 2004, 49, 231–244 CAS.
- A. Deneckere, M. De Reu, M. P. J. Martens, K. De Coene, B. Vekemans, L. Vincze, P. De Maeyer, P. Vandenabeele and L. Moens, Spectrochim. Acta, Part A, 2011, 80, 125–132 CrossRef CAS PubMed.
- B. Doherty, A. Daveri, C. Clementi, A. Romani, S. Bioletti, B. Brunetti, A. Sgamellotti and C. Miliani, Spectrochim. Acta, Part A, 2013, 115, 330–336 CrossRef CAS PubMed.
- A. Duran, A. Lopez-Montes, J. Castaing and T. Espejo, J. Archaeol. Sci., 2014, 45, 52–58 CrossRef CAS.
- H. G. M. Edwards, D. W. Farwell, F. R. Perez and J. M. Garcia, Analyst, 2001, 126, 383–388 RSC.
- D. Lauwers, V. Cattersel, L. Vandamme, A. Van Eester, K. De Langhe, L. Moens and P. Vandenabeele, J. Raman Spectrosc., 2014, 45, 1266–1271 CrossRef CAS.
- A. Le Gac, S. Pessanha, S. Longelin, M. Guerra, J. C. Frade, F. Lourenco, M. C. Serrano, M. Manso and M. L. Carvalho, Appl. Radiat. Isot., 2013, 82, 242–257 CrossRef CAS PubMed.
- K. Nesmerak and I. Nemcova, Anal. Lett., 2012, 45, 330–344 CrossRef CAS.
- K. Trentelman and N. Turner, J. Raman Spectrosc., 2009, 40, 577–584 CrossRef CAS.
- G. Van Der Snickt, W. De Nolf, B. Vekemans and K. Janssens, Appl. Phys. Mater. Sci. Process, 2008, 92, 59–68 CrossRef CAS.
- G. Van Hooydonk, M. De Reu, L. Moens, J. Van Aelst and L. Milis, Eur. J. Inorg. Chem., 1998, 639–644 CrossRef CAS.
- P. Vandenabeele, B. Wehling, L. Moens, B. Dekeyzer, B. Cardon, A. von Bohlen and R. Klockenkamper, Analyst, 1999, 124, 169–172 RSC.
- B. Wehling, P. Vandenabeele, L. Moens, R. Klockenkamper, A. von Bohlen, G. Van Hooydonk and M. de Reu, Mikrochim. Acta, 1999, 130, 253–260 CrossRef CAS.
- A. Zoleo, L. Nodari, M. Rampazzo, F. Piccinelli, U. Russo, C. Federici and M. Brustolon, Archaeometry, 2014, 56, 496–512 CrossRef CAS.
- C. Cennini, Il libro dell'arte, a cura di Fabio Frezzato, ed. Neri Pozza, Vicenza, 3rd edn, 2006 Search PubMed.
- M. Fryling, C. J. Frank and R. L. McCreery, Appl. Spectrosc., 1993, 47, 1965–1974 CrossRef CAS.
- K. J. Frost and R. L. Mccreery, Appl. Spectrosc., 1998, 52, 1614–1618 CrossRef CAS.
- P. Vandenabeele and L. Moens, J. Raman Spectrosc., 2012, 43, 1545–1550 CrossRef CAS.
- R. L. McCreery, Raman Spectroscopy for Chemical Analysis, United States of America, 10th edn, 2000 Search PubMed.
- P. Vandenabeele, Practical Raman Spectroscopy: an introduction, 1st edn, 2013 Search PubMed.
- J. D. Ingle Jr and S. R. Crouch, 1988, 141–142.
- Presented in part at the Workshop on Preparation of Historical Lake Pigments 23–25 March 2011 Doerner Institut, Bayerische Staatsgemaeldesammlungen, Muenchen, Germany, 2011 Search PubMed.
- The Non-Destructive and in-situ identification of controlled drugs and narcotics, Horiba Scientific, France Search PubMed.
- A. Coccato, D. Bersani, A. Coudray, J. Sanyova, L. Moens and P. Vandenabeele, J. Raman Spectrosc., 2016, 47, 1429–1443 CrossRef CAS.
- M. Caggiani, A. Cosentino and A. Mangone, Microchem. J., 2016, 129, 123–132 CrossRef CAS.
- D. Bikiaris, S. Daniilia, S. Sotiropoulou, O. Katsimbiri, E. Pavlidou, A. Moutsatsou and Y. Chryssoulakis, Spectrochim. Acta Mol. Biomol. Spectrosc., 2000, 56, 3–18 CrossRef.
- D. Lau, C. Villis, S. Furman and M. Livett, Anal. Chim. Acta, 2008, 610, 15–24 CrossRef CAS PubMed.
- M. Leona, Proc. Natl. Acad. Sci. U. S. A., 2009, 106 CrossRef CAS PubMed.
- A. V. Whitney, R. P. Van Duyne and F. Casadio, J. Raman Spectrosc., 2006, 37, 993–1002 CrossRef CAS.
- F. Pozzi, J. R. Lombardi and M. Leona, Heritage Sci., 2013, 1, 1–8 CrossRef.
- M. Caggiani, A. Cosentino and A. Mangone, Microchem. J., 2016, 129, 123–132 CrossRef CAS.
- A. Coccato, D. Bersani, A. Coudray, J. Sanyova, L. Moens and P. Vandenabeele, J. Raman Spectrosc., 2016, 47, 1429–1443 CrossRef CAS.
- A. Cosentino, Environ. Conserv. J., 2014, 2, 57–68 Search PubMed.
- E. Mattei, G. De Vivo, A. De Santis, C. Gaetani, C. Pelosi and U. Santamaria, J. Raman Spectrosc., 2008, 39, 302–306 CrossRef CAS.
- R. Clark and M. Franks, Chem. Phys. Lett., 1975, 34, 69–72 CrossRef CAS.
- P. Pouli, D. C. Emmony, C. E. Madden and I. Sutherland, J. Cult. Herit., 2003, 4, 271–275 CrossRef.
- C. Goodeve, Trans. Faraday Soc., 1937, 33, 340–347 RSC.
- M. Leona, J. Stenger and E. Ferloni, J. Raman Spectrosc., 2006, 37 Search PubMed.
- E. P. Tomasini, E. B. Halac, M. Reinoso, E. J. Di Liscia and M. S. Maier, J. Raman Spectrosc., 2012, 43, 1671–1675 CrossRef CAS.
- S. A. Centeno and J. Shamir, J. Mol. Struct., 2008, 873, 149–159 CrossRef CAS.
- Z. Huang, H. Lui, X. Chen, A. Alajlan, D. I. McLean and H. Zeng, J. Biomed. Optic., 2004, 9, 1198–1205 CrossRef CAS PubMed.
- M. Bicchieri, M. Monti, G. Piantanida and A. Sodo, All that is iron-ink is not always iron-gall!, 2008 Search PubMed.
- K. Trentelman, L. Stodulski and M. Pavlosky, Anal. Chem., 1996, 68(10), 1755–1761 CrossRef CAS.
Footnote |
| † Electronic supplementary information (ESI) available: Figures of pigments' spectra, from 1 to 30; the data of the Raman spectra collected at the different wavelengths. See DOI: 10.1039/c8ay00016f |
| This journal is © The Royal Society of Chemistry 2018 |

