Enhanced adsorptive removal of hazardous anionic dye “congo red” by a Ni/Cu mixed-component metal–organic porous material

Jue Hua, Huijing Yua, Wei Dai*a, Xiaoyang Yana, Xin Hua and He Huangb
aCollege of Chemistry and Life Science, Zhejiang Normal University, Jinhua 321004, Zhejiang Province, People's Republic of China. E-mail: daiwei@zjun.edu.cn; Fax: +86-579-82282531; Tel: +86-579-82282269
bCollege of Biotechnology and Pharmaceutical Engineering, Nanjing University of Technology, Nanjing 210009, People's Republic of China

Received 16th June 2014 , Accepted 29th July 2014

First published on 30th July 2014


Abstract

A new type of metal–organic porous material (Ni/Cu–BTC) has been successfully synthesized by a solvothermal approach for the first time. The as-synthesized materials were characterized using XRD, SEM, ICP, and TGA analyses and N2 adsorption at 77 K. The Ni/Cu–BTC was applied to the adsorption of anionic dye congo red (CR) from aqueous solution, and from the experimental data, adsorption kinetics and isotherms were obtained. The results showed that a pseudo-second-order kinetic model and the Langmuir adsorption isotherm matched well for the adsorption of CR onto Ni/Cu–BTC. Thermodynamic parameters including free energy, enthalpy, and entropy of adsorption were obtained, and all the results were favorable for the adsorption. Compared with other adsorbents reported in the literature, Ni/Cu–BTC demonstrated a superior CR dye adsorption capability. The results of the present study substantiate that Ni/Cu–BTC is a promising adsorbent for the removal of the dye from wastewater.

1. Introduction

With the development of industry and population expansion, the problem of water pollution has become more and more serious.1,2 Dyestuff pollution is one of the most serious water pollution problems in the world.3 Dyes may significantly affect photosynthetic activity in aquatic life due to the presence of aromatics, metals, chlorides, and so forth, in them. Many of the dyes used in the industries are stable to light and oxidation, as well as resistant to aerobic digestion.4,5 Anionic reactive dyes are widely used in the tannery, paper, and textile industries, distilleries, food companies, etc. Congo red (CR) (1-napthalenesulfonic acid, 3,3′-(4,4′-biphenylene bis(azo))bis(4-amino-)disodium salt) is a benzidine-based anionic disazo dye, which is acknowledged to metabolize to benzidine, a known human carcinogen.6 Therefore, CR containing effluents have to be adequately treated before they are discharged into the environment. Dye wastewater is usually treated by physical or chemical treatment processes. These include photocatalytic degradation,7 flocculation combined with flotation,8 electro flocculation,9 membrane filtration,10 internal electrolysis,11 electrokinetic coagulation,12 ion-exchange,13 irradiation,14 precipitation,15 biological treatment and ozonation treatment method.16 However, these technologies generally have some disadvantages to dye removal, such as expensive, the secondary pollution, unrecoverable and less adaptable to a wide range of dye wastewaters.17,18

Adsorption on porous materials is being considered as a possible alternative. In recent years, metal organic porous materials (MOMs) have been widely investigated as promising adsorbents, due to the combination of their particular features, such as high surface area, tunable pore size, and thermal stability. Among them, Cu–BTC is the most important material, which exhibits highly porous nature and has promised material for a number of diverse potential applications including gas storage, gas separation and catalysis in organic synthesis.19,20 However, the most widely studied crystalline MOFs are usually constructed from a small number of distinct building blocks, and thus relatively “simple” in terms of their composition and structure.

Mixed-component metal–organic porous materials (MC-MOMs) has different linkers or metals with the same structural role. Many of these mixed-ligand or mixed-metal MOMs are solid solutions, in which the proportions of the ligands or metals can be adjusted or even controlled. These MC-MOMs can be prepared directly, using more than one metal or ligand in the synthesis, or formed by post-synthetic modification.21 A second class of MC-MOMs have core–shell structures, which can be prepared through epitaxial growth of one MOM on the surface of another or post-synthetic modification of the crystal surfaces. Recently, some of these MC-MOMs have been reported, namely block crystals22 and core–shell MOM structures, developed by Kitagawa and their co-workers.23 Solid-solution MOMs, which can be regarded as molecular substitutional alloys,24,25 and multivariate metal–organic porous materials (MTV-MOMs), introduced by Yaghi and co-workers,26 are other attractive types of mixed-component MOMs. These materials can be prepared directly by using more than one metal or ligand in the solvothermal synthesis or formed by post-synthetic modification. The possibilities of introducing advanced complexity into MOM materials hold enormous potential due to the ability to adjust or even control the ratios of the organic and inorganic components in the structure, providing novel control over pore metrics and compositions and, hence, tailoring in a particular way the physicochemical properties beyond the options available to the single-component parent MOMs. For example, increasing the capacity of selective adsorption27 and improving the selective adsorption of adsorbate28 and the catalytic activity29 have been achieved. The major applications currently being considered for these MC-MOMs mostly focus on gas storage, catalysis, separations, as carriers for nano-materials and drug delivery. However, the study about the removal of dyes from aqueous solution adsorption by MC-MOMs is still scarce.

In this contribution we present the formation and analysis of Ni/Cu mixed-metal porous material (Ni/Cu–BTC) in which Ni(II) cations are partly substituted by Cu(II). The choice of Ni is based on its expected higher affinity for CR molecular, according to its adsorption behavior in Ni/Cu MC-MOFs. The equilibrium, kinetics, and thermodynamic parameters are studied to describe the rate and mechanism of adsorption to determine the factor controlling the rate of adsorption and to find out the possibility of using this double metal MOM as an effective adsorbent for the removal of CR dye.

2. Experimental section

2.1 Dye solution preparation

An aqueous stock solution of CR was prepared by dissolving CR (C32H22N6Na2O6S2, MW: 696.66, Sigma-Aldrich) in deionized water. It was soaked slowly to make sure that all the CR powder has been dissolved in distilled water. This stock solution was stored for further use. All the other reagents were of analytical reagent grade. All reagents and solvents are commercially available and were used as received without further purification.

2.2 Synthesis

Pure Cu–BTC was prepared by the similar procedure following the detailed description given in the literature.30 The preparation procedure of the Cu–BTC is: Cu(NO3)2·3H2O (2 g, 0.0084 mol) and H3BTC (1 g, 0.0048 mol) were dissolved in 51 mL of solvent consisting of equal amount of DMF, ethanol and deionized water by ultrasonication. The solution was placed in an oven and heated to 358 K for 20 h. The blue product was isolated, rinsed with 50 mL DMF for three times and immersed in absolute ethanol every 24 h for 72 h. Finally, the blue product was heated to 373 K for 12 h in vacuum. Ni/Cu–BTC materials were synthesized by following the same procedure but using Ni(NO3)2·6H2O as a nickel source in order to substitute 30, 50 and 80% molar Cu by Ni. Metal contents of the synthesized materials were measured by ICP (Inductively Coupled Plasma) atomic emission spectroscopy on a Varian Vista AX CD system. The samples were previously dissolved in concentrated sulfuric acid and subsequently calcined at 700 °C to eliminate the organic part, being the resulting residual solid dissolved in a sulphuric acid solution and analyzed by ICP. The chemical composition of evacuated Ni-containing materials was determined by ICP spectroscopy, resulting in the following materials: (a) Ni0.9Cu2.1(BTC)2 (sample named Ni30/Cu–BTC); (b) Ni1.5Cu1.5(BTC)2 (sample named Ni50/Cu–BTC); and (c) Ni2.4Cu0.6(BTC)2 (sample named Ni80/Cu–BTC).

2.3 Characterization techniques

X-ray diffraction (XRD) data were recorded from a Bruker D8 Advance X-ray Diffractometer with Cu Kα radiation (λ = 1.542 Å). Specific surface areas and pore volumes were determined by N2 adsorption. An automated adsorption apparatus (Micromeritics, ASAP2020) was used for these measurements. N2 adsorption was carried out at liquid N2 temperature (77 K). The specific surface areas were calculated using the Brunauer–Emmett–Teller (BET) equation by assuming a section area of nitrogen molecule to be 0.162 nm2. The total pore volume was estimated to be the liquid N2 volume at a relative pressure of 0.99. The morphological features and surface characteristics of the samples were obtained from scanning electron microscopy (SEM) using a Hitachi S-4800 scanning electron microscope at an accelerating voltage of 15 kV. The samples were coated with platinum by electro-deposition under vacuum prior to analyses. Thermogravimetric analysis was performed using a Netzsch STA 449 C instrument and experiments were conducted with a constant heating rate of 5 °C min−1 in nitrogen atmosphere.

2.4 Batch adsorption experiments

Adsorption measurements on the new adsorbents were carried out in batches. A desired amount of the adsorbent was added to 50 mL of the CR solution with various concentrations (300–900 mg L−1). The mixture was stirred magnetically at certain temperature (303, 313 and 323 K) and 150 rpm, and samples were withdrawn from the experimental flask at pre-determined time intervals until the adsorption equilibrium was reached. Next, the dye solution was separated from the adsorbent by centrifugation (TGL-16G, Zhejiang Nade Co., Ltd) at 8000 rpm for 20 min. The supernatants were filtered using a Millex-HN filter (Millipore 0.45 mm, Zhejiang Nade Co., Ltd) to ensure that the solutions were free of adsorbent particles prior to measuring the residual dye concentration. Then the samples were filtered and the residual concentrations of CR in the filtrate were analyzed by a UV-visible spectrophotometer (UV-1000, Shanghai Tianmei Co., Ltd) at maximum wave lengths of 497 nm. It was found that the calibration curves were very reproducible and linear over the concentration range used in this work. The adsorbed amount of CR at equilibrium, qe (mg g−1) was calculated by the following expression:
 
image file: c4ra05772d-t1.tif(1)
where Co and Ce (mg L−1) are the initial and equilibrium concentrations of CR solution, respectively; V (L) is the volume of solution, and W (g) is the weight of adsorbent used.

3. Results and discussion

3.1 Materials characterization

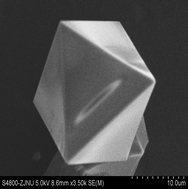
To identify the structure of the material, XRD analysis was performed on the synthesized Cu–BTC, and the result showed that its XRD pattern well matched that reported in literature indicating the successful preparation of Cu–BTC and its good crystallization.19,20 Powder X-ray diffraction patterns of as-prepared undoped and Ni-doped Cu–BTC samples show that both of them are the unique crystalline phase present in all samples (Fig. 1). These patterns were indexed on the basis of a face-centered cubic unit cell with resulting values of a = 25.68 and 25.63 A for Cu–BTC and Ni50/Cu–BTC, respectively. The results qualitatively support Ni incorporation into the framework (ionic radius size of Ni(II) ions and Cu(II) ions are similar) and are in good agreement with theoretical calculations for a Ni-doped Cu–BTC framework. Cu–BTC and Ni/Cu–BTC are very similar and also very close to the corresponding values derived for the as-synthesized. Because of the almost identical electron density, X-ray diffraction cannot readily distinguish between Ni(II) and Cu(II) within the dinuclear units in the frameworks. Therefore, in the crystal structure determination, the metal atoms were randomly distributed at the same sites in the lattice with a relative Ni/Cu ratio (occupation factor). In order to observe its surface morphology, the images of Cu–BTC and Ni50/Cu–BTC were taken with a scanning electron microscope after gold deposition. As illustrated in Fig. 2, two samples show very similar features, suggesting that Ni-doping does not change the morphology of crystal structure. The crystals sample of Ni50/Cu–BTC in SEM image had a double-sided pyramidal shape with about 10 to 20 μm in width. Such regular structure conformed the good crystallization which was already testified by its powder X-ray diffraction pattern.
image file: c4ra05772d-f1.tif
Fig. 1 XRD analysis for Cu–BTC and Ni50/Cu–BTC samples.

image file: c4ra05772d-f2.tif
Fig. 2 SEM images of Ni50/Cu–BTC samples.

The nitrogen adsorption isotherms curves of Cu–BTC, Ni30/Cu–BTC, Ni50/Cu–BTC, and Ni80/Cu–BTC at 77 K are shown in Fig. 3. Clearly, all these samples show type I adsorption isotherms according to the IUPAC classification.31 The textural properties of the sorbents are collected in Table SI.1. The BET surface area and the total pore volume of Cu–BTC are 1379 m2 g−1 and 0.56 cm3 g−1, respectively. After loading different levels of Ni(II), the BET surface area and total pore volume of composite sorbents decreased compared with Cu–BTC with 1156 m2 g−1 and 0.52 cm3 g−1 in Ni30/Cu–BTC, 1062 m2 g−1 and 0.48 cm3 g−1 in Ni50/Cu–BTC, and 1047 m2 g−1 and 0.45 cm3 g−1 in Ni80/Cu–BTC, respectively.


image file: c4ra05772d-f3.tif
Fig. 3 N2 adsorption isotherms of Cu–BTC and Ni/Cu–BTC samples at 77 K.

Thermal gravimetric analysis (TGA) was measured from a Netzsch STA 449 C thermal graphic analyzer from 25 to 600 °C with a heating rate of 10 K min−1 in N2. Thermogravimetric analysis (TGA) curves of Cu–BTC and Ni50/Cu–BTC all display two main steps of weight loss (Fig. 4). The first step of weight loss in the temperature range 30–120 °C can be attributed to the loss of moisture and solvent molecules. The second step is due to the decomposition of organic linkers. From 100 to 300 °C, no obvious mass loss can be found, which demonstrated the superior thermodynamic stability of Ni50/Cu–BTC up to 300 °C. Further increasing the temperature to 350 °C lead to the weight of Ni50/Cu–BTC and Cu–BTC loss about 50% and 60%, respectively. No mass loss can be found when temperature was further increased to 600 °C. Compared to that of pure Ni50/Cu–BTC, the second weight loss of Cu–BTC occurs in lower temperature. The behavior also indicates that Ni(II) ions should locate in the framework; otherwise, it would be difficult to rationalize such a pronounced effect of the presence of Ni(II) ions on the decomposition temperature of the organic linkers.


image file: c4ra05772d-f4.tif
Fig. 4 TGA of Ni50/Cu–BTC under nitrogen atmosphere.

3.2 Adsorption isotherms

The Langmuir isotherm model is used to predict the sorption of aqueous compounds onto a solid phase. This mechanistic model assumes that a monolayer of adsorbed material (in liquid, such as CR) is adsorbed over a uniform adsorbent surface (a flat surface of solid phase) at a constant temperature and that the distribution of the compound between the two phases is controlled by equilibrium constant. Hence at equilibrium both rates of adsorption and desorption are equal. The linear form of Langmuir's isotherm model32 is given by the following equation:
 
image file: c4ra05772d-t2.tif(2)
where qL (mg g−1) is the Langmuir maximum uptake of CR per unit mass adsorbent, KL (L mg−1) is the Langmuir constant related to the rate of adsorption.

Freundlich isotherm model33 is assuming that the adsorption process takes place on a heterogeneous surface. The Freundlich exponential equation is given by the following equation:

 
image file: c4ra05772d-t3.tif(3)
where Kf and n are Freundlich constants, with n indicating the favorableness of the adsorption process and Kf the adsorption capacity of the adsorbent. Kf can be defined as the adsorption or distribution coefficient and it represents the quantity of dye adsorbed onto activated carbon adsorbent for a unit equilibrium concentration. The slope 1/n ranging between 0 and 1, is a measure of adsorption intensity or surface heterogeneity, becoming more heterogeneous as its value gets closer to zero.

Temkin isotherm model34 (eqn (4)) was used also to test the adsorption potential of adsorbents to CR dye. This model is taking into account the effects of indirect adsorbate/adsorbate interactions on the adsorption process. Furthermore, the model is assuming that the heat of adsorption (ΔHads) of all molecules in the layer decreased linearly by increasing the coverage. The linear form of Temkin is given as follows:

 
image file: c4ra05772d-t4.tif(4)
where, R is common gas constant (0.008314 kJ mol−1 K−1), T is the absolute temperature (K), 1/bT is the Temkin constant related to the heat of sorption (kJ mol−1) which indicates the adsorption potential (intensity) of the adsorbent and KT(L g−1) is Temkin constant related to adsorption capacity. The liner plots of qe versus ln[thin space (1/6-em)]Ce enable it to determine the constants 1/bT and KT from the slope and intercept respectively.

The adsorption isotherms of CR at 323 K on various amount Ni-doped Cu–BTC at a solid–liquid ratio of 0.4 g L−1 are recorded and presented in Fig. 5. The obtained experimental equilibrium adsorption data are then fitted using Langmuir, Freundlich and Temkin isotherm models by eqn (2)–(4). The calculated constants according to the three isotherm equations along with R2 values (standard deviation) are presented in Table SI.2. This table shows that the Langmuir isotherm gives the best fittings with R2 > 0.996. The good fittings to the Langmuir model for the CR dye also suggest that the adsorption is limited with a monolayer coverage and the surface is relatively homogeneous. On the other hand, the maximum monolayer adsorption capacity (qL) is significantly higher on Ni50/Cu–BTC and varies in the order of Ni50/Cu–BTC > Ni30/Cu–BTC > Cu–BTC > Ni80/Cu–BTC. The comparison of the maximum adsorption capacities of the various adsorbents with Ni/Cu–BTC are summarized in Table SI.3. It is clear that the adsorption capacity of Ni50/Cu–BTC is superior to the other adsorbents reported previously.35–42


image file: c4ra05772d-f5.tif
Fig. 5 Equilibrium adsorption isotherms of CR on Cu–BTC, Ni30/Cu–BTC, Ni50/Cu–BTC, and Ni80/Cu–BTC, respectively (t = 4 h, pH = 7, dose = 0.4 g L−1, T = 323 K).

Even though a more detailed study is necessary to clearly understand the mechanism of CR adsorption on Ni/Cu–BTC, the adsorption may be explained with an electrostatic interaction between the dyes and adsorbents. CR usually exist in negative and positive forms. Therefore, there will be an electrostatic interaction with active sites of metal centers (Cu(II) and Ni(II)) on the surfaces of MOFs, attracted to the anionic CR molecules. It was found that the sulfur uptake capacity of Ni/Cu–BTC significantly increased in comparison with the Cu–BTC. Such phenomena maybe due to the synergistic effect of Cu(II) and Ni(II) on the anionic CR molecules, which enhanced the ability of adsorption for CR onto MOFs. While if more Ni(II) were introduced into the support, it may block the pore and lead to the increase of the diffusion resistance during the mass transfer reactions, which can actually decrease the amount of accessible active sites, and thus, the Ni80/Cu–BTC shows a smaller CR uptake capacity than that with lower Ni(II) doping (Ni50/Cu–BTC). Therefore, among all the samples, Ni50/Cu–BTC shows the highest CR dye capacity.

3.3 Adsorption kinetics

In order to study the adsorption of CR onto Ni/Cu–BTC and to interpret the results, experimental data obtained were fitted to different kinetic models such as the pseudo-first-order,43 the pseudo-second order44 and an intraparticle diffusion.45 These models can be expressed as:
 
Pseudo-first order model: ln(qeqt) = ln(qe) − K1t (5)
 
image file: c4ra05772d-t5.tif(6)
 
Intra-particle diffusion model: qt = K3t1/2 + C (7)
where qe and qt (mg g−1) are the uptake of CR at equilibrium and at time t (min), respectively, while K1 (min−1) is the adsorption rate constant, K2 (g mg−1 min−1) the rate constant of second-order equation, and K3 (mg g−1 min−1/2) is the intra-particle diffusion rate constant.

In order to quantitatively compare the applicability of different kinetic models in fitting to data, a normalized standard deviation, Δq (%), was calculated as below:

 
image file: c4ra05772d-t6.tif(8)

The effect of contact time on adsorption capacity of Cu–BTC, Ni30/Cu–BTC, Ni50/Cu–BTC, Ni80/Cu–BTC to CR is shown in Fig. 6. The figure shows that the adsorption capacity for CR increases with the increase of contact time, and the adsorption reaches equilibrium within about 4 h. The saturation capacities of 828.50 mg g−1, 903.40 mg g−1, 999.20 mg g−1, 658.40 mg g−1 are obtained at 4 h contact time, 600 mg L−1 initial concentration, 7 pH value and 0.4 g L−1 adsorbent dose. The figure also shows that rapid increase in capacity for the dyes is achieved during the first 1 h. The fast adsorption at the initial stage may be due to the availability of the uncovered surface area and the remaining active sites on the Ni/Cu–BTC.


image file: c4ra05772d-f6.tif
Fig. 6 Effect of contact time on the adsorption capacity of CR onto Cu–BTC, Ni30/Cu–BTC, Ni50/Cu–BTC, and Ni80/Cu–BTC (t = 0.5–5 h, pH = 7, dose = 0.4 g L−1, T = 323 K).

The experimental kinetic data of CR, calculated from eqn (5)–(7), were correlated by three kinetic models: pseudo-first order, pseudo-second order and intra-particle diffusion models. The calculated constants of the three kinetic equations along with R2 values at different temperatures are presented in Table SI.4. As is seen in Table SI.4, there is a large difference between the experimental and calculated adsorption capacity values when the pseudo-first model was applied. However, high R2 values (0.993) are obtained with the linear plot of t/qt versus t, suggesting the pseudo-second order adsorption kinetics. Additionally, the pseudo-second order kinetic model predicts a good agreement between the experimental and calculated adsorption capacity values Δq (%). According to intra-particle diffusion model, a plot of the amount of dye adsorbed (qt) versus the square root of time (t1/2) should be linear, and if these lines pass through the origin, then the intra-particle diffusion is the only rate-controlling step.45 Plots of qt against t1/2 are shown in Fig. 7. However, it can be seen from the Fig. 7 that there are distinctly separated linear regions on the as-prepared adsorbents toward CR, illustrating that multiple stages were involved in the adsorption process. The results indicated that the adsorption of CR dye involved more than one process, and the intra-particle transport is not the rate-limiting step. Such finding is similar to that made in previous works on adsorption.45


image file: c4ra05772d-f7.tif
Fig. 7 Weber–Morris intra-particle diffusion plots for the adsorption of CR on the adsorbents.

3.4 Adsorption thermodynamics

Thermodynamic behavior of CR adsorption onto Ni/Cu–BTC was evaluated by the thermodynamic parameters including the changes in free energy (G), enthalpy (H), and entropy (S). These parameters are calculated from the following equations:
 
image file: c4ra05772d-t7.tif(9)
 
ΔG = −RT[thin space (1/6-em)]ln(Kd) (10)
 
image file: c4ra05772d-t8.tif(11)
where R is the universal gas constant 8.314 (J mol−1 K−1), T is the temperature (K), and Kd is the distribution coefficient for the adsorption.

Then, according to eqn (9), (10) and (11), the ΔH and ΔS parameters for CR adsorption can be derived from the slope and intercepts of the plot of ln(Kd) versus 1/T (Fig. 8). The calculated values of ΔH, ΔS, and ΔG are listed in Table SI.5.


image file: c4ra05772d-f8.tif
Fig. 8 Plot of ln(Kd) versus 1/T for CR adsorption on Cu–BTC and Ni50/Cu–BTC.

The obtained values for Gibbs free energy change (ΔG) are −17.70 and −17.90, −18.60 and −19.20, −19.50 and −20.50 kJ mol−1 for CR adsorption on Cu–BTC and Ni50/Cu–BTC at 303, 313 and 323 K respectively. The negative ΔG values indicate thermodynamically spontaneous nature of the adsorption. The decrease in ΔG values with increasing temperature shows a decrease in feasibility of adsorption at higher temperatures. The ΔH parameters are 8.83 and 22.30 kJ mol−1 for CR adsorption onto Cu–BTC and Ni50/Cu–BTC, respectively. The positive ΔH is an indicator of endothermic nature of the adsorption and its magnitude also gives information on the type of adsorption, which can be either physical or chemical.

Mattson and Mark46 have reported that the enthalpy changes for the adsorption of organic molecules from aqueous solution onto adsorbents are usually within the range 8–65 kJ mol−1. The enthalpy change due to chemisorption takes value between 84 and 420 kJ mol−1 and <84 kJ mol−1 are typically those of physical adsorption type bonds.47 Therefore, the adsorption of CR onto Ni/Cu–BTC is likely to be physisorption. The ΔS values are 87.67 and 132.70 J mol−1 for CR adsorption on Cu–BTC and Ni50/Cu–BTC, respectively. The positive ΔS value suggests an increase in the randomness at adsorbent–solution interface during the adsorption process.

4. Conclusion

Partial doping of the Cu–BTC with a metal Ni(II) ion has been successfully carried out. Characterization of this double metals organic porous material was confirmed by XRD, TGA, SEM, ICP and N2 adsorption. The Ni/Cu–BTC materials prepared have higher adsorption capacities for CR from waste water. The adsorption results support the assumption that Ni is actually incorporated into the framework and that it plays an important role in the dye adsorption process, even being incorporated into unexposed metal sites that are less accessible to dye molecules. This study opens the possibility of doping different MOFs with a variety of metal ions during solvothermal crystallization, with the aim of improving their adsorption properties for environmental and energy applications, as well as for other potential applications in the fields of adsorption separation.

Acknowledgements

This work was supported by the Public Projects of Zhejiang Province of China (no. 2013C31093), Zhejiang Qianjiang Talent Project (no. QJD1302014) and The Financial Support by Open Research Fund of Top Key Discipline of Chemistry in Zhejiang Provincial Colleges and Key Laboratory of the Ministry of Education for Advanced Catalysis Materials (Zhejiang Normal University).

Notes and references

  1. S. Papic, N. Koprivanac, A. L. Bozic and A. Metes, Dyes Pigm., 2004, 62, 291 Search PubMed.
  2. G. Mezohegyi, F. P. Zee, J. Font, A. Fortuny and A. Fabregat, J. Environ. Manage., 2012, 102, 148 CrossRef CAS PubMed.
  3. A. A. Jalil, S. Triwahyono, S. H. Adam, N. D. Rahim, M. A. A. Aziz, N. H. H. Hairom, N. A. M. Razali, M. A. Z. Abidin and M. K. A. Mohamadiah, J. Hazard. Mater., 2010, 181, 755 CrossRef CAS PubMed.
  4. G. Crini, Bioresour. Technol., 2003, 90, 193 CrossRef CAS.
  5. G. Crini, Bioresour. Technol., 2005, 97, 1061 CrossRef PubMed.
  6. I. D. Mall, V. C. Srivastava, N. K. Agarwal and I. M. Mishra, Chemosphere, 2005, 61, 492 CrossRef CAS PubMed.
  7. F. Meng, Z. Hong, J. Arndt, M. Li, M. Zhi, F. Yang and N. Wu, Nano Res., 2012, 5, 213 CrossRef CAS PubMed.
  8. A. N. Soon and B. H. Hameed, Desalination, 2011, 269, 1 CrossRef CAS PubMed.
  9. A. K. Verma, R. R. Dash and P. Bhunia, J. Environ. Manage., 2012, 93, 154 CrossRef CAS PubMed.
  10. J. Guo, D. Jiang, Y. Wu, P. Zhou and Y. Lan, J. Hazard. Mater., 2011, 194, 290 CrossRef CAS PubMed.
  11. H. S. El-Desoky, M. M. Ghoneim, R. El-Sheikh and N. M. Zidan, J. Hazard. Mater., 2010, 175, 858 CrossRef CAS PubMed.
  12. T. Tasaki, T. Wada, K. Fujimoto, S. Kai, K. Ohe, T. Oshima, Y. Baba and M. Kukizaki, J. Hazard. Mater., 2009, 162, 1103 CrossRef CAS PubMed.
  13. L. Xu, L. Du, C. Wang and W. Xu, J. Membr. Sci., 2012, 409–410, 329 CrossRef CAS PubMed.
  14. Y. L. Song, J. T. Li and H. Chen, J. Chem. Technol., 2008, 15, 443 CAS.
  15. M. X. Zhu, L. Lee, H. H. Wang and Z. Wang, J. Hazard. Mater., 2007, 149, 735 CrossRef CAS PubMed.
  16. Y. Slokar and A. L. Marechal, Dyes Pigm., 1998, 37, 335 CrossRef CAS.
  17. N. Sakkayawong, P. Thiravetyan and W. J. Nakbanpote, J. Colloid Interface Sci., 2005, 286, 36 CrossRef CAS PubMed.
  18. M. Amini, M. Arami, N. M. Mahmoodi and A. Akbari, Desalination, 2011, 267, 107 CrossRef CAS PubMed.
  19. S. S. Y. Chui, M. F. Lo, J. P. H. Charmant, A. G. Orpen and I. D. Williams, Science, 2009, 28, 1148 Search PubMed.
  20. A. U. Czaja, N. Trukhan and U. Muller, Chem. Soc. Rev., 2009, 38, 1284 RSC.
  21. H. Hou, G. Li, L. Li, Y. Zhu, X. Meng and Y. Fan, Inorg. Chem., 2003, 42, 428 CrossRef CAS.
  22. S. Furukawa, K. Hirai, Y. Takashima, K. Nakagawa, M. Kondo, T. Tsuruoka, O. Sakata and S. Kitagawa, Chem. Commun., 2009, 5097–5099 RSC.
  23. K. Hirai, S. Furukawa, M. Kondo, H. Uehara, O. Sakata and S. Kitagawa, Angew. Chem., Int. Ed., 2011, 50, 8057 CrossRef CAS PubMed.
  24. Y. Jiang, J. Huang, S. Marx, W. Kleist, M. Hunger and A. Baiker, J. Phys. Chem. Lett., 2010, 1, 2886 CAS.
  25. A. M. Shultz, A. A. Sarjeant, O. K. Farha, J. T. Hupp and S. B. T. Nguyen, J. Am. Chem. Soc., 2011, 133, 13252 CrossRef CAS PubMed.
  26. H. Deng, C. J. Doonan, H. Furukawa, R. B. Ferreira, J. Towne, C. B. Knobler, B. Wang and O. M. Yaghi, Science, 2010, 327, 846 CrossRef CAS PubMed.
  27. H. Chun, D. N. Dybtsev, H. Kim and K. Kim, Chem.–Eur. J., 2005, 11, 3521 CrossRef CAS PubMed.
  28. T. Fukushima, S. Horike, Y. Inubushi, K. Nakagawa, Y. Kubota, M. Takata and S. Kitagawa, Angew. Chem., Int. Ed., 2010, 49, 4820 CrossRef CAS PubMed.
  29. M. Banerjee, S. Das, M. Yoon, H. J. Choi, M. H. Hyun, S. M. Park, G. Seo and K. Kim, J. Am. Chem. Soc., 2009, 131, 7524 CrossRef CAS PubMed.
  30. J. R. Karra and K. S. Walton, Langmuir, 2008, 24, 6270 CrossRef PubMed.
  31. W. Dai, J. Hu, L. M. Zhou, S. Li, X. Hu and H. Huang, Energy Fuels, 2013, 27, 816 CrossRef CAS.
  32. I. Langmuir, J. Am. Chem. Soc., 1916, 38, 2221 CrossRef CAS.
  33. H. M. F. Freundlich, Z. Phys. Chem., 1906, 57, 385 CAS.
  34. B. Subramanyam and D. Ashutosh, Int. J. Environ. Res., 2012, 6, 265 CAS.
  35. F. Pu, X. Liu, B. Xu, J. Ren and X. Qu, Chem.–Eur. J., 2012, 18, 4322 CrossRef CAS PubMed.
  36. L. Wang, J. Li, Y. Wang, L. Zhao and Q. Jiang, J. Chem. Eng., 2012, 18, 172 Search PubMed.
  37. A. Afkhami and R. Moosavi, J. Hazard. Mater., 2010, 174, 398 CrossRef CAS PubMed.
  38. K. Nagarethinam and M. Mariappan, Water, Air, Soil Pollut., 2002, 138, 289 CrossRef.
  39. A. Bhatnagar, A. K. Jain and M. K. Mukul, Environ. Chem. Lett., 2005, 2, 199 CrossRef CAS.
  40. K. Kadirvelu, M. Kavipriya, C. Karthika, M. Radhika, N. Vennilamani and S. Pattabhi, Bioresour. Technol., 2003, 87, 129 CrossRef CAS.
  41. K. Chou, J. Tsai and C. Lo, Bioresour. Technol., 2001, 78, 217 CrossRef CAS.
  42. F. A. Pavan, S. L. P. Dias, E. C. Lima and E. V. Benvenutti, Dyes Pigm., 2008, 76, 64 CrossRef PubMed.
  43. S. Langergen and B. K. Svenska, Veteruskapsakad Handlingar, 1898, 24, 1 Search PubMed.
  44. Y. S. Ho and G. Mckay, Process Biochem., 1999, 34, 451 Search PubMed.
  45. G. Annadurai, R. S. Juang and D. J. Lee, J. Hazard. Mater., 2002, 92, 263 CrossRef CAS.
  46. J. Mattson and H. Mark, Activated Carbon: Surface Chemistry and Adsorption from Solution, Marcel Dekker, Ins., New York, 1971 Search PubMed.
  47. S. Faust and O. Aly, Adsorption Processes for Water Treatment, Butterworth Publishers, 1987 Search PubMed.

Footnote

Electronic supplementary information (ESI) available. See DOI: 10.1039/c4ra05772d

This journal is © The Royal Society of Chemistry 2014