
Raman spectroscopy as a novel tool for fast characterization of the chemical composition of perivascular adipose tissue†
Krzysztof
Czamara
 a,
Zuzanna
Majka
ab,
Aleksandra
Fus
ab,
Kamila
Matjasik
ab,
Marta Z.
Pacia
a,
Magdalena
Sternak
a,
Stefan
Chlopicki
ac and
Agnieszka
Kaczor
*ab
a,
Zuzanna
Majka
ab,
Aleksandra
Fus
ab,
Kamila
Matjasik
ab,
Marta Z.
Pacia
a,
Magdalena
Sternak
a,
Stefan
Chlopicki
ac and
Agnieszka
Kaczor
*ab
aJagiellonian Centre for Experimental Therapeutics (JCET), Jagiellonian University, 14 Bobrzynskiego Str., 30-348 Krakow, Poland. E-mail: agnieszka.kaczor@uj.edu.pl
bFaculty of Chemistry, Jagiellonian University, 2 Gronostajowa Str., 30-387 Krakow, Poland
cChair of Pharmacology, Jagiellonian University, 16 Grzegorzecka Str., 31-531 Krakow, Poland
First published on 26th September 2018
Abstract
One of the new targets of untapped therapeutic potential is perivascular adipose tissue (pVAT). pVAT releases a plethora of pro- and anti-inflammatory agents and is involved in the inflammatory response of the vascular wall, playing a key role in various cardiovascular pathologies. Both fiber optic Raman spectroscopy with a high-spatial resolution probe and Raman microscopy were applied to study various types of adipose tissue with the emphasis on pVATs of the thoracic and abdominal aorta and the mesenteric artery, as well as epididymal and interscapular adipose tissue for comparison. Our results demonstrated that the lipid unsaturation degree was clearly distinct in various types of adipose tissue and was influenced by the age of animals. In particular, the basal unsaturation level of pVATs of the abdominal aorta and the mesenteric artery was considerably higher than that of the thoracic aorta and a significant increase of the unsaturation level of pVAT with age was observed showing that aging has a considerable impact on the pVAT's chemical composition. Overall, our results show that Raman spectroscopy is a sensitive tool to determine the perivascular adipose tissue chemical composition that appears to be vascular-bed specific.
Introduction
It is known that the state of the vascular endothelium determines the condition of the cardiovascular system and its dysfunction leads to the development of lifestyle diseases. The influence of the endothelium on blood vessels can be described as “from inside to outside” and is relatively well understood, also from the spectroscopic perspective. In recent years we have been exploring the potential of Raman spectroscopy by investigation of various models of endothelium-based diseases, such as hypertension,1 diabetes,2 atherosclerosis,3 cancer metastasis4 or aortic stenosis.5,6 Additionally, cell models have been applied to study early apoptosis and inflammation7,8 associated with the development of these pathologies. Recent studies have demonstrated that progression of lifestyle diseases also involves significantly the arteries surrounding perivascular adipose tissue (pVAT). pVAT has endocrine activity and it has been recognized as a novel factor involved in the progression of vascular diseases i.e. atherosclerosis and obesity.9 The influence of pVAT on the cardiovascular system can be described as “from outside to inside”. pVAT's adipocytes secrete pro- and anti-inflammatory adipokines, cytokines and vasoactive substances which diffuse into the vessel wall and can affect the endothelial layer causing its dysfunction. Moreover, impaired function, damage or excess pVAT accumulation directly induce vascular inflammation that intensifies the development of cardiovascular diseases.9 The important deposits of pVAT are located around the aorta. Interestingly, aortic pVAT is heterogeneous and its phenotype changes along the aorta.10 pVAT of the thoracic aorta exhibits features of the brown adipose tissue (BAT) due to the densely packed mitochondria and highly vascularized architecture. The main function of BAT is generating heat via non-shivering thermogenesis by the action of the mitochondrial uncoupling protein (UCP1). This fat is also protective against atherosclerosis,10 but during obesity it can adopt a white-like phenotype manifested by an increased lipid accumulation.11 On the other hand, pVAT of the abdominal aorta resembles the white adipose tissue (WAT). Its main function is to store lipids and maintain triacylglicerols’ (TAGs) homeostasis. Moreover, pVAT of the abdominal aorta is responsive to a high-fat diet by expression of cytokines and participation in the inflammation process. It means that the aorta in the abdominal part is less resistant to alterations arising from atherosclerosis.10 Additionally, the pVAT that surrounds the mesenteric arteries of the small intestine possesses a phenotype similar to WAT with large lipid droplets and low expression of the UCP1 protein.12Nowadays, a lot of effort is put to develop Raman-based diagnostics. Raman spectroscopy can be combined with endoscopic optical fibers for endoscopy of internal organs or applied with handheld probes to use for intraoperative diagnostics. Up to now, Raman fiber optic spectroscopy has been used mostly to characterize malignant tissues and delineate tumor margins12–17 and there are rather scarce reports about the applications of fiber optic probes to study arteries mostly related to the molecular diagnosis of coronary lesions and arterial plaque depositions.18 In this work, we demonstrate the preliminary results showing the potential applicability of fiber probe Raman spectroscopy for an assessment of the composition of the pVAT in various parts of the vascular bed (the thoracic and abdominal aorta and the mesenteric artery) in comparison with other types of adipose tissue (epididymal and interscapular adipose tissue). Our far-fetched goal was to find the potential application of fiber probe Raman spectroscopy in bypass surgery to verify the degree of degradation and alteration of lipid composition in the perivascular fat surrounding the vascular graft. It is of particular importance in light of long-lasting controversies whether implanted arteries should be dissected in a skeletonized (free of all surrounding tissue, including pVAT) or pedicled (including all the surrounding tissue) manner during coronary artery bypass graft surgery.19 Our results demonstrated that the chemical composition of adipose tissues of various types differs significantly and their chemical composition is age-dependent. This is important in the context of site-dependent response of the vasculature on the development of cardiovascular disease which needs to be verified in further research.
Experimental
Preparation of perivascular adipose tissue
The samples of the interscapular adipose tissue (iBAT), the epididymal adipose tissue (eWAT) and the perivascular adipose tissues (pVATs) of the thoracic and abdominal aorta, and the mesenteric artery were isolated from wild type C57BL/6J mice at the age of 10 (n = 7), 16 (n = 5) and 22 (n = 5) weeks. The first one, iBAT, in the form of two lobes is located on the back of the murine body close to shoulder blades, while eWAT is attached to each epididymis and testicle. pVAT of the thoracic aorta was resected from the descending aorta after the aortic arch and pVAT of the abdominal aorta from the part of the artery lying in the abdominal cavity.20 After resection, the samples were rinsed in NaCl isotonic solution to remove the traces of blood and placed onto a calcium fluoride substrate. The thus-prepared fresh fragments of fats were measured by Raman spectroscopy. All procedures involving animals were performed in strict accordance with the Guidelines for Animal Care and Treatment of the European Union and were approved by the Local Animal Ethics Commission in Krakow, Poland (control animals from experiment No. 326/2017).Instrumentation
The Raman spectra of the iBAT, eWAT and pVAT samples were recorded using a confocal WITec Alpha300 Raman spectrometer (WITec, Ulm, Germany) equipped with an air-cooled solid state laser with an excitation wavelength of 532 nm, a 20× air objective (Nikon S Plan Flour, NA = 0.45), a UHTS 300 spectrograph (600 grooves mm−1 grating, spectral resolution of ca. 3 cm−1) and a CCD detector (Andor, DU401A-BV-352). The maximum laser power at the sample (∼20 mW) was applied for acquisition of single spectra with 32 accumulations and the integration time of 0.5 s. For each sample at least 7 single Raman spectra were collected, normalized in the 1800–400 cm−1 spectral range and averaged.Raman fiber optic probe measurements of periaortic pVAT samples of C57BL/6J mice at the age of 22 (n = 5) weeks were performed with a prototype of a portable WITec Alpha Cart system equipped with a lens-based spectrograph (600 lines per mm grating), a low-noise CCD detector (Andor) and an air-cooled solid state laser with an excitation wavelength of 532 nm. Laser light was provided via a photonic fiber (3.5 μm) and focused onto the sample with a probe ending with a 10× magnification air objective (Zeiss, NA = 0.23). Spectra were collected with the maximum laser power of ca. 28 mW with 10 accumulations and 1 s integration time.
Data analysis
All Raman spectra were baseline-corrected using autopolynomial of degree 3 and subsequently subjected to an automatic cosmic ray removal procedure. Preprocessing was done using the WITec Project Plus software. Raman spectra were averaged per type of fat tissue and standard deviation was calculated at each data point using the OriginPro 9.1 program. The OPUS 7.2 program was used for further data evaluation: vector normalization in the 1800–400 cm−1 spectral range and calculations of the integral intensity of the bands at ca. 1660 and 1445 cm−1 enabling the computation of the degree of unsaturation (I1660/I1445). The results were tested by analysis of variance performed using the OriginPro 9.1 software (ANOVA model with Tukey's test) to characterize quantitatively the differences in the unsaturation of lipids in various types of the adipose tissue.Results and discussion
General characteristics of the chemical composition of lipids in iBAT, eWAT and pVATs
The adipose tissue has been traditionally categorized into three types according to its function and phenotype including brown (BAT), white (WAT) and beige or brite adipose tissues. BAT depots are located in defined anatomical regions mainly in interscapular, axillary and perirenal areas, while WAT occurs abundantly in the subcutaneous and intra-abdominal parts of the body.21 Interestingly, the beige or brite adipose tissue is found interspersed in WAT depots. The brite adipose tissue possesses the phenotype in-between BAT and WAT with adipocytes adopting a BAT-like phenotype in response to i.e. cold exposure.22 Another type of classification involves the localization of fats and enables to distinguish the subcutaneous, visceral and perivascular adipose tissue (pVAT). The latter, in the last few years, has been emerging as an endocrine organ actively taking part in the regulation of the vascular tone and vascular inflammatory response.23,24In this work, we selected the representative samples of BAT, WAT and pVATs from well-defined regions in the murine body (marked with the red color) as presented in Fig. 1.
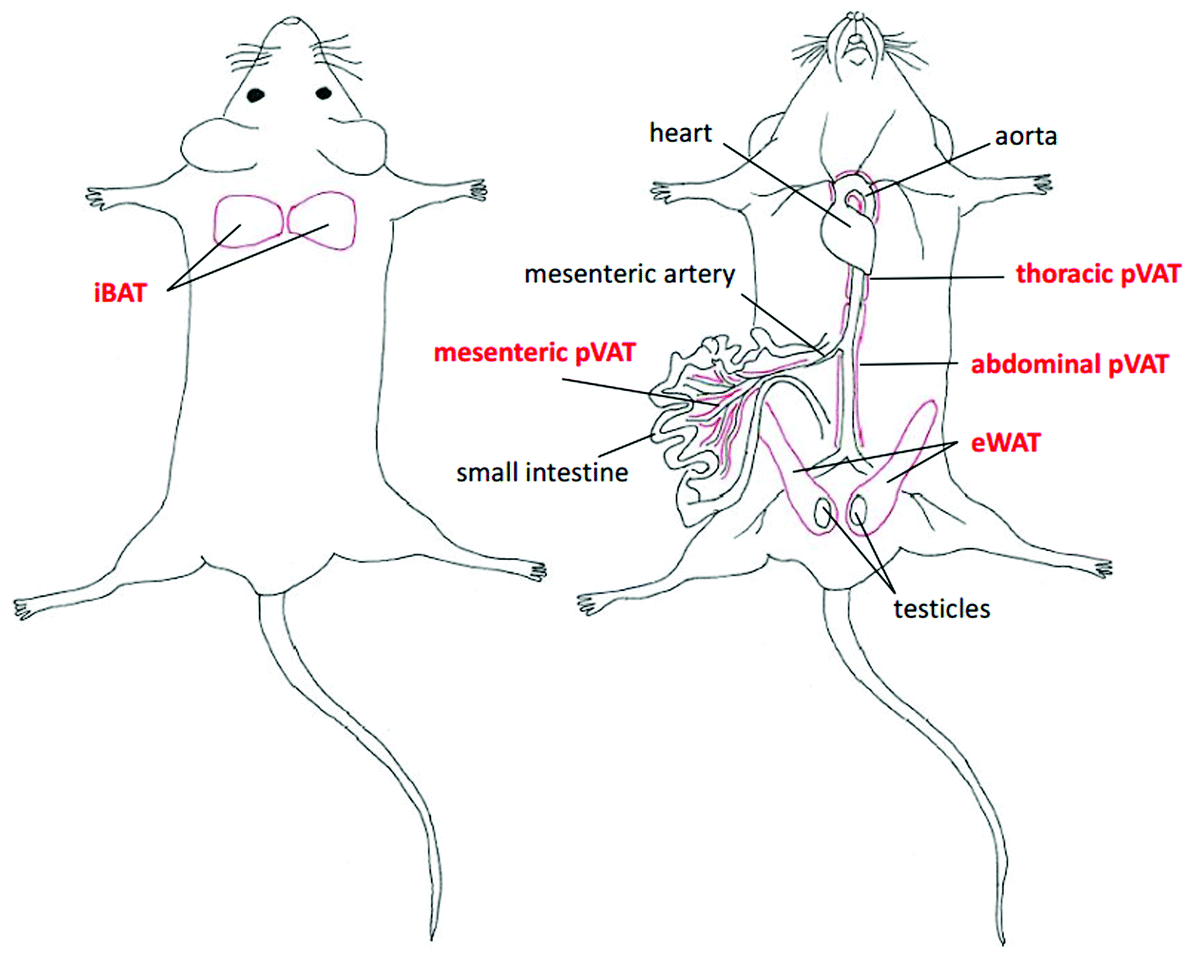 | ||
| Fig. 1 Distribution of selected adipose tissue depots. The localization of chosen types of fat tissues including the interscapular brown adipose tissue (iBAT), epididymal white adipose tissue (eWAT), and perivascular adipose tissues (pVATs) of the thoracic and abdominal aorta and the mesenteric artery. | ||
To study the differences in the chemical composition of the brown and white adipose tissue the interscapular brown adipose tissue (iBAT) and epididymal white adipose tissue (eWAT) were chosen together with pVATs surrounding the thoracic and the abdominal aorta and the vascular bed of the superior mesenteric artery. All of the above-mentioned adipose tissues of mice at the age of 10 weeks were characterized with Raman spectroscopy. Averaged Raman spectra of iBAT, thoracic, abdominal and mesenteric pVATs, and eWAT are shown in Fig. 2.
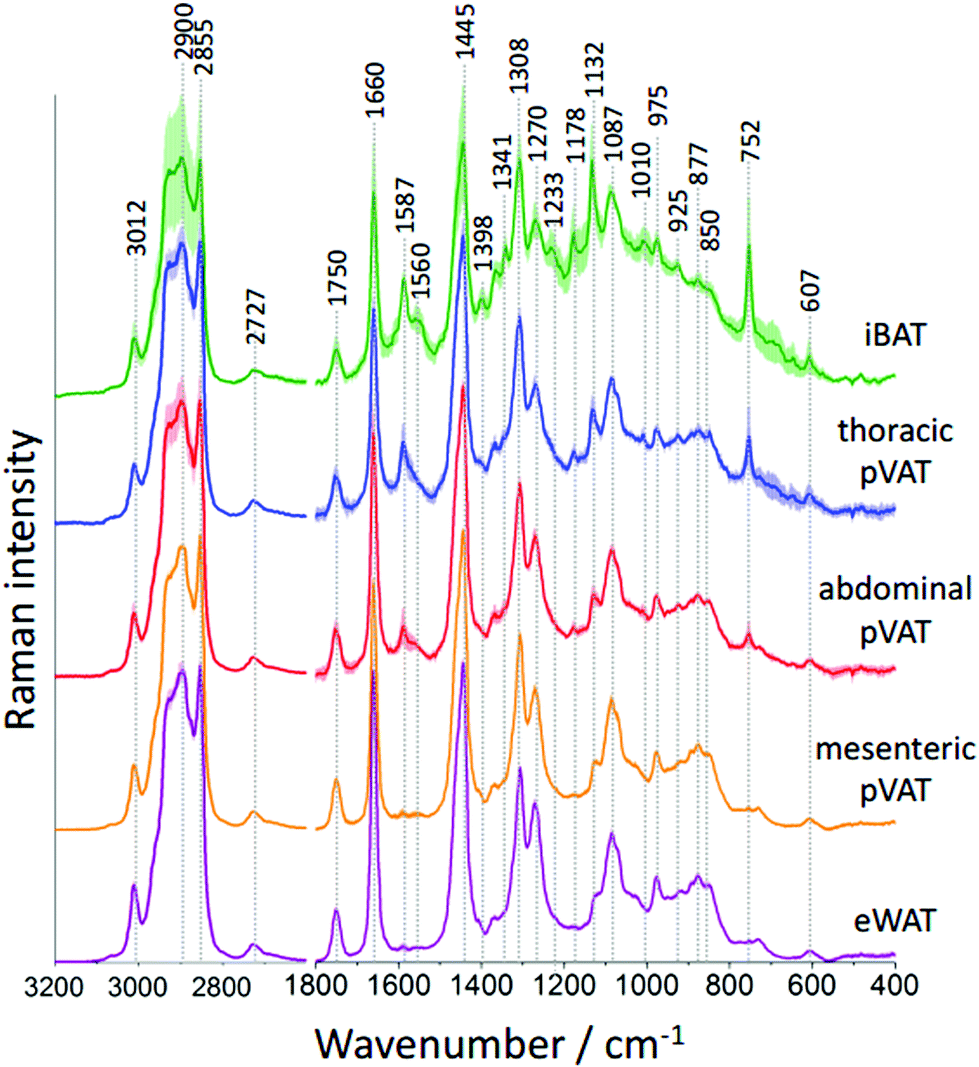 | ||
| Fig. 2 Raman spectra of selected pVAT tissues as compared to iBAT and eWAT. Averaged Raman spectra of the interscapular (green, iBAT) and epididymal adipose tissue (purple, eWAT) compared with the spectra of perivascular adipose tissues (pVATs) of the thoracic (blue) and abdominal (red) aorta and the mesenteric artery (orange) obtained from wild type mice. Spectra were normalized and presented with the standard deviation on each data point (shadow around the spectrum), and have been shifted vertically for clarity. All spectra were maximally extended in the y-axis. | ||
Raman spectra of the adipose tissue resemble the typical profile of unsaturated TAGs with a characteristic signal at 1750 cm−1 arising from the C![[double bond, length as m-dash]](https://www.rsc.org/images/entities/char_e001.gif) O stretching vibrations.25 The additional band of ester moiety's vibrations with two well-separated maxima at 877 and 850 cm−1 is visible. The other lipid bands including signals at 1660 and 1270 cm−1 originate from fatty acid chains’ vibrations corresponding to the CC stretching and the C–H deformation modes, respectively. These signals provide information about the degree of unsaturation of lipids. Additionally, signals at 1445, 1087 and 975 cm−1 arising from the CH2/CH3 group deformations, C–C stretching and C–H bending modes, respectively, are observed. The high-wavenumber spectral range also confirms the unsaturated TAGs composition of the studied adipose tissues. This region exhibits a relatively low intensity band at 3012 cm−1 and two intense signals at 2900 and 2855 cm−1 assigned to the C–H and –C–H stretching vibrations, respectively. However, the Raman spectrum of the adipose tissue, especially of brown type, has other distinctive bands carrying information about other biomolecules present in its structure. In the Raman spectrum of iBAT the bands originating from hemeproteins are observed, among others, at 1587, 1341, 1233, 1132 and 752 cm−1.26 Their intensities are high due to the strong resonance enhancement characteristic of all metalloporphyrins when 532 nm excitation is used. Moreover, the presence of hemeproteins is manifested by the increased fluorescence background which causes an increased standard deviation of the average Raman spectrum. The occurrence of hemeproteins in BAT is not surprising. This type of tissue is well vascularized and brown adipocytes are rich in mitochondria where cytochrome c is located.27 However, it is hard to unequivocally prove the presence of cytochrome c based on the obtained Raman spectra because of the overlap of its key marker band with the intense lipid band at 1308 cm−1. Additionally, some low-intensity bands at 1178, 925 and 607 cm−1 are also visible in the Raman profile of the adipose tissue.
O stretching vibrations.25 The additional band of ester moiety's vibrations with two well-separated maxima at 877 and 850 cm−1 is visible. The other lipid bands including signals at 1660 and 1270 cm−1 originate from fatty acid chains’ vibrations corresponding to the CC stretching and the C–H deformation modes, respectively. These signals provide information about the degree of unsaturation of lipids. Additionally, signals at 1445, 1087 and 975 cm−1 arising from the CH2/CH3 group deformations, C–C stretching and C–H bending modes, respectively, are observed. The high-wavenumber spectral range also confirms the unsaturated TAGs composition of the studied adipose tissues. This region exhibits a relatively low intensity band at 3012 cm−1 and two intense signals at 2900 and 2855 cm−1 assigned to the C–H and –C–H stretching vibrations, respectively. However, the Raman spectrum of the adipose tissue, especially of brown type, has other distinctive bands carrying information about other biomolecules present in its structure. In the Raman spectrum of iBAT the bands originating from hemeproteins are observed, among others, at 1587, 1341, 1233, 1132 and 752 cm−1.26 Their intensities are high due to the strong resonance enhancement characteristic of all metalloporphyrins when 532 nm excitation is used. Moreover, the presence of hemeproteins is manifested by the increased fluorescence background which causes an increased standard deviation of the average Raman spectrum. The occurrence of hemeproteins in BAT is not surprising. This type of tissue is well vascularized and brown adipocytes are rich in mitochondria where cytochrome c is located.27 However, it is hard to unequivocally prove the presence of cytochrome c based on the obtained Raman spectra because of the overlap of its key marker band with the intense lipid band at 1308 cm−1. Additionally, some low-intensity bands at 1178, 925 and 607 cm−1 are also visible in the Raman profile of the adipose tissue.
An interesting aspect of BAT refers to its ability to convert its phenotype toward WAT in the process called whitening. In healthy animals iBAT is surrounded by a thick layer of WAT which can extend in obesity or disease i.e. atherosclerosis.11 In pathological conditions brown adipocytes start to accumulate excessive lipids yielding WAT-like characteristics. Application of Raman spectroscopy for in-depth analysis of the tissue shows that WAT covers iBAT fat in various areas. A simple experiment reveals the differences in the composition of lipids of distinct layers of iBAT (Fig. 1S, ESI†).
The differences in the spectral profile of BAT and WAT are undeniable. A comparison of the Raman spectra of pVATs with the spectra of other fats reveals some similarities. The profile of pVAT of the thoracic aorta quite resembles the profile of the BAT Raman spectrum while pVAT taken from the abdominal aorta exhibits WAT-like characteristics, which is better visible in older mice (see vide infra). Both spectra of pVATs have a significantly less impact from the heme resonance which in the Raman spectrum of pVAT of the mesenteric artery is rather scarce. The most marked differences are visible when comparing bands associated with the unsaturation of lipids. The relationship between the intensity of the bands at 1660 and 1445 cm−1 and the knowledge of Raman signature of unsaturated triacylglycerols show that the Raman profile of the studied adipose tissues matches the profile of triolein (Fig. 2S, ESI†).25 However, the adipose tissue with WAT-like characteristics possesses slightly more intense bands i.e. at 3012 and 1270 cm−1. To evaluate the degree of lipid unsaturation, the ratio of n(CC)/n(CH2) was investigated by calculating the integral intensities of Raman bands at 1660 and 1445 cm−1. The alternative potential criterion is the I1270/I1308 band intensity ratio,28 but here it cannot be applied because the lipid band at 1308 cm−1 overlaps with the v(Cα–Cβ) signal of hemeproteins. The unsaturation ratios calculated for all types of studied tissues are presented in Fig. 3 and estimated with the use of a calibration curve (Fig. 3S, ESI†).
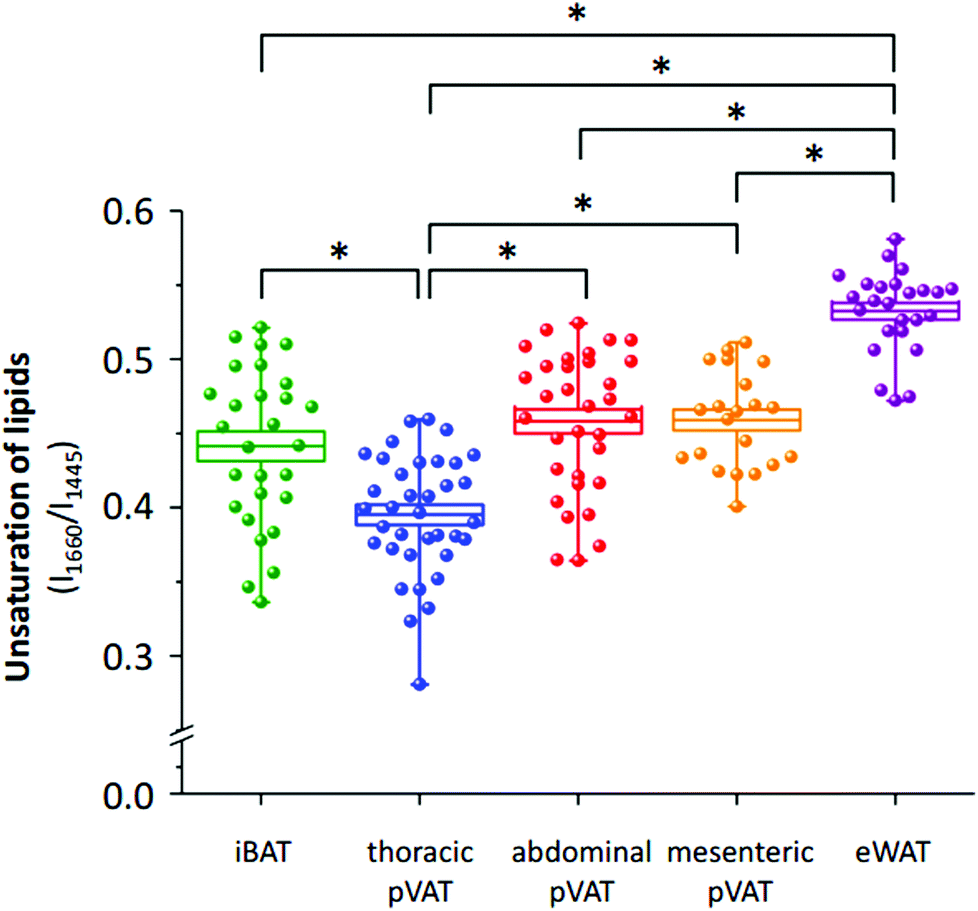 | ||
| Fig. 3 The level of unsaturation of lipids in pVAT tissues as compared with iBAT and eWAT. The analysis of the degree of unsaturation of lipids of the interscapular (green, iBAT) and epididymal adipose tissue (purple, eWAT) and perivascular adipose tissues (pVAT) of the thoracic (blue) and abdominal (red) aorta and the mesenteric artery (orange) calculated using the integral intensity ratio of bands at 1660 and 1445 cm−1. Values are given as mean ± SEM and are shown in box plots: mean (horizontal line), SEM (box), minimal and maximal values (whiskers). *p < 0.001. | ||
The analysis of the intensities of bands of lipid unsaturation reveals distinctive properties of the adipose tissue from different localizations. In general, the white adipose tissue has significantly more unsaturated lipid profile than the brown adipose tissue. This dependence is also reflected in pVATs. pVAT of the thoracic aorta, which possesses BAT-like characteristics, is composed of less unsaturated lipids than that of the abdominal aorta. Interestingly, WAT-like pVATs (abdominal and mesenteric) have a similar degree of lipid unsaturation. In conclusion, Raman-based determination of the unsaturation ratio clearly has the potential for fast characterization of pVAT and its phenotypic changes, particularly whitening or browning of the pVAT tissue.
Age-dependent alterations in aortic pVAT lipids
It is known that inflammatory markers increase in pVAT in an age-dependent manner. The effect of aging on the phenotype of pVAT of the thoracic and abdominal aorta in terms of inflammation-related genes’ expression has been studied on rats.29 Older rats, besides the greater percent of body fat and total cholesterol, exhibited an higher expression of inflammatory markers in the pVAT of the abdominal aorta than the thoracic one compared to younger rats. Similar research has been performed on young and two-year-old control mice and mice fed a high-fat diet.30 The results showed that aging upregulates the oxidative stress and inflammation in the aortic pVAT manifested by the elevated secretion of a wide range of inflammatory chemokines and cytokines. Therefore, one can pose the question if the chemical composition also follows a pattern of changes with aging. To answer this question, we have analyzed the Raman spectra of the pVATs of the thoracic and abdominal aorta of 10, 16 and 22 week-old mice (Fig. 4).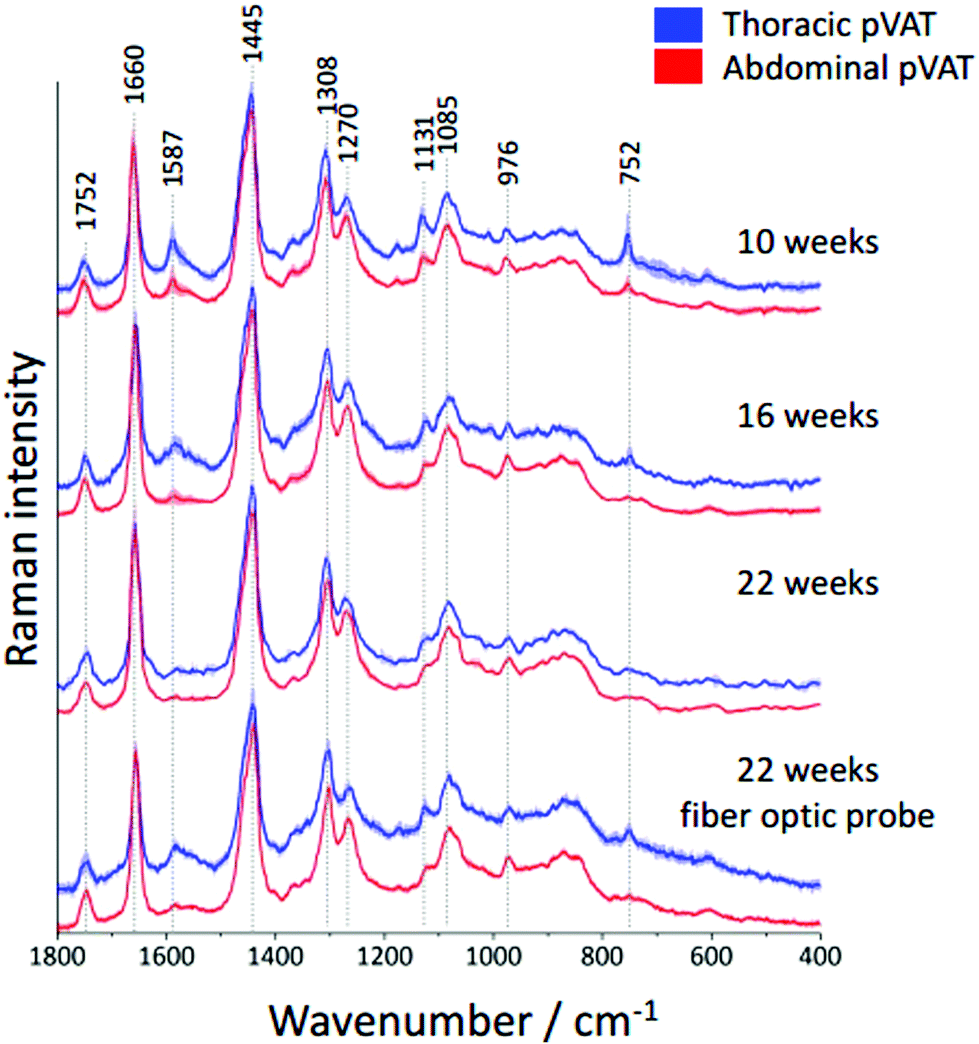 | ||
| Fig. 4 Age-dependent alterations in periaortic pVATs taken from the thoracic and abdominal aorta. Averaged Raman spectra of pVATs of the thoracic (blue) and abdominal (red) aorta obtained from wild type mice at the age of 10, 16 and 22 weeks. Additionally, the Raman spectra of 22-week-old mice collected with a fiber optic probe are compared. All spectra were normalized and presented with the standard deviation on each data point (shown as shadows) and have been shifted vertically for clarity. | ||
Changes in the chemical composition are clearly visible in the Raman spectra and directly reflect the aging of periaortic pVAT. pVAT of the abdominal aorta is composed of more unsaturated lipids than that of the thoracic aorta which is evident by the analysis of the intensity ratio of bands at 1660 and 1445 cm−1 (Fig. 5). Moreover, pVAT of the thoracic aorta exhibits a greater content of heme, based on the presence of bands at i.e. 1587 and 752 cm−1, which gradually diminishes with the age of mice to a practically zero level for 22-week-old animals. It might be related to the whitening of the tissue with age and a decreased content of mitochondria containing cytochrome c. The Raman profile of pVAT of the thoracic aorta for the oldest mice in this experiment resembles the Raman spectrum of pVAT of the abdominal aorta for the 10-week-old animals which is the premise of the age-related change of the fat phenotype towards the white adipose tissue in the process of fat whitening and a decrease of brown adipose tissue depots.31
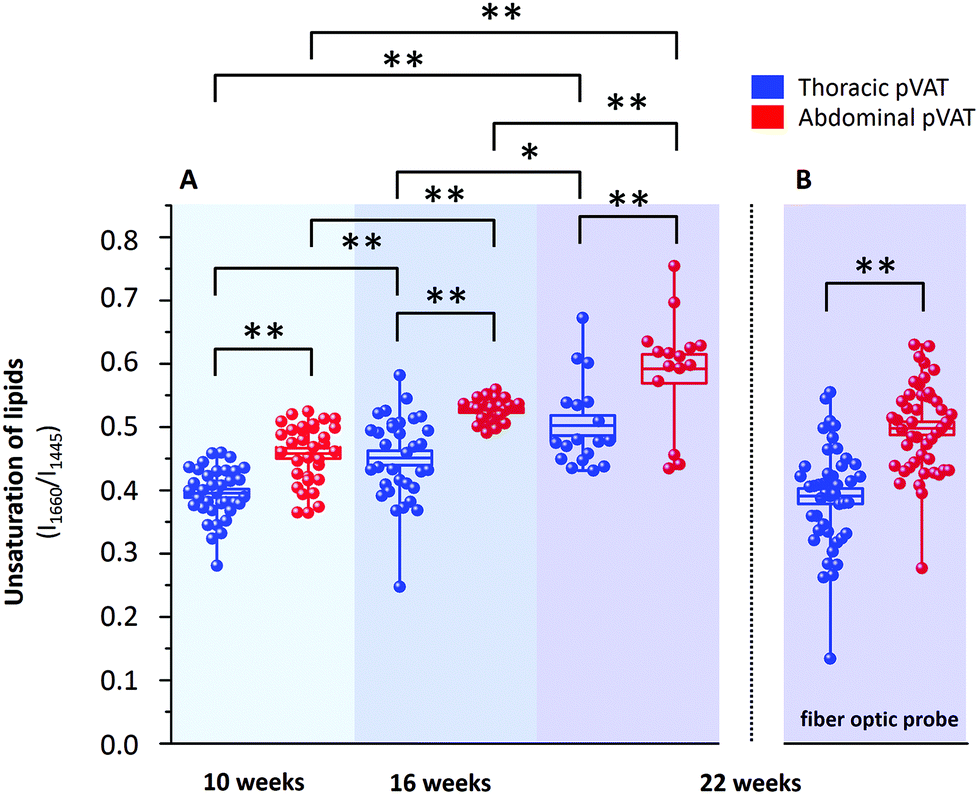 | ||
| Fig. 5 Age-dependent changes in the unsaturation of lipids forming pVAT taken from the thoracic and abdominal aorta. The analysis of the degree of unsaturation of lipids of the thoracic and abdominal aortal pVATs calculated based on the integral intensity ratio of bands at 1660 and 1445 cm−1 measured with a classic Raman spectrometer (A) and with a setup with a fiber optic probe (B). Values given as mean ± SEM are shown in box plots: mean (horizontal line), SEM (box), minimal and maximal values (whiskers). *p < 0.05, **p < 0.01. | ||
The degree of lipid unsaturation in a pair of pVATs of the thoracic and abdominal aorta significantly varies on average by 17% (15.9%, 16.7% and 17.8% for 10, 16 and 22 week-old animals, respectively). This value increases with the age of animals. More importantly, we observed a significant upward trend of lipid unsaturation for each pVAT with age. For 22-week-old mice, the value of degree of lipid unsaturation was increased by 27.1% and 29.2% for pVATs of the thoracic and abdominal aorta, respectively, compared to 10-week-old subjects. The increase of unsaturation is, therefore, slightly faster for pVAT of the abdominal aorta compared with the thoracic aorta. These findings may have important implications in the pathogenesis of atherosclerosis and other cardiovascular disease.
As mentioned above, currently Raman-based diagnostics has been dynamically developed. Therefore, we tested the applicability of Raman fiber optic probe spectroscopy to study pVAT lipids. The same samples of periaortic pVATs of 22-week-old mice were studied with the prototype of portable Raman spectrometer WITec Alpha Cart equipped with a fiber probe ending with a 10× magnification objective. Averaged Raman spectra of pVATs of the thoracic and abdominal aorta are shown in Fig. 4 and the unsaturation level of lipids calculated based on the spectra is given in Fig. 5B. The results have the same quality as those obtained with the Raman microscope. To demonstrate this point, a comparison of exemplary raw Raman spectra obtained using both systems are shown (Fig. 4S, ESI†). Based on the spectra, the pVATs taken from the thoracic and abdominal aorta can be easily distinguished. Although the values of the unsaturation ratio quantitatively differ for the data obtained using the Raman microscope (due to slightly different spectral resolution, etc.), the differences in the unsaturation level for pVATs of the abdominal and thoracic aorta for a setup with the probe and the microscope are exactly the same. This demonstrates the applicability of Raman fiber probe spectroscopy in the characterization of the adipose tissue.
Conclusions
One of the new targets of untapped therapeutic potential is perivascular adipose tissue (pVAT). pVAT releases a plethora of pro- and anti-inflammatory agents and is involved in the inflammatory response playing a key role in various cardiovascular pathologies including atherosclerosis.32 It has been proven that immune cell infiltration occurs both from the luminal and adventitial side of the vessel wall33 and this “outside-in” signaling is related to the paracrine capacity of pVAT that releases, among others, leptin, adiponectin, resistin, tumor necrosis factor, monocyte chemoattractant protein-1 and angiopoietin 2.32 It is also known that significant upregulation of several pro-inflammatory chemokines and macrophage markers occurs in pVAT in hypertriglyceridemia and obesity with pVAT of the abdominal aorta showing a greater response than that of the thoracic aorta.34 Moreover, the expression of inflammatory genes and immune cell infiltration were shown to significantly increase with age particularly in pVAT of the abdominal aorta relative to the thoracic aorta, showing that abdominal pVAT mainly composed of WAT displays more pronounced inflammation than thoracic pVAT which has rather BAT-like characteristics.29 We, therefore, decided to use Raman spectroscopy to investigate the chemical composition of various types of adipose tissue, with the emphasis on perivascular aortic tissue. We have found that the lipid unsaturation ratio of the adipose tissue is type-specific and that of the perivascular adipose tissue is vascular-bed specific. In particular, the level of lipid unsaturation of pVAT of the abdominal aorta (and curiously of the mesenteric artery which is a model for microcirculation) is significantly higher than that of pVAT of the thoracic aorta. Moreover, a significant increase of the unsaturation level that might suggest whitening of pVAT with age were observed showing that aging has a considerable impact on the pVAT chemical composition. Overall, this shows the potential of Raman spectroscopy in determining the composition of the adipose tissue. Our results were obtained using a new type of Raman fiber optic setup operating with 532 nm excitation, using a fiber optic probe equipped with a 10× objective ensuring good spatial resolution, and compared with the data obtained using a Raman microscope. We have shown that fiber optic Raman spectroscopy enables fast discrimination of periaortic pVATs extracted from different locations. Additionally, it was demonstrated that the chemical composition of all types of adipose tissue considerably differs, particularly with respect to the lipid unsaturation ratio, and that aging significantly and in a tissue-dependent manner affects the lipid composition of aortic pVATs. Both observations of a higher lipid unsaturation and a slightly higher increase of lipid unsaturation with age for pVAT of the abdominal aorta relative to pVAT of the thoracic aorta can be linked to the WAT-type of perivascular adipose tissue of the abdominal aorta as compared to the BAT-type of perivascular adipose tissue of the thoracic aorta. Further research needs to be done in order to determine how this distinct Raman-based signature of pVATs in various parts of the vasculature changes in cardiovascular pathology. This is of importance in the context of potential Raman-based diagnostics in bypass surgery to verify the status of the implanted graft. Also, it may become an argument in a long-lasting discussion whether implanted arteries should be dissected in a skeletonized (free of all surrounding tissue, including pVAT) or pedicled (including all the surrounding tissue) manner during coronary artery bypass graft surgery.19 Further research needs to be done in order to determine the chemical changes of pVAT in cardiovascular pathologies and in human implanted arteries.Author contributions
SC and AK conceived and designed the experiments. KCz, ZM, AF, MZP and KM performed the Raman experiments. KCZ, MS and MZP prepared adipose tissue samples. KCz, AF, ZM, KM and AK analyzed the data. KCz and AK wrote the paper. All authors reviewed the manuscript.Compliance with ethical standards
All experimental procedures involving animals were conducted according to the Guidelines for Animal Care and Treatment of the European Communities and the Guide for the Care and Use of Laboratory Animals published by the US National Institutes of Health (NIH Publication No. 85–23, revised 1996). All procedures were approved by the Local Ethical Committee on Animal Experiments.Conflicts of interest
The authors declare that they have no competing interests.Acknowledgements
We would like to thank Ms. Agnieszka Jasztal (JCET JU) for her valuable remarks and expertise in recognition of different types of the adipose tissue.This work was supported by National Science Centre mainly by OPUS9 grant DEC-2015/17/B/ST4/03894 and partially by SYMFONIA Grant DEC-2015/16/W/NZ4/00070.
References
- M. Z. Pacia, L. Mateuszuk, S. Chlopicki, M. Baranska and A. Kaczor, Analyst, 2015, 140, 2178–2184 RSC.
- M. Pilarczyk, L. Mateuszuk, A. Rygula, M. Kepczynski, S. Chlopicki, M. Baranska and A. Kaczor, PLoS One, 2014, 9, e106065 CrossRef PubMed.
- A. Rygula, M. Z. Pacia, L. Mateuszuk, A. Kaczor, R. B. Kostogrys, S. Chlopicki and M. Baranska, Analyst, 2015, 140, 2185–2189 RSC.
- M. Z. Pacia, E. Buczek, A. Blazejczyk, A. Gregorius, J. Wietrzyk, S. Chlopicki, M. Baranska and A. Kaczor, Anal. Bioanal. Chem., 2016, 408, 3381–3387 CrossRef CAS PubMed.
- M. Pilarczyk, K. Czamara, M. Baranska, J. Natorska, P. Kapusta, A. Undas and A. Kaczor, J. Raman Spectrosc., 2013, 44, 1222–1229 CrossRef CAS.
- K. Czamara, J. Natorska, P. Kapusta, M. Baranska and A. Kaczor, Analyst, 2015, 140, 2164–2170 RSC.
- K. Czamara, K. Majzner, A. Selmi, M. Baranska, Y. Ozaki and A. Kaczor, Sci. Rep., 2017, 7, 1–10 CrossRef PubMed.
- K. Czamara, F. Petko, M. Baranska and A. Kaczor, Analyst, 2016, 141, 1390–1397 RSC.
- A. D. van Dam, M. R. Boon, J. F. P. Berbée, P. C. N. Rensen and V. van Harmelen, Eur. J. Pharmacol., 2017, 816, 82–92 CrossRef CAS PubMed.
- M. Gil-Ortega, B. Somoza, Y. Huang, M. Gollasch and M. S. Fernández-Alfonso, Trends Endocrinol. Metab., 2015, 26, 367–375 CrossRef CAS PubMed.
- I. Shimizu, T. Aprahamian, R. Kikuchi, A. Shimizu, K. N. Papanicolaou, S. MacLauchlan, S. Maruyama and K. Walsh, J. Clin. Invest., 2014, 124, 2099–2112 CrossRef CAS PubMed.
- B. Gálvez-Prieto, J. Bolbrinker, P. Stucchi, A. I. de las Heras, B. Merino, S. Arribas, M. Ruiz-Gayo, M. Huber, M. Wehland, R. Kreutz and M. S. Fernandez-Alfonso, J. Endocrinol., 2008, 197, 55–64 Search PubMed.
- J. Desroches, M. Jermyn, M. Pinto, F. Picot, M. A. Tremblay, S. Obaid, E. Marple, K. Urmey, D. Trudel, G. Soulez, M. C. Guiot, B. C. Wilson, K. Petrecca and F. Leblond, Sci. Rep., 2018, 8, 1–10 CrossRef CAS PubMed.
- M. S. Bergholt, W. Zheng, K. Lin, K. Y. Ho, M. Teh, K. G. Yeoh, J. B. Y. So and Z. Huang, Technol. Cancer Res. Treat., 2011, 10, 103–112 CrossRef CAS PubMed.
- Z. Huang, A. McWilliams, H. Lui, D. I. McLean, S. Lam and H. Zeng, Int. J. Cancer, 2003, 107, 1047–1052 CrossRef CAS PubMed.
- C. Krafft, M. Kirsch, C. Beleites, G. Schackert and R. Salzer, Anal. Bioanal. Chem., 2007, 389, 1133–1142 CrossRef CAS PubMed.
- S. Duraipandian, W. Zheng, J. Ng, J. J. H. Low, A. Ilancheran and Z. Huang, Anal. Chem., 2012, 84, 5913–5919 CrossRef CAS PubMed.
- C. Matthäus, S. Dochow, G. Bergner, A. Lattermann, B. F. M. Romeike, E. T. Marple, C. Krafft, B. Dietzek, B. R. Brehm and J. Popp, Anal. Chem., 2012, 84, 7845–7851 CrossRef PubMed.
- U. Benedetto, D. G. Altman, S. Gerry, A. Gray, B. Lees, R. Pawlaczyk, M. Flather and D. P. Taggart, J. Thorac. Cardiovasc. Surg., 2016, 152, 270–276 CrossRef PubMed.
- J. M. A. de Jong, O. Larsson, B. Cannon and J. Nedergaard, Am. J. Physiol.: Endocrinol. Metab., 2015, 308, E1085–E1105 CrossRef PubMed.
- A. Mann, A. Thompson, N. Robbins and A. L. Blomkalns, J. Visualized Exp., 2014, 94, 1–7 Search PubMed.
- Y. Chen, R. Pan and A. Pfeifer, Pflugers Arch., 2016, 468, 1803–1807 CrossRef CAS PubMed.
- C. S. Britton and K. A. Fox, Clin. Lipidol., 2011, 6, 79–91 CrossRef PubMed.
- Z. F. Huang Cao, E. Stoffel and P. Cohen, Hypertension, 2017, 69, 770–777 CrossRef PubMed.
- K. Czamara, K. Majzner, M. Z. Pacia, K. Kochan, A. Kaczor and M. Baranska, J. Raman Spectrosc., 2015, 46, 4–20 CrossRef CAS.
- J. Dybas, K. M. Marzec, M. Z. Pacia, K. Kochan, K. Czamara, K. Chrabaszcz, E. Staniszewska-Slezak, K. Malek, M. Baranska and A. Kaczor, TrAC, Trends Anal. Chem., 2016, 85, 117–127 CrossRef CAS.
- N. A. Brazhe, A. B. Evlyukhin, E. A. Goodilin, A. A. Semenova, S. M. Novikov, S. I. Bozhevolnyi, B. N. Chichkov, A. S. Sarycheva, A. A. Baizhumanov, E. I. Nikelshparg, L. I. Deev, E. G. Maksimov, G. V. Maksimov and O. Sosnovtseva, Sci. Rep., 2015, 5, 1–13 Search PubMed.
- K. Majzner, K. Kochan, N. Kachamakova-Trojanowska, E. Maslak, S. Chlopicki and M. Baranska, Anal. Chem., 2014, 86, 6666–6674 CrossRef CAS PubMed.
- J. Padilla, N. T. Jenkins, V. J. Vieira-Potter and M. H. Laughlin, Am. J. Physiol. Regul. Integr. Comp. Physiol., 2013, 304, R543–R552 CrossRef CAS PubMed.
- L. C. Bailey-Downs, Z. Tucsek, P. Toth, D. Sosnowska, T. Gautam, W. E. Sonntag, A. Csiszar and Z. Ungvari, J. Gerontol., Ser. A, 2013, 68, 780–792 CrossRef CAS PubMed.
- L. R. Kong, Y. P. Zhou, D. R. Chen, C. C. Ruan and P. J. Gao, Front. Physiol., 2018, 9, 1–8 Search PubMed.
- S. Hildebrand, J. Stümer and A. Pfeifer, Front. Physiol., 2018, 9, 1–10 Search PubMed.
- J. I. Kawabe and N. Hasebe, BioMed Res. Int., 2014, 701571, 1–8 Search PubMed.
- S. B. Police, S. E. Thatcher, R. Charnigo, A. Daugherty and L. A. Cassis, Arterioscler., Thromb., Vasc. Biol., 2009, 29, 1458–1464 CrossRef CAS PubMed.
Footnote |
| † Electronic supplementary information (ESI) available. See DOI: 10.1039/c8an01307a |
| This journal is © The Royal Society of Chemistry 2018 |