 Open Access Article
In vivo detection of drug-induced apoptosis in tumors using Raman spectroscopy†
Oliver
Jonas‡
*a,
Jeon Woong
Kang‡
 *b,
Surya P.
Singh
b,
Alex
Lammers
a,
Freddy T.
Nguyen
c,
Ramachandra R.
Dasari
b,
Peter T. C.
So
b,
Robert
Langer
d and
Michael J.
Cima
de
aDepartment of Radiology, Brigham & Women's Hospital, Boston, MA 02115, USA. E-mail: ojonas@bwh.harvard.edu; Tel: +617-525-8596
bLaser Biomedical Research Center, G. R. Harrison Spectroscopy Laboratory, Massachusetts Institute of Technology, Cambridge, Massachusetts 02139, USA. E-mail: jwkang76@mit.edu; Tel: +617-258-9404
cDepartment of Chemical Engineering, Massachusetts Institute of Technology, Cambridge, MA 02139, USA
dKoch Institute for Integrative Cancer Research, Massachusetts Institute of Technology, Cambridge, Massachusetts 02139, USA
eDepartment of Materials Science, Massachusetts Institute of Technology, Cambridge, Massachusetts 02139, USA
First published on 30th July 2018
Abstract
We describe a label-free approach based on Raman spectroscopy, to study drug-induced apoptosis in vivo. Spectral-shifts at wavenumbers associated with DNA, proteins, lipids, and collagen have been identified on breast and melanoma tumor tissues. These findings may enable a new analytical method for rapid readout of drug-therapy with miniaturized probes.
Introduction
Most cancer chemotherapies are administered in cycles lasting several weeks to months. The response rates vary greatly and robust biomarkers to predict drug-specific responders in most cases are elusive. The traditional clinical efficacy measurements of a therapy regimen consist of non-invasive imaging of tumor shrinkage. Magnetic Resonance Imaging (MRI), for example, is often used. However, discernible differences in tumor mass by MRI often require weeks to months of treatment to appear, which leads to loss of valuable treatment time for non-responders in which other therapies could be tried. Thus, methods to reliably detect drug efficacy earlier in the treatment cycle would have a significant clinical impact.Raman spectroscopy (RS) exploits the inelastic scattering of photons to probe the structure and dynamics of molecules through their vibrational transitions. The shift in the initial and final vibrational states of the molecule is manifested in the form of characteristic spectral patterns, termed as Raman fingerprints. RS has been widely used in various facets of biological research ranging from disease diagnostics to diabetes monitoring.1–3 In contrast to conventional imaging techniques, it offers advantages of being rapid, non-invasive and label-free. In vivo identification of healthy and cancerous conditions has become feasible with the advent of fiberoptic probes.1,3–5 This method has recently been applied to analyze and image live cells to determine cellular states such as apoptosis, division or differentiation.6–9 Molecular level changes under exposure of antibiotics or chemotherapeutic agents at single cell level have been studied in detail using Raman spectroscopy.7,10–14 Clinical applicability to examine the treatment response in cancer, however, requires direct monitoring of the Raman signal within a tissue because tumors are heterogeneous which is composed of varied cell types including not only tumor cells but stromal, immune and other cell types.15,16 The varied effects of the tumor microenvironment have a significant effect on actual drug response.17–19
In this study, we have employed Raman spectroscopy to measure and identify an apoptotic response that is present only within the drug-treated tumor regions. The results of this proof-of-concept study are relevant for the development of methods to optimize and monitor chemotherapy. The ability to obtain serial measurements in a minimally invasive manner will allow determination of drug pharmacodynamics and assessment of intra-tumor response to therapy to enable more rapid and accurate clinical decision-making.
Experimental
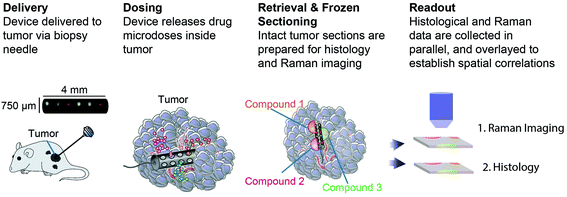
An implantable drug-delivery micro device, adapted from ref. 20, to deliver micro doses of the anti-cancer drug doxorubicin into melanoma or breast tumors in nude mice is used (Fig. 1).20 Freshly excised tumor sections were placed on top of quartz coverslip and imaged with a custom-built Raman microscope with excitation wavelength at 785 nm at 60 mW power.21,22 The ordinary least squares fitting method was used for biochemical analysis of the tissue using basis components, DNA, albumin, actin, collagen, triolein, and phosphatidylcholine.22,23 This study was performed in strict accordance with the NIH guidelines for the care and use of laboratory animals and was approved by the Institutional Animal Care and Use Committee of Brigham and Women's Hospital (Boston, MA).Results and discussion
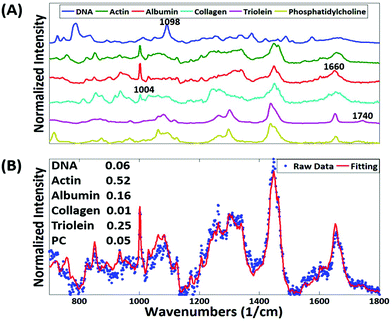
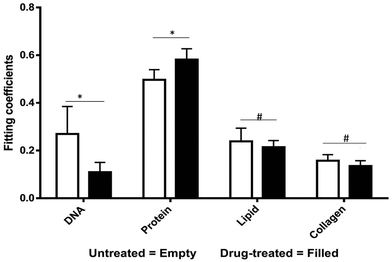
The most striking change in the Raman signal observed during apoptosis induced by doxorubicin occurs at wavenumbers that are characteristic of DNA, Fig. 2. Doxorubicin is a DNA-intercalating agent and induces apoptosis through either structural damage to DNA directly or by interfering with the replication machinery. Consistent differences at 785 cm−1 were observed in 300 measurements across 3 tumors (Fig. 4). These findings were further verified by immunohistochemistry (IHC). Tumor sections were stained using cleaved-caspase-3 antibodies. Near-perfect spatial overlap is observed between the tumor regions that display reduced DNA Raman signal and the IHC antibody staining for apoptosis (Fig. 2). The reduction in DNA is thus congruent with the known biochemical mode of action of the drug.We collected basis spectra for the major components present in the tissue to isolate the spectral changes due to apoptosis from other signals. DNA was selected to observe nuclear damage induced by the drug. Albumin and actin were selected to represent plasma and cytoskeleton proteins. Collagen was selected, as it is the main component of connective tissues. Triolein and phosphatidylcholine were selected as non-membrane and membrane lipids, respectively. The data were normalized and fitted to obtain their relative intensities across the fingerprint range (Fig. 3A). Using the basis spectra as a framework, we collected 100 spatially separate measurements from both exposed and unexposed regions and isolated a specific intensity measurement for each of the biological components of the tissue. Across all samples, the intensity of the signal associated with DNA (wavenumber 785 cm−1) integrity decreased by 59.4% during 24 h of doxorubicin treatment, Fig. 4. Unpaired student's t-test coupled with welch correction was performed to access the significance of difference. As shown in Fig. 4, significant differences were observed in DNA and protein concentration between treated and untreated groups. Reduction in lipid content can be reconciled with apoptosis. Previous single-cell studies have shown that there are changes in the shape and composition of the cell membrane, which is composed primarily of lipids, during apoptosis.18 Metabolic changes induced by the apoptosis machinery may also contribute to altered lipid synthesis.17 Increase in protein content could be attributed to the enhancement of the cellular stress response associated with toxins which have been reported to lead to higher protein expression.24–26
As mentioned Raman fiberoptic probes have been used clinically to examine tissue morphology, detect cancer; identify tumor margins, and other purposes.1,3,13,14 The ability to detect drug effect in real-time and in vivo, however, has thus far not been realized. Major apoptosis assays include analysis of terminal deoxynucleotidyl transferase dUTP nick end labeling (TUNEL), comet electrophoresis and flow cytometry. However, these methods require the addition of dyes or fluorescent labels which may have an effect on the cells and might interfere with drug effects. Additionally, these methods are time-consuming in sample preparation and more importantly difficult to apply in vivo. Raman spectroscopic methods can serve as an alternative to these because of its non-destructive and label-free nature. The positions, intensities, and line-widths of the various spectral bands can be used to probe structural and molecular changes in large biological molecules.
Conclusions
Results presented in this communication indicates that Raman spectroscopic methods can be employed for in vivo detection of apoptosis. This might open a new avenue of label-free measurement of drug effect inside the tumor during chemotherapy. Such information could be used to guide further therapy for patients. Alternatively, this technology could be integrated with existing implantable devices for drug delivery. For instance, drug-eluting wafers could be equipped with Raman capabilities to directly feedback data on the released drug's effectiveness.27,28 In the diagnostic realm, microdevices for drug sensitivity testing equipped with Raman sensing can provide efficacy information for multiple drugs in real-time to enable rapid selection of optimal personalized drug therapies.20,29Conflicts of interest
There are no conflicts to declare.Acknowledgements
Financial support from Brigham Research Institute Director's Transformative Award, NCI R01 CA224144-01, the Koch Institute Frontier Research Program through the Kathy and Curt Marble Cancer Research Fund, Koch Institute Frontier Research Fund, NIH 9P41EB015871-31 and Samsung Advanced Institute of Technology (Seoul, South Korea) is gratefully acknowledged.References
- L. A. Austin, S. Osseiran and C. L. Evans, Analyst, 2016, 141, 476–503 RSC.
- R. Pandey, S. K. Paidi, T. A. Valdez, C. Zhang, N. Spegazzini, R. R. Dasari and I. Barman, Acc. Chem. Res., 2017, 50, 264–272 CrossRef PubMed.
- I. Pence and A. Mahadevan-Jansen, Chem. Soc. Rev., 2016, 45, 1958–1979 RSC.
- E. B. Hanlon, R. Manoharan, T. W. Koo, K. E. Shafer, J. T. Motz, M. Fitzmaurice, J. R. Kramer, I. Itzkan, R. R. Dasari and M. S. Feld, Phys. Med. Biol., 2000, 45, R1–59 CrossRef PubMed.
- S. P. Singh, O. Ibrahim, H. J. Byrne, J. W. Mikkonen, A. P. Koistinen, A. M. Kullaa and F. M. Lyng, Head Neck, 2016, 38(Suppl 1), E2403–E2411 CrossRef PubMed.
- M. Okada, N. I. Smith, A. F. Palonpon, H. Endo, S. Kawata, M. Sodeoka and K. Fujita, Proc. Natl. Acad. Sci. U. S. A., 2012, 109, 28–32 CrossRef PubMed.
- A. F. Palonpon, M. Sodeoka and K. Fujita, Curr. Opin. Chem. Biol., 2013, 17, 708–715 CrossRef PubMed.
- A. Pliss, A. N. Kuzmin, A. V. Kachynski and P. N. Prasad, Biophys. J., 2010, 99, 3483–3491 CrossRef PubMed.
- M. Poplineau, A. Trussardi-Regnier, T. Happillon, J. Dufer, M. Manfait, P. Bernard, O. Piot and F. Antonicelli, Epigenomics, 2011, 3, 785–794 CrossRef PubMed.
- M. Li, J. Xu, M. Romero-Gonzalez, S. A. Banwart and W. E. Huang, Curr. Opin. Biotechnol., 2012, 23, 56–63 CrossRef PubMed.
- A. F. Palonpon, J. Ando, H. Yamakoshi, K. Dodo, M. Sodeoka, S. Kawata and K. Fujita, Nat. Protoc., 2013, 8, 677–692 CrossRef PubMed.
- I. W. Schie and T. Huser, Appl. Spectrosc., 2013, 67, 813–828 CrossRef PubMed.
- F. Tian, J. Conde, C. Bao, Y. Chen, J. Curtin and D. Cui, Biomaterials, 2016, 106, 87–97 CrossRef PubMed.
- L. Zhao, T. H. Kim, H. W. Kim, J. C. Ahn and S. Y. Kim, Acta Biomater., 2015, 20, 155–164 CrossRef PubMed.
- M. Egeblad, E. S. Nakasone and Z. Werb, Dev. Cell, 2010, 18, 884–901 CrossRef PubMed.
- D. Hanahan and R. A. Weinberg, Cell, 2011, 144, 646–674 CrossRef PubMed.
- E. S. Nakasone, H. A. Askautrud, T. Kees, J. H. Park, V. Plaks, A. J. Ewald, M. Fein, M. G. Rasch, Y. X. Tan, J. Qiu, J. Park, P. Sinha, M. J. Bissell, E. Frengen, Z. Werb and M. Egeblad, Cancer Cell, 2012, 21, 488–503 CrossRef PubMed.
- R. Straussman, T. Morikawa, K. Shee, M. Barzily-Rokni, Z. R. Qian, J. Du, A. Davis, M. M. Mongare, J. Gould, D. T. Frederick, Z. A. Cooper, P. B. Chapman, D. B. Solit, A. Ribas, R. S. Lo, K. T. Flaherty, S. Ogino, J. A. Wargo and T. R. Golub, Nature, 2012, 487, 500–504 CrossRef PubMed.
- T. R. Wilson, J. Fridlyand, Y. Yan, E. Penuel, L. Burton, E. Chan, J. Peng, E. Lin, Y. Wang, J. Sosman, A. Ribas, J. Li, J. Moffat, D. P. Sutherlin, H. Koeppen, M. Merchant, R. Neve and J. Settleman, Nature, 2012, 487, 505–509 CrossRef PubMed.
- O. Jonas, H. M. Landry, J. E. Fuller, J. T. Santini, J. Baselga, R. I. Tepper, M. J. Cima and R. Langer, Sci. Transl. Med., 2015, 7, 284ra57 CrossRef PubMed.
- J. W. Kang, S. P. Singh, F. T. Nguyen, N. Lue, Y. Sung, P. T. C. So and R. R. Dasari, Sensors, 2016, 16, E2133 CrossRef PubMed.
- J. W. Kang, P. T. So, R. R. Dasari and D. K. Lim, Nano Lett., 2015, 15, 1766–1772 CrossRef PubMed.
- A. S. Haka, K. E. Shafer-Peltier, M. Fitzmaurice, J. Crowe, R. R. Dasari and M. S. Feld, Proc. Natl. Acad. Sci. U. S. A., 2005, 102, 12371–12376 CrossRef PubMed.
- E. de Nadal, G. Ammerer and F. Posas, Nat. Rev. Genet., 2011, 12, 833–845 CrossRef PubMed.
- Y. Sun, J. Campisi, C. Higano, T. M. Beer, P. Porter, I. Coleman, L. True and P. S. Nelson, Nat. Med., 2012, 18, 1359–1368 CrossRef PubMed.
- P. Walter and D. Ron, Science, 2011, 334, 1081–1086 CrossRef PubMed.
- A. W. Scott, B. M. Tyler, B. C. Masi, U. M. Upadhyay, Y. R. Patta, R. Grossman, L. Basaldella, R. S. Langer, H. Brem and M. J. Cima, Biomaterials, 2011, 32, 2532–2539 CrossRef PubMed.
- M. Staples, K. Daniel, M. J. Cima and R. Langer, Pharm. Res., 2006, 23, 847–863 CrossRef PubMed.
- R. A. Klinghoffer, S. B. Bahrami, B. A. Hatton, J. P. Frazier, A. Moreno-Gonzalez, A. D. Strand, W. S. Kerwin, J. R. Casalini, D. J. Thirstrup, S. You, S. M. Morris, K. L. Watts, M. Veiseh, M. O. Grenley, I. Tretyak, J. Dey, M. Carleton, E. Beirne, K. D. Pedro, S. H. Ditzler, E. J. Girard, T. L. Deckwerth, J. A. Bertout, K. A. Meleo, E. H. Filvaroff, R. Chopra, O. W. Press and J. M. Olson, Sci. Transl. Med., 2015, 7, 284ra58 CrossRef PubMed.
Footnotes |
| † Electronic supplementary information (ESI) available. See DOI: 10.1039/c8an00913a |
| ‡ Contributed equally to the work. |
| This journal is © The Royal Society of Chemistry 2018 |


