
 Open Access Article
 This Open Access Article is licensed under a Creative Commons Attribution-Non Commercial 3.0 Unported Licence
Towards microbioprocess control: an inexpensive 3D printed microbioreactor with integrated online real-time glucose monitoring
Peter
Panjan
,
Vesa
Virtanen
and
Adama Marie
Sesay
 *
*
Measurement Technology Unit (MITY), University of Oulu, Kehräämöntie 7, 87400 Kajaani, Finland EU. E-mail: adama.sesay@oulu.fi
First published on 21st May 2018
Abstract
Bioprocessing is of crucial importance in pharmaceutical, biofuel, food and other industries. Miniaturization of bioprocesses into microbioreactors allows multiplexing of experiments as well as reduction of reagent consumption and labour-intensity. A crucial part of the research within microbioreactors is biochemical analysis of product, byproduct and substrate concentrations that currently heavily relies on large analytical equipment. Biosensors are a promising analytical tool, however, integration into a microbioreactor is associated with challenges in ensuring sterility, appropriate sensing range, control of matrix effects and stability. In this work we present a novel biosensor integrated analytical chip that features an internal, actuated buffer flow in contact with a biosensor downstream and a diffusion limiting membrane exposed to the sample upstream. The technology was developed and tested using an electrochemical glucose oxidase biosensor and was found to successfully surmount the aforementioned challenges including the extension of the linear range of sensitivity to more than 20 g L−1 for online, real time monitoring of glucose. The biosensor integration chip with the glucose biosensor was then mounted onto a 3D printed microbioreactor with 1 mL of internal volume. The system successfully monitored the consumption of glucose of Saccharomyces cerevisiae in real time for more than 8 h. The developed technology and measurement methodologies are transferrable to other biosensors and microbioreactors as well as large scale applications.
Introduction
In the field of biotechnology, fermentation is used as a biological process for obtaining valuable products from microorganisms and its importance is ever increasing within the pharmaceutical, enzyme production, biofuel, food and many other bioprocessing industries.1 Bioprocess design consists of three steps: the biocatalyst, medium and process design,2 requiring extensive, laborious fermentation experiments and methodology optimization. All developmental steps are commonly approached in scaled-down laboratory processes in order to reduce the amount of required reagents, time and resources.3Microfluidics exemplifies the manipulation of small volumes of fluids4 that offers several advantages over standard lab-scale experiments i.e. in reducing the volumes and the amount of samples and reagents consumed, short analysis times, high resolution and sensitivity of microfluidically supported sensors into small footprint, parallelizable devices that handle small volumes of liquid. Microfluidic technology allows for functions such as mixing, pumping, focusing, sorting, droplet formation and transfer within the microscale.5 Microfluidic technology is commonly used for bioprocess applications6 with a number of publications reporting on microfluidic-based fermentation studies, ranging from cell cultivation7 and sorting,8 aerospace cultivation research9 and bioethanol production10,11 to the biosynthesis of high value products.12 Small scale fermenters (bioreactors) can come in several shapes and sizes including flasks, microtitre plates and specialized microfluidic vessels.13 However, only recent developments of transferrable, universal “microbioreactors” have been reported.14,15
The techniques used for the fabrication of microbioreactors are largely the same as the fabrication techniques for producing microfluidic chips and typically consist of soft lithography (e.g. of silicones like polydimethylsiloxane, PDMS), hot embossing and laser ablation.16 Additive manufacturing (aka 3D printing) can be divided into three major techniques: fused deposition modelling (FDM), stereolithography (SLA) and microjet modelling (MJM).16 The utilization of 3D printing for microfluidic chip fabrication is becoming common, e.g. for the fabrication of masks for soft lithography,17 for the “fugitive ink” microfluidic fabrication approach (channels are 3D printed using a dissolvable material, followed by submerging the 3D structure into a PDMS resin and washing)18 or for the direct fabrication of the microfluidic device.19 Despite the transferability of fabrication technologies of microfluidic chips to microbioreactors, examples of using 3D printing for fabricating and producing microbioreactor platforms are scarce.
The main advantage for the utilization of microbioreactors is in the research of biosynthetic processes, for example, screening for high producing strains, the development of optimal media and process optimization, all making process data acquisition and analysis of crucial importance. Bolic et al. reported on the fabrication of a microbioreactor with integrated non-invasive optical sensors for pH, dissolved oxygen and optical density monitoring,15 thus providing data for process analysis and enabling process control. However, monitoring of nutrients and product concentrations (e.g. biochemical analysis) is left to be performed on standard, large and expensive analytical devices (e.g. HPLC) that are incapable of real time monitoring and consume large sample volumes that restrict the use for microbioprocessing. Oliveira et al. reported on yeast growth medium optimization in a microfluidic device with a known glucose concentration gradient so as to circumvent standard analytical equipment.1 Despite the innovativeness of the approach, it lacked in accuracy, as the specific distribution of glucose concentrations was determined optically using a food dye by assuming that its diffusivity was the same as glucose.
Biosensors are analytical devices that utilize a biological component for the selective and sensitive detection of an analyte.20,21 Presently they are being successfully applied to biochemical/environmental analysis,22–25 food,26,27 biosecurity,28 pharmaceutical,29 personalized diagnostics30–33 and medical applications.34–36 As they easily lend themselves to miniaturization, catalytic biosensors (e.g. glucose and lactate oxidase biosensors) are a promising tool for online monitoring in microbioreactors, enabling real-time, online monitoring of nutrients, metabolites and products, thus replacing standard analytical techniques with rapid, rich and parallelizable analytics. A major advantage of having biosensors integrated into microbioreactors would be to enable process control; e.g., an integrated glucose biosensor could provide real time data crucial for fed-batch and continuous cultivations.
Typically, cultivation parameter conditions for bioprocessing applications are rarely ideal and can match the optimal operational conditions (e.g. pH, temperature, degradation) for biosensors and bio-sensing techniques. Biosensor integration into microbioreactor platforms for cell cultivation can hence be associated with four major challenges:
First, sterility within a microbioreactor is of crucial importance in order to eliminate unwanted biochemical processes that would alter the bioprocess outcome and research data. Sterilization protocols are designed to deactivate all biological compounds and the biological recognition components of the biosensor are no exception. Therefore, a way to ensure a sterile environment within the microbioreactor platform without deactivation of the integrated biosensor would need to be found.
Second, microbioreactors are typically used for research and the carrying out of intensified bioprocesses that come with elevated concentrations of substrates, products as well as byproducts. Biosensors on the other hand are excellent at detecting very low analyte/substrate concentrations (5–7 mM in the case of blood glucose biosensors). Several attempts to extend the linear ranges of biosensors (up to 100 mM glucose for bioprocess applications) have been studied; however, diluting the samples remains the analytical standard and practice for integration.37 The aim of this work was to develop a sample conserving, non-invasive method that would simultaneously improve the integrated biosensor's linear range and provide an ideal operational environment.
Third, the bioprocess liquids within microbioreactors are optimized for the housed bioprocesses and those complex matrices would unpredictably alter the biosensors’ signals upon direct exposure.
Fourth, the stability of a biosensor cannot be compared to that of other physical or chemical sensors due to deterioration of the signal with use, temperature and time.38 For the integration of an enzyme based biosensor into a microbioreactor to be successful, all of these four challenges have to be surmounted.
A 1 mL microbioreactor for investigation of biosensor integration, from here on referred to as a “Millireactor”, was stereolithographically 3D printed. This fabrication technique enabled a novel 3 dimensional design with additional complex features. The Millireactor featured inlet, outlet and aeration ports as well as a large opening at the bottom for interfacing with a microfluidic glucose oxidase biosensor chip. Two magnetic ball-stirrers were inserted into the Millireactor's chamber to enable magnetically actuated mixing powered by a miniature electromotor with a customised magnetic wheel, mounted into a fused-filament 3D printed housing that also served as a stand for the main Millireactor body.
An electrochemical glucose oxidase biosensor was used as a model enzyme biosensor for integration. A biosensor integration chip was developed in order to surmount the four challenges for biosensor integration as mentioned above. The integration chip featured a low molecular weight cut-off membrane which was on one side in contact with the fermentation broth and on the other with an internal buffer flow with the biosensor mounted downstream (Fig. 1). The utilization of the cut-off membrane addressed many of the challenges involved in integrating the biosensor into the microbioreactors by: (1) separating the non-sterile internal buffer flow from the sterile bioprocess liquid; (2) shifting the concentration of analytes by limiting the diffusion from the bioprocess liquid into the internal buffer; (3) ensuring the operation of the biosensor in optimal conditions within the internal buffer and (4) improving the stability by controlling the temperature and contents of the internal buffer flow.
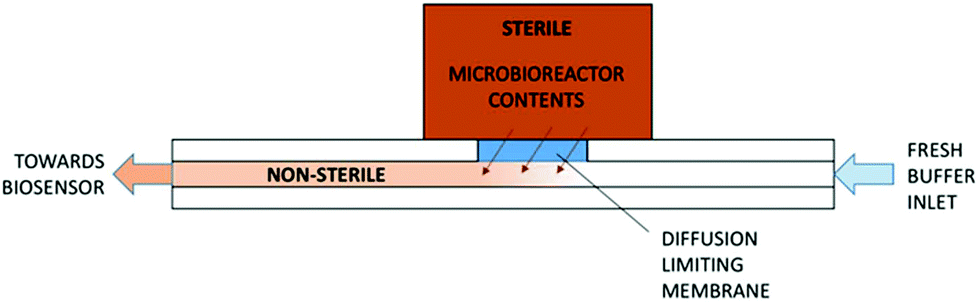 | ||
| Fig. 1 Concept of the biosensor integration chip. A diffusion limiting membrane separates the sample and internal buffer flow, preventing contamination of the sterile sample environment from the non-sterile microfluidic channel and buffer flow whilst simultaneously limiting the diffusion of glucose and other analytes into the buffer. Analytes are detected and measured downstream by an integrated biosensor. | ||
Several modes of the operation were developed and tested for the integrated biosensor chip. By changing flow patterns and stopping the carrier buffer flow underneath the membrane and over the sensor, different sensitivities were achieved; thus the monitoring method was able to be adapted to the relevant analyte concentrations.
In addition to the electrochemical glucose oxidase biosensor, an optical density sensor was integrated in the form of a simple click-on 3D printed device, taking advantage of the translucent walls of the Millireactor. A cultivation of Saccharomyces cerevisiae was tested under oxygen limited conditions in the Millireactor to evaluate the complete system proof of concept.
Experimental
Fabrication of Millireactor
The Millireactor was designed following the basic rules governing large-scale bioreactors; 1 mL of fermentation broth was to displace 2/3 of the total volume of the fermentation chamber (inner diameter was 10 mm and height 18 mm), including 4 wall mounted current breakers, aeration and feeding/outlet ports and a gas outlet. The main body of the Millireactor was stereolithographically 3D printed using an XYZprinting Nobel SLA 3D printer and XYZprinting transparent resin (position-sensitive UV activated polymerization and solidification of clear monomer resin), followed by cleaning with ethanol and isopropanol to remove any residue polymer that might affect biocompatibility. The translucent walls enabled click on, contact free integration of the optical density sensor. The glucose oxidase biosensor and the supporting microfluidic chip was attached using 100 μm thick pressure-sensitive double-sided tape (medical grade pressure-sensitive double-sided tape, Adhesives Research) (Fig. 2).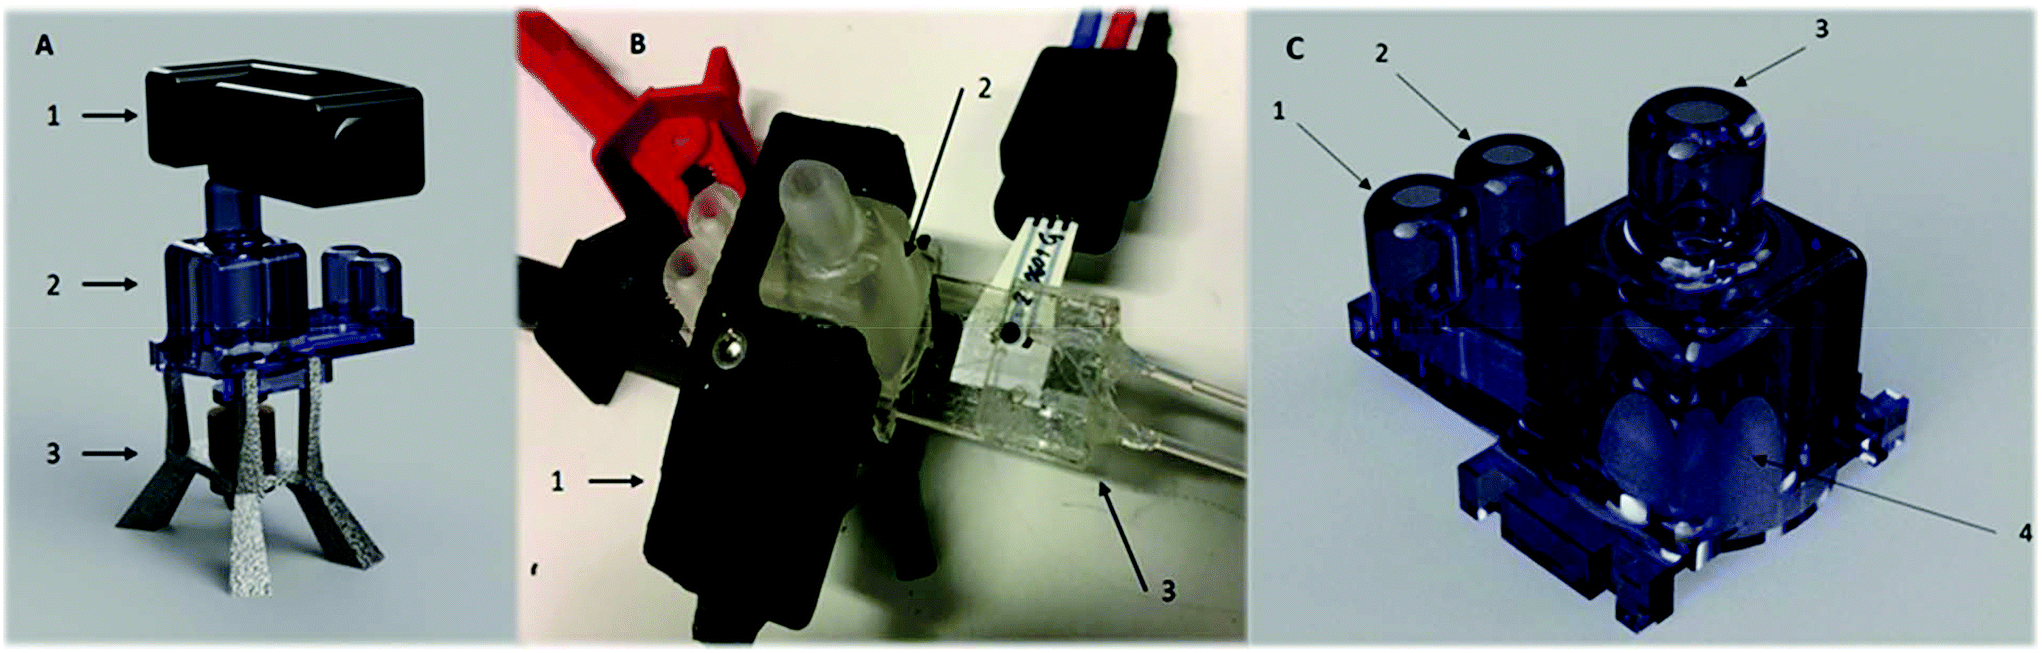 | ||
| Fig. 2 (A) A 3D rendered concept of the Millireactor: (1) optical density sensor; (2) main body of the Millireactor; (3) stand. (B) Photo of the working prototype: (1) FFF 3D printed click on OD sensor; (2) SLA 3D printed micro-bioreactor platform; (3) biosensor microfluidic insertion chip with an integrated glucose biosensor. (C) Rendered design of the Millireactor's main body: (1) inlet; (2) outlet; (3) gas outlet; (4) main bioprocess chamber with a designated area for biosensor integration chip. | ||
Mixing
Mixing was magnetically actuated in order to prevent contamination through bearings and seals; enable complete set-up sterilization; and aid to simplify the assembly. The Millireactor stand fabricated using 3D fused-filament printing held a 12 V electric motor with a reduction gearbox with a mounted magnetic wheel for mixing actuation (200 rpm). Two Teflon covered magnetic balls (2 mm in diameter) were inserted into the Millireactor for magnetically actuated mixing. The mixing was set at 200 rpm which was found to provide sufficient mixing as no sedimentation of yeast could be detected via the optical density sensor.Optical density sensor
The clip on optical density (OD) sensor (ODsens) was fused-filament 3D printed and consisted of a monochromatic laser (λ = 650 nm) and photodiode connected to a Genuino® microcontroller providing the OD data to the computer via serial communication. Optical density, or absorbance at 650 nm (A), was calculated via the following equation:where Tmeasured is the measured light transmittance and Tmax is the maximum (calibrated) transmittance in a microorganism-free medium in the Millireactor. The optical density sensor has been validated by comparing the absorption measurements of green food dye (E143) dilutions (V = 150 μL and 50 μL) in a flat-bottom microtiter plate to values given by a spectrophotometer (Thermo Fisher Varioskan®).

The ODsens was mounted on to the outside of the Millireactor, to monitor non-invasively as its walls were translucent. The light travelled horizontally through to the cylindrical reaction chamber and bioprocess cultivation liquid (light path of 10 mm); the centre of the light beam was 7 mm from the bottom.
Electrochemical glucose oxidase biosensor
Using screen printed carbon electrodes (ItalSens, Italy), the working electrode was modified with Prussian Blue as a glucose oxidase mediator (adapted from Ricci et al.39), followed by the addition of glutaraldehyde, bovine serum albumin, glucose oxidase and Nafion® 117. A PalmSens3 potentiostat was used for the amperometric detection (U = 0.07 V) of glucose. The electrochemical enzyme biosensor was fully characterized (linear range, response times, selectivity, sensitivity, flow conditions disturbances and stability) before utilization.30Biosensor integration chip
The core part of the biosensor integration chip was the diffusion limiting membrane that was exposed to the bioprocess fluid within the Millireactor on the outer side and internal buffer flow of the biosensor integration chip on the inner side. Downstream from the diffusion limiting membrane, also in contact with the internal buffer flow, was integrated the biosensor (Fig. 3). The biosensor integration chip for the glucose oxidase biosensor was fabricated using a CO2 laser to cut into a polymethyl methacrylate (PMMA) 2 mm thick plate and was bonded using a double sided adhesive (100 μm thick; Adhesive Research, Ireland) to a thermally sandwiched dialysis membrane (40 kDa cutoff) between two 100 μm PMMA sheets. The microfluidic channels were cut into the double sided adhesive (1 × 0.1 mm cross-section). After the integration of the biosensor integration chip onto the microbioreactor, the assembly was thermally sterilized (overnight at 90 °C), followed by the integration of the glucose oxidase biosensor onto the supporting chip using the same double-sided adhesive that shaped a 4 μL integration chamber on the hard PMMA base. | ||
| Fig. 3 Scheme of the biosensor integration chip. Left: Assembled chip with integrated biosensor; right: exploded view of the components forming the biosensor integration chip. | ||
Glucose measurements
Three different measurement protocols were investigated in order to optimize the sensitivity, stability and analyte consumption of the analysis. The chip and protocols were characterized ex situ in standard glucose solutions (20, 40, 60, 80 and 100 mM) in phosphate buffered saline (PBS). The same buffer was pumped using a syringe pump serving as the internal carrier flowing underneath the dialysis membrane.(1) Continuous flow (steady state). The syringe pump was pumping 100 μL min−1 of PBS into the supporting chip, where the dialysis membrane was limiting the diffusion and the apparent glucose concentration (detected by the glucose oxidase biosensor) was correlated to the measured concentration on the other side of the membrane.
(2) Start–stop flow (peak detection). While the buffer flow was stopped, the glucose concentrations underneath the dialysis membrane reached high values in small volumes, which were detected as glucose peaks when the pumping (100 μL s−1) was turned back on (after 1, 2 and 5 min of stopped flow diffusion time).
(3) Stopped flow (passive diffusion inside the supporting chip). These conditions occurred between the peaks within the start–stop flow. As the chip was filled with a small amount of PBS, the glucose passively diffused over the glucose oxidase biosensor. The rate of diffusion over the sensor has been correlated to the measured concentration.
Assembly and fermentation
Initially, the supporting chip without the biosensor was integrated into the Millireactor containing a magnetic mixing element using a double-sided adhesive. The assembly was then filled with YPD medium (1 g yeast extract, 2 g dextrose, 2 g peptone and 2 g glucose were diluted in 100 mL deionized water and the pH was set at 4.5 using hydrochloric acid), sealed and thermally sterilized at 90 °C overnight. After the assembly was cooled down, the Millireactor was inoculated using dried yeast culture and a small amount of sterilized YPD medium, making the initial concentration of 20 mg of dry mass per 1 mL of medium. Subsequently, the glucose oxidase biosensor was integrated onto the supporting chip using a double-sided adhesive tape in a non-sterile manner as the dialysis membrane prevents contamination. The OD sensor was mounted around the walls of the Millireactor that was placed onto the stand with the mixing motor. The experiment was conducted in an oven at 30 °C and the glucose measurements were executed by a start–stop (peak detection) protocol at 15 min intervals.Results and discussion
OD sensor validation
Different dilutions of the dye in water (dye proportions) were used for the validation, as the purpose was not to calibrate the sensor (calibration is achieved by the linearity of the photodiode's response) but to compare it to a reference laboratory optical detection machine. The readouts are plotted in Fig. 4; the results show a strong correlation between the ODsens and Varioskan® that was used as a reference (P-values for 50 and 150 μL volumes tested are below 10−10 and 10−9, respectively). The small differences in the readouts can be attributed to the specific, highly reproducible responses of the respective optical systems when exposed to the food coloring. The wall of the Millireactor was found to be highly translucent and its absorbance (less than 1% of the total signal) was taken into account with the readouts, hence allowing click-on, contact-free integration.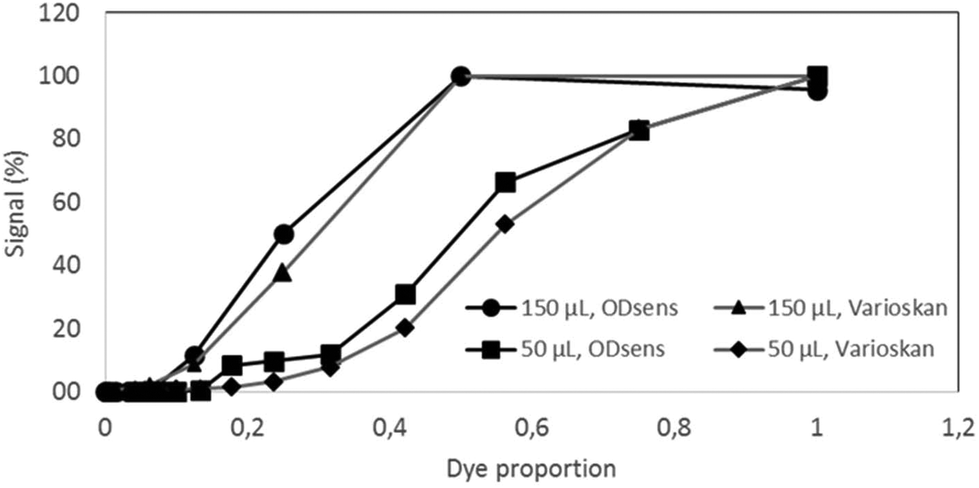 | ||
| Fig. 4 Validation of the OD sensor – comparison with a Varioskan(R) instrument in 150 and 50 μL of sample dilutions of the green food dye (E143), N = 3. | ||
Characterization of glucose measurement protocols
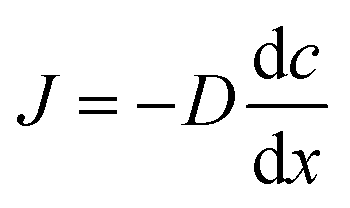
The three protocols of glucose measurements were evaluated based on their sensitivity, linear range and analyte flushing rate. Given that all protocols were based on certain consumption of analytes through the dialysis membrane, an optimal protocol would not only feature good linearity – correlation between the output signal and the concentration of the measured analyte – and sensitivity, but would also flush as small amounts of analyte as possible, yet providing significant online data density (representative sampling rate). Flushing rates have been calculated at a steady state internal analyte concentration of 100 mM, at a sampling rate of 4 times per hour in a 24 h measurement.(1) The readouts of the continuous flow (steady state) protocol are presented in Fig. 5a. A linearity of up to 60 mM of glucose was established; however, the characteristic plateaus at higher concentrations. As this protocol is steady state, Fick's first law applies:

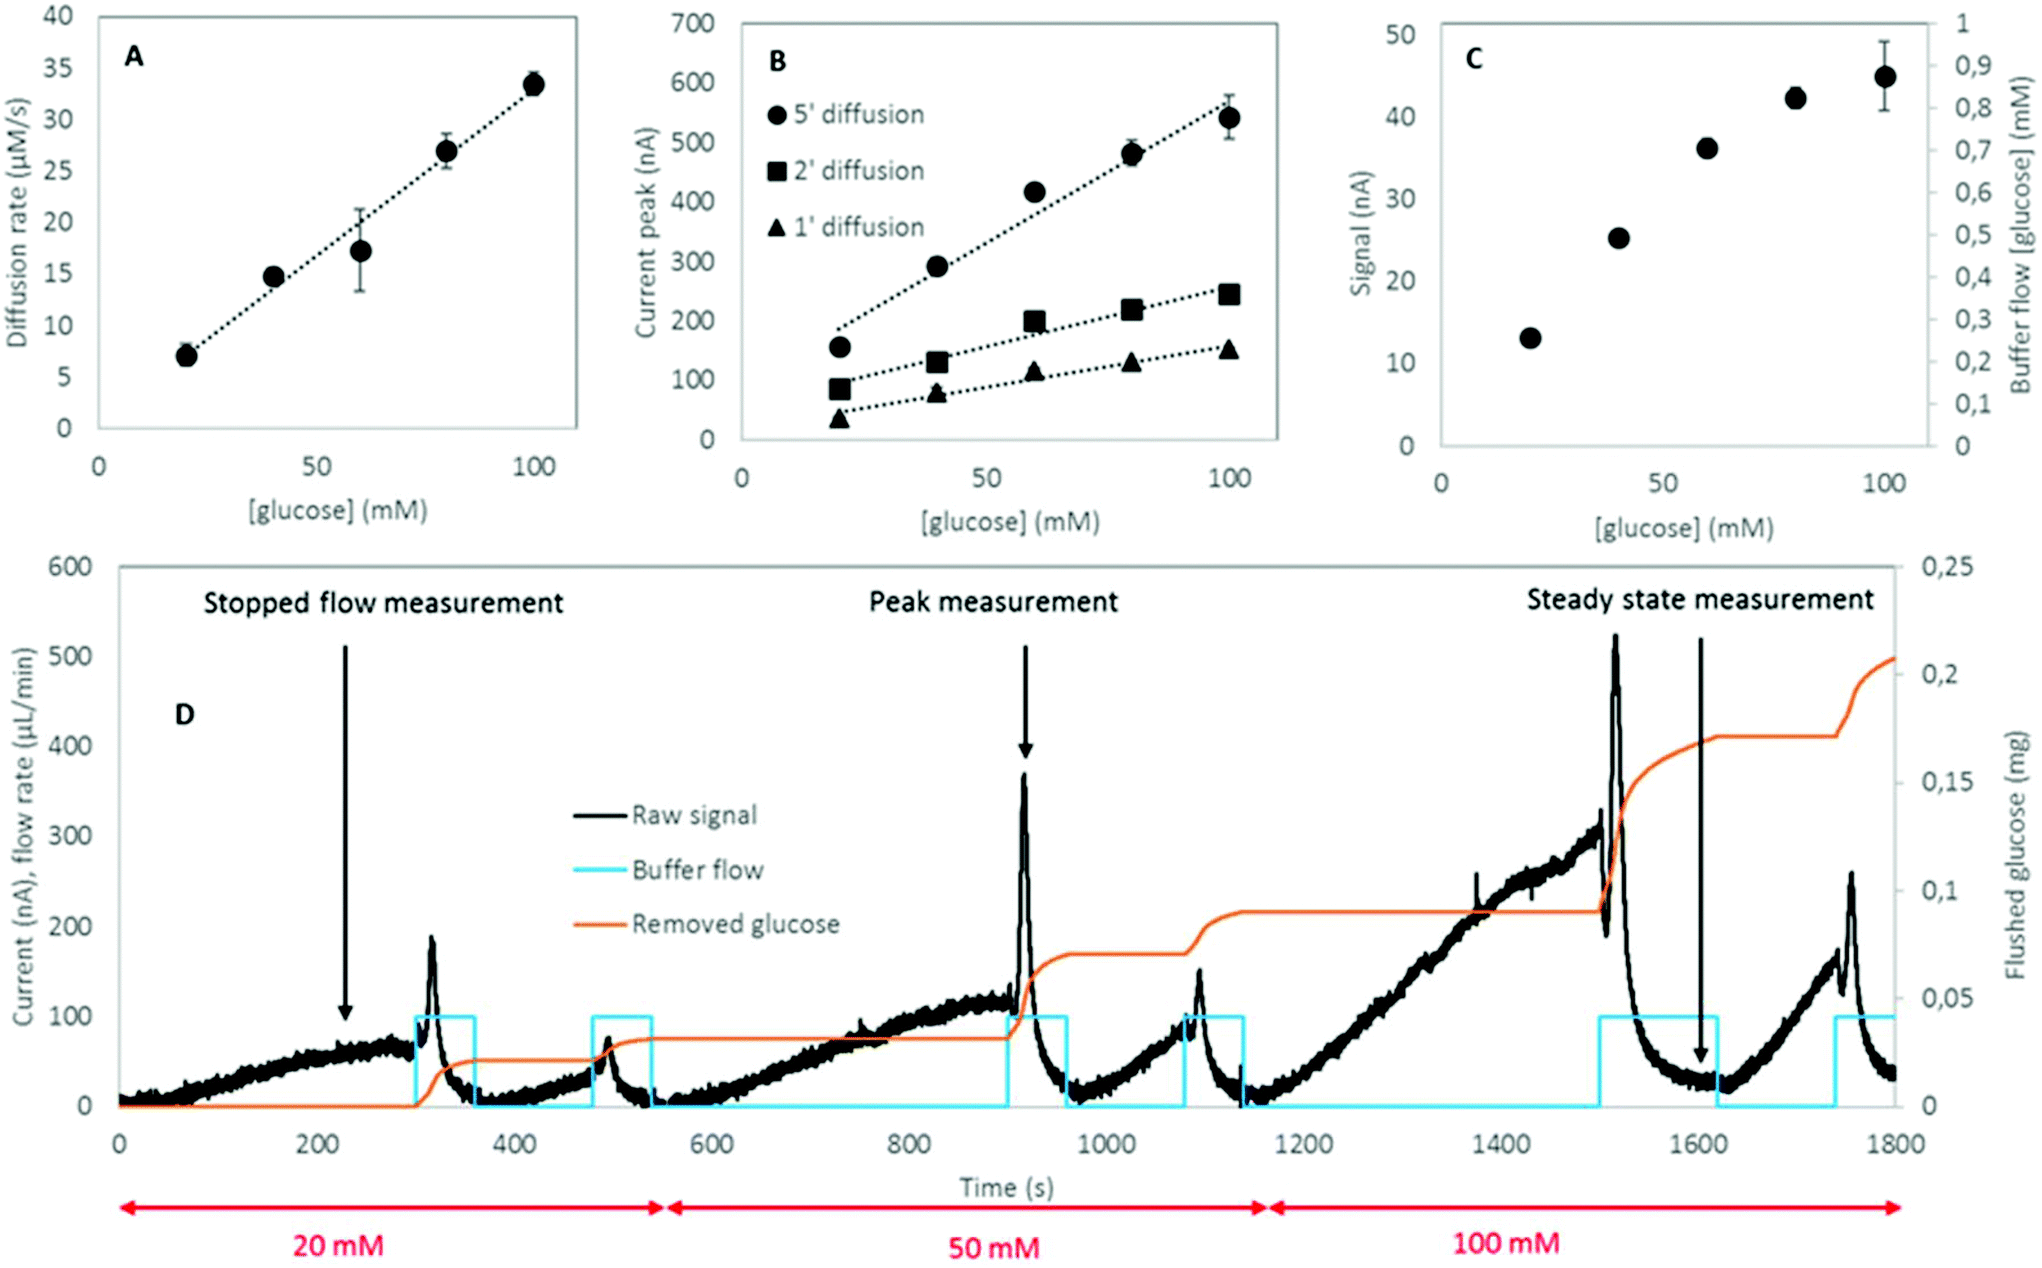 | ||
| Fig. 5 Modes of measurement utilizing the biosensor integration chip. (A) Calibration curve in the stopped flow/dynamic measurement; (B) calibration curves for peak/stopped-flow measurements featuring 1, 2 and 5 minutes diffusion times; (C) calibration curve of the steady state measurement; (D) sensorgram indicating buffer flow, removed glucose amounts and measurement opportunities. | ||
As the buffer volumetric flow rate is preset, membrane surface area is defined by geometry, membrane thickness is known, inner glucose concentration is controlled during calibration due to the usage of standard solutions and glucose concentration in the buffer is measured, and the only variable left unknown is the diffusivity. Using the experimental data (5 different concentrations, each N = 3), the diffusion coefficient of glucose through the dialysis membrane was established to be 2 × 10⁻¹⁵ m2 s−1.
(2) Calibration curves of the start–stop protocol were calculated for all diffusion times tested – 1, 2 and 5 min (Fig. 5b). The peak height (maximum current of 1 s floating averaged signal) was plotted against standard measured concentrations, yielding a coefficient of determination (R2) greater than 0.95 in all diffusion times. Given that this dynamic measurement follows Fick's second law:
(3) Whenever the buffer flow in the supporting chip was stopped in the presence of high glucose concentration, the glucose sensor was detecting a local gradual increase in glucose concentration over time (Fig. 5c). The characteristic was linear and the gradient of glucose concentration in time was dependent on the glucose concentration on the other side of the membrane. Gradients were plotted against standard concentrations and the characteristic was found to be linear (R2 = 0.98). Hence, this protocol can be utilized for glucose measurements, but has to be coupled to the start–stop one for flushing the fresh buffer into the system once the old one has reached high glucose concentrations.
In a 24 h measurement of infinite volume of 100 mM glucose solution in 15 min intervals, the amounts of glucose flushed would be 0.13, 0.04 and 0.06 mmol for the continuous, start–stop and stopped flow/passive protocols, respectively. The amount of glucose in a 1 mL Millireactor was 0.2 mmol; in the case of Millireactor measurements, the given figures of flushed glucose are greatly overestimated as the Millireactor's volume is limited and the concentration would continuously decrease as a result of microbial consumption. The real time flushing of glucose is depicted in Fig. 5d that also shows the raw signal of the glucose measurements.
The know-how of these protocols is transferrable to other analytes and applications. The choice of the appropriate protocol depends on the pace and duration of the process, volume of analyzed fluid and representative measurement frequency. The measurements can be fine-tuned by changing the membrane permeability, membrane surface area and the buffer flow rate; however, some findings are general. Continuous measurements offer the highest density of data in exchange for higher amount of analytes flushed. The passive protocol cannot be used individually and is greatly affected by any leakages or fluid movement – misplacement of sensor in relation of distance over fluid to the membrane shifts the readouts and the smallest leakage causes a change in gradient. The start–stop protocol is a good trade-off between the low amount of flushed analytes and data density whilst providing the most robust data (the start–stop protocol is not affected by the small movements of buffer) at any desired data acquisition frequency.
An important aspect of flushing reduction is the non-selective nature of the process – any molecule that is below the cut-off size of the utilized membrane can pass unobstructed and undetected unless an appropriate sensor is mounted. Moreover, biosensors are prone to ageing and the deterioration effects are reduced when disconnected, establishing start–stop as a first selection protocol.
If the diffusion time and measurement time intervals are different, the start–stop protocol requires a time sensitive flushing step in order to maintain the exact diffusion time. Such a procedure offers the possibility of additional peak measurement with a different diffusion time as well as two stopped flow/passive measurements when the buffer is held still, enriching the acquired data density.
Fermentation
Saccharomyces cerevisiae was cultivated in YPD medium in a fully assembled Millireactor. The OD was measured in 5 s intervals and calibrated in clean, microorganism-free YPD medium. The Millireactor was stirred using a magnetic stirring bar, with the powertrain set at 12 V and approximately 200 rpm. 8 h cultivation was executed at 30 °C.The results (Fig. 6) show a very quick start of glucose consumption, the concentration of which fell from the initial 20 g L−1 to 3 g L−1 in less than 3 h. The amount of glucose removed by the flushing buffer through the glucose integration chip throughout the experiment was calculated to be 0.7 mg whilst the initial total amount of glucose within the Millireactor was 20 mg. Hence, the signal error as a result of flushing was estimated at 3.5%, ensuring that the glucose consumption was caused by the cultivated microorganisms. As the metabolism of yeast switched to consume other nutrients present in the YPD medium (peptone and dextrose), the glucose concentration stabilized at around 1 g L−1. The OD measurements show sufficient mixing throughout the experiment: the OD was found to significantly drop if the mixing was insufficient due to sedimentation. The high amount of yeast added into the reactor prevented accurate OD readouts and the detection of an expected exponential phase. The purpose of these preliminary results is to show the functionality of the glucose measurements using the developed technology in real samples.
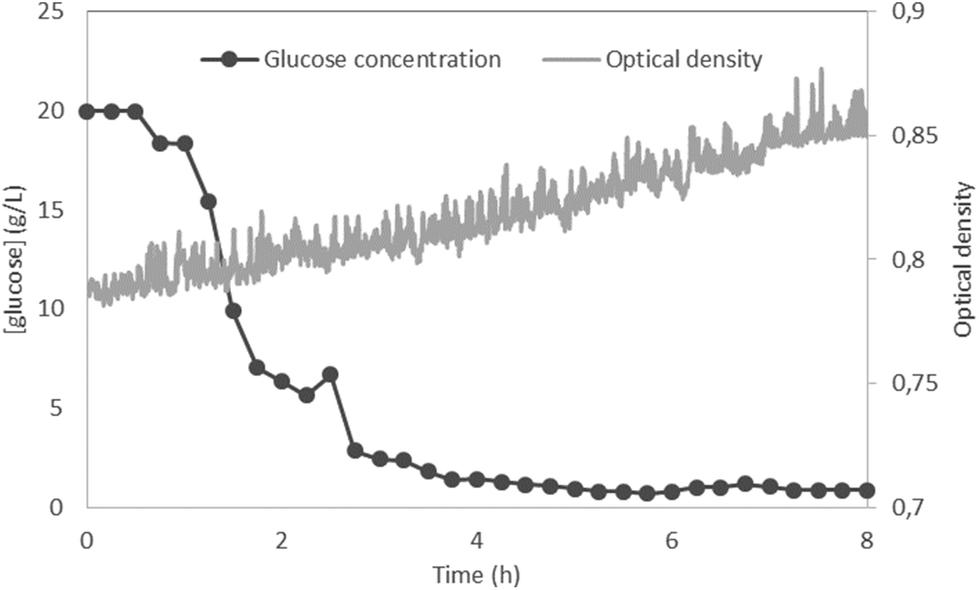 | ||
| Fig. 6 Proof of concept fermentation of Saccharomyces cerevisiae in YPD at 30 °C, anaerobic, magnetically stirred – glucose concentration and optical density readouts. | ||
Implementation
The function of the biosensor integration chip is to facilitate integration by surmounting the mentioned integration challenges: sterility, sensitivity, matrix effects and stability. Within the scope of this work it was characterized for the integration of the electrochemical glucose oxidase biosensor, however, the same protocols can be transferred to any other catalytic biosensor (e.g. lactate, pyruvate, etc.). Furthermore, the same technology can be also be integrated into large scale bioreactors without scaling up as long as the biosensor integration chip is exposed to a representative sample or location, the readouts remain accurate and the measurement procedures unchanged.The Millireactor was designed as a low cost 3D printed microbioreactor mainly for bioprocess research. The system allows itself to parallelization due to having a small footprint and low fabrication cost (numbering up – each unit would require an individual biosensor integration chip for analysis).
Conclusions
The presented 3D printed microbioreactor and biosensor integration microfluidic chip with an embedded diffusion limiting membrane successfully surmounts the four major challenges for bioprocess control applications.The sterilization of the microbioreactor platform can be achieved without the deactivation of the biosensor by initially attaching the biosensor integration chip onto the microbioreactor without the biosensor. A sterilization procedure (e.g. autoclaving) can be performed before attaching the biosensor on to the chip. The diffusion limiting membrane is able to prevent any contamination of the sterile microbioreactor chamber from entering and at the same time protects the biosensor from cells and the complex matrix of the cultivation broth. Possible matrix effects that could compromise the biosensor's performance are severely reduced as the biosensor is not in direct contact with the bioprocess fluid and an optimal buffer can be used to extract the analyte for detection by the biosensor instead. The stability of the biosensor is also increased with the choice of buffer for the biosensor integration chip. The combination of the diffusion limiting membrane and carrier buffer was able to extend the linear range of the integrated catalytic biosensor (from 3 mM to 100 mM in the case of the glucose biosensor). The biosensor integration chip and detection technologies can therefore be adapted for any bioprocess application using one or a combination of the reported analytical methods.
The 3D printed microbioreactor (Millireactor) successfully housed the fermentation of Saccharomyces cerevisiae in YPD medium, whilst the glucose biosensor integrated via the biosensor integration chip enabled real time glucose monitoring. 33 measurement points for glucose concentration were taken during the cultivation and the data were available immediately, in real time and fully automated, without compromising the microbioreactor's bioprocess fluid. In comparison, if an HPLC (prior art) would have been used for the measurements of glucose, only a few data points would be feasible without severely compromising the total volume within the microbioreactor. In addition to the labour intensive nature of the prior art, the data would only be available earliest in several hours. Hence we can conclude that the presented innovative technology allows real time analysis of substrates as well as products and consequently enables bioprocess control that was previously impossible within a microbioreactor.
Conflicts of interest
There are no conflicts to declare.Acknowledgements
This work is a part of the EuroMBR project, funded by the People Programme (Marie Curie Actions, Multi-ITN) of the European Union's Seventh Framework Programme for research, technological development and demonstration project: The European network for innovative micro-bioreactor applications in bioprocess development (EUROMBR, Grant No. 608104).References
- A. F. Oliveira, V. B. Pelegati, H. F. Carvalho, C. L. Cesar, R. G. Bastos and L. G. de la Torre, Biochem. Eng. J., 2016, 105, 288–295 CrossRef.
- S. Kumar, C. Wittmann and E. Heinzle, Biotechnol. Lett., 2004, 26, 1–10 CrossRef PubMed.
- M. L. Shuler and F. Kargı, Bioprocess engineering, Prentice Hall, 2002 Search PubMed.
- G. M. Whitesides, Nature, 2006, 442, 368–373 CrossRef PubMed.
- A. Manz, D. J. Harrison, E. M. J. Verpoorte, J. C. Fettinger, A. Paulus, H. Lüdi and H. M. Widmer, J. Chromatogr. A, 1992, 593, 253–258 CrossRef.
- M. P. Marques and N. Szita, Curr. Opin. Chem. Eng., 2017, 18, 61–68 CrossRef PubMed.
- D. Schäpper, S. M. Stocks, N. Szita, A. E. Lantz and K. V. Gernaey, Chem. Eng. J., 2010, 160, 891–898 CrossRef.
- U.-B. T. Giang, M. R. King and L. A. DeLouise, J. Bionic Eng., 2008, 5, 308–316 CrossRef.
- N. Kim, C. M. Dempsey, J. V. Zoval, J. Y. Sze and M. J. Madou, Sens. Actuators, B, 2007, 122, 511–518 CrossRef.
- W. Hilber and B. Jakoby, Sens. Actuators, A, 2016, 240, 145–152 CrossRef.
- W. Hilber and B. Jakoby, Procedia Eng., 2015, 120, 100–105 CrossRef.
- Q. L. Guan, Y. H. Xing, J. Liu, W. J. Wei, R. Zhang, X. Wang and F. Y. Bai, J. Inorg. Biochem., 2013, 128, 57–67 CrossRef PubMed.
- A. Buchenauer, M. C. Hofmann, M. Funke, J. Büchs, W. Mokwa and U. Schnakenberg, Biosens. Bioelectron., 2009, 24, 1411–1416 CrossRef PubMed.
- D. Schäpper, S. M. Stocks, N. Szita, A. E. Lantz and K. V. Gernaey, Chem. Eng. J., 2010, 160, 891–898 CrossRef.
- A. Bolic, H. Larsson, S. Hugelier, A. Eliasson Lantz, U. Krühne and K. V. Gernaey, Chem. Eng. J., 2013, 303, 655–666 CrossRef.
- R. D. Sochol, E. Sweet, C. C. Glick, S.-Y. Wu, C. Yang, M. Restaino and L. Lin, Microelectron. Eng., 2018, 189, 52–68 CrossRef.
- J. C. McDonald, M. L. Chabinyc, S. J. Metallo, J. R. Anderson, A. D. Stroock and G. M. Whitesides, Anal. Chem., 2002, 74, 1537–1545 CrossRef PubMed.
- J. A. Lewis, Adv. Funct. Mater., 2006, 16, 2193–2204 CrossRef.
- S. M. Hampson, W. Rowe, S. D. R. Christie and M. Platt, Sens. Actuators, B, 2018, 256, 1030–1037 CrossRef.
- A. P. F. Turner, I. Karube and G. S. Wilson, Biosensors: fundamentals and applications, Oxford University Press, 1987 Search PubMed.
- F.-G. Banica, Chemical sensors and biosensors: fundamentals and applications, John Wiley & Sons Inc, 2012 Search PubMed.
- W. Zhang, A. M. Asiri, D. Liu, D. Du and Y. Lin, TrAC, Trends Anal. Chem., 2014, 54, 1–10 CrossRef.
- X. Wang, X. Lu and J. Chen, Trends Environ. Anal. Chem., 2014, 2, 25–32 CrossRef.
- M. A. Kashem, M. Suzuki, K. Kimoto and Y. Iribe, Sens. Actuators, B, 2015, 221, 1594–1600 CrossRef.
- S. Bidmanova, M. Kotlanova, T. Rataj, J. Damborsky, M. Trtilek and Z. Prokop, Biosens. Bioelectron., 2016, 84, 97–105 CrossRef PubMed.
- Y. Zeng, Z. Zhu, D. Du and Y. Lin, J. Electroanal. Chem., 2016, 781, 147–154 CrossRef.
- L. Rotariu, F. Lagarde, N. Jaffrezic-Renault and C. Bala, TrAC, Trends Anal. Chem., 2016, 79, 80–87 CrossRef.
- Z. Muhammad-Tahir and E. C. Alocilja, Biosens. Bioelectron., 2003, 18, 813–819 CrossRef PubMed.
- N. Sanvicens, I. Mannelli, J.-P. Salvador, E. Valera and M.-P. Marco, TrAC, Trends Anal. Chem., 2011, 30, 541–553 CrossRef.
- P. Chen, N.-T. Huang, M.-T. Chung, T. T. Cornell and K. Kurabayashi, Adv. Drug Delivery Rev., 2015, 95, 90–103 CrossRef PubMed.
- E. Goretti, D. R. Wagner and Y. Devaux, Trends Mol. Med., 2014, 20, 716–725 CrossRef PubMed.
- N. J. W. Rattray, Z. Hamrang, D. K. Trivedi, R. Goodacre and S. J. Fowler, Trends Biotechnol., 2014, 32, 538–548 CrossRef PubMed.
- S. H. Ang, M. Rambeli, T. M. Thevarajah, Y. B. Alias and S. M. Khor, Biosens. Bioelectron., 2016, 78, 187–193 CrossRef PubMed.
- P. Mehrotra, J. Oral Biol. Craniofac. Res., 2016, 6, 153–159 CrossRef PubMed.
- E. B. Burcu and M. K. Sezgintürk, Anal. Biochem., 2015, 478, 107–120 CrossRef PubMed.
- R. Kojima, D. Aubel and M. Fussenegger, Curr. Opin. Chem. Biol., 2015, 28, 29–38 CrossRef PubMed.
- A. C. Fernandes, D. Semenova, P. Panjan, A. M. Sesay, K. V. Gernaey and U. Krühne, New Biotechnol., 2018 DOI:10.1016/J.NBT.2018.03.001.
- P. Panjan, V. Virtanen and A. M. Sesay, Talanta, 2017, 170, 331–336 CrossRef PubMed.
- F. Ricci, A. Amine, G. Palleschi and D. Moscone, Biosens. Bioelectron., 2003, 18, 165–174 CrossRef PubMed.
| This journal is © The Royal Society of Chemistry 2018 |