
Surface enhanced Raman scattering sensor for highly sensitive and selective detection of ochratoxin A
Raymond
Gillibert
 ab,
Mohamed N.
Triba
a and
Marc
Lamy de la Chapelle
*acd
ab,
Mohamed N.
Triba
a and
Marc
Lamy de la Chapelle
*acd
aUniversité Paris 13, Sorbonne Paris Cité, Laboratoire CSPBAT, CNRS, (UMR 7244), 74 rue Marcel Cachin, F-93017 Bobigny, France
bHORIBA Jobin Yvon S.A.S., 231 rue de Lille, 59650 Villeneuve d'Ascq, France
cInstitut des Molécules et Matériaux du Mans (IMMM - UMR CNRS 6283), Le Mans Université, Avenue Olivier Messiaen, 72085 Le Mans cedex 9, France. E-mail: marc.lamydelachapelle@univ-lemans.fr
dDepartment of Clinical Laboratory Medicine, Southwest Hospital, Third Military Medical University, Chongqing 400038, China
First published on 22nd November 2017
Abstract
The trace detection of toxic compounds in complex matrices is a major concern, in particular when it comes to mycotoxins in food. We developed a highly sensitive and specific SERS sensor for the detection of ochratoxin A using a simple rough gold film as a substrate. When adding the analyte, we observed spectral variations related to the interaction of the analyte with the specific aptamer used as a bioreceptor. Using a partial least squares regression method, our sensor is able to detect concentrations down to the picomolar range, which is much lower than the minimum legal concentration allowed in food products. Moreover, we demonstrate the accurate detection of the analyte in a wide concentration range from the picomolar up to the micromolar level. The detection was validated with negative detection tests using deoxynivalenol and bovine serum albumin.
1. Introduction
Ochratoxin A (OTA) is a mycotoxin produced by Penicillium verruosum, Aspergillius ochraceus and Aspergillius carbonarius. OTA comprises a dihydrocoumarin moiety linked to a molecule of L-β-phenylalanine via an amine bond (Fig. 1). It is commonly found in food, especially in cereals and cereal products, coffee, beer, grape juice, wine and pork.1,2 These fungi can also grow in wet rooms3 or in heating pipes.4 OTA is known to be highly nephrotoxic5–7 and it was demonstrated that it is genotoxic and could thus be carcinogenic.8 In addition the toxin can accumulate in human serum albumin and afterwards be slowly released in the body for months after exposure. Its lethal toxicity was studied in rats and the oral LD50 was found to be 28 mg per kg of body weight.9 Furthermore, OTA is a stable compound that is not destroyed by common food preparation procedures; hence heating processes above 250 °C for several minutes are required to reduce the toxin concentration.10 Thus, raw and processed food commodities can be contaminated with OTA11,12 and humans can be exposed to some extent. Similar problems occur with other mycotoxins such as vomitoxin,13 or alkaloids from Claviceps purpurea.14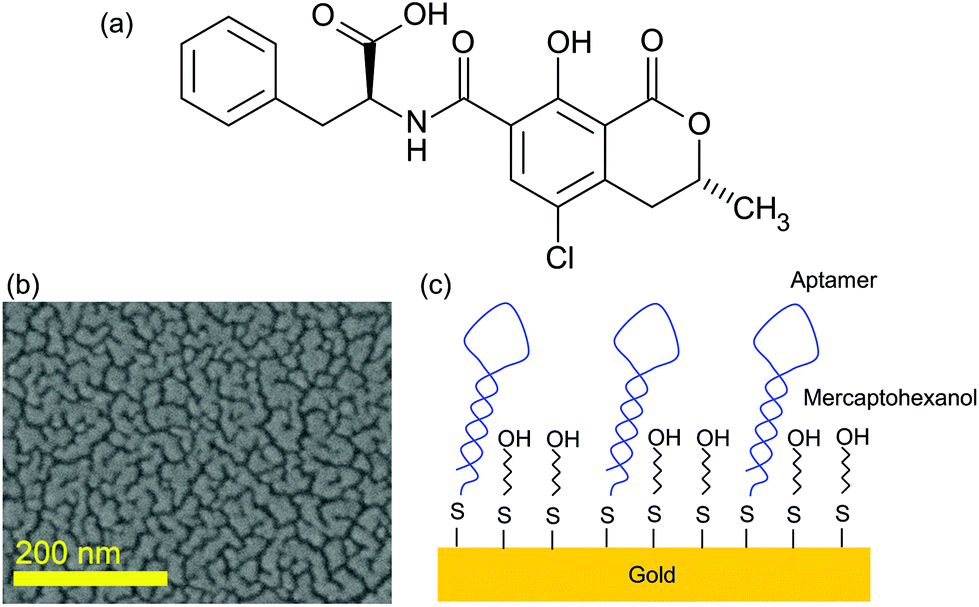 | ||
| Fig. 1 (a) Ochratoxine A molecule; (b) SEM image of the SERS substrate; and (c) scheme of the surface functionalization. | ||
OTA detection is therefore necessary for public health safety. OTA exposition was evaluated by the European Food Safety Authority (EFSA) in 2006 and a Tolerable Weekly Intake (TWI) of 120 ng per kg body weight was derived. The resulting regulation (123/2005) states that the OTA concentration should not exceed 5 ppb in cereals, 2 ppb in wine and juices, and 0.5 ppb in infant food. These levels are very low and it means that the presence of OTA in food should be monitored. An ELISA test exists today,15 reaching a limit of detection of 0.5 ppb and giving a linear response up to 10 ppb. This test is thus adapted to quality control in food. However it implies the use of costly monoclonal antibodies and requires a long time for detection. Other techniques like chromatography exist,16,17 but they require expensive and heavy equipment.
Alternatively, Surface Enhanced Raman Scattering (SERS) is a very sensitive method18 that has paved the way to individual molecule sensitivity.19–21 This technique also provides spectral information that allows label-free identification of the molecules.22 Thus it has proved its ability to detect traces of various kinds of analytes23 ranging from metallic ions24,25 or pollutants26,27 to more complex compounds such as proteins28,29 or even microorganisms30 such as bacteria.
SERS detection in complex media is a difficult matter and often requires specific functionalisation to ensure that only the desired molecule interacts with the gold surface avoiding parasite Raman rays that may hide the specific spectral features of the analyte. In general for biomolecules the natural choice is a specific antibody.31 However the interest in recent years on aptamers, a new family of probes, increased greatly.32 Aptamers, made of oligonucleotides, can have a very high affinity towards their target and are much cheaper than antibodies. Currently a few applications of this new family of probes are being used and we focused on this kind of probe because of these reasons. In addition aptamers are very small and thus allow getting the target closer to the gold surface, improving its detection.
B. Galarreta et al.33 reported the development of an aptamer based SERS sensor for OTA. However they reached a LoD of 50 nM (20 ppb) which is not sufficient for quality control in food. In addition the authors did not use any blocking agent to prevent the non-specific adsorption of the analytes on the gold surface. Later E.-O. Ganbold et al.34 were able to detect subnanomolar concentrations of OTA (sufficient for food quality control application) using a labeled aptamer and a colloidal SERS substrate.
In this paper, we propose a new fast and highly sensitive method of detection based on SERS and the use of a simple and cheap nanostructured substrate. We demonstrate that the statistical analysis allows us to reach picomolar concentrations with high accuracy and provide structural information on the OTA/aptamer interaction.
2. Experimental section
2.1. Sample preparation
Ochratoxin A was purchased from Sigma Aldrich and a millimolar solution was made in absolute ethanol (99.8%, HPLC grade from Sigma Aldrich). The solution was subsequently diluted in a 1 M KCl buffer prepared with Milli-Q water forming a 100 μM OTA solution. This latter solution was diluted in cascade in the same buffer down to 10 pM. For the negative control, 100 μM concentrated solutions of bovine serum albumin (BSA 98%, Sigma) and deoxynivalenol (DON, Sigma) were prepared using the same buffer.The aptamer was bought from Eurogentec. It is made of a 36 base DNA oligonucleotide. The single strand DNA sequence is (HS-C6)5′ GAT-CGG-GTG-TGG-GTG-GCG-TAA-AGG-GAG-CAT-CGG-ACA 3′. This is a sequence used by J. A. Cruz-Aguado35 and B. Galarreta et al.33 An alkane chain of six carbons terminated by a thiol is attached to the phosphate located on the 5′ end of ssDNA. This thiol grafts to the gold surface. In addition a millimolar concentration of 6-mercaptohexanol (MOH) bought from Sigma Aldrich was prepared in absolute ethanol to block the surface and avoid any non-specific interaction.
SERS substrates were fabricated by thermal evaporation of 6 nm of gold on a standard microscopic glass slide. This slide was previously cleaned by dipping for 15 min in acetone followed by dipping for 15 min in 96% ethanol under sonication. As the adhesion of gold on the glass surface is not strong, the gold deposition results in the formation of gold nanoislands at the glass surface (Fig. 1). Such an effect occurs for the layer below the percolation level estimated to be around 10 nm for gold on glass. The choice of this SERS substrate was guided by its ease of fabrication and its low cost making it an appropriate platform for sensor development.
The gold surface functionalisation was done first with a 10 μM concentrated aptamer solution for 48 h. Such a concentration was chosen to ensure a high density of the aptamer grafted on the gold surface. The sample was subsequently rinsed with a buffer and then with Milli-Q water. The MOH solution was then deposited on the aptamer-functionalised substrate for 1 h to block all the gold surface between the aptamers as illustrated in Fig. 1.
2.2. SERS measurements
SERS measurements were all performed using an XploRa Raman micro-spectrometer from Horiba Scientifics equipped with an 80× microscope objective with a numerical aperture (NA) of 0.75. 660 nm excitation (laser diode) was used to excite the sample. The laser power was adjusted with neutral density filter at 280 μW. A grating of 1200 lines per mm was used to obtain a spectral resolution below 6 cm−1 in the 200–1800 cm−1 range. The measurement was done in a backscattering configuration with three acquisitions of 20 s. After rinsing each sample of its buffer solution with distilled water and drying under a nitrogen flow, ten spectra were recorded at different points randomly distributed on the substrate surface to obtain sufficient statistical data. For the calibration curve, all SERS measurements were performed the same day without changing the acquisition parameters to ensure data consistency among all different concentrations. The negative controls were performed on other days.2.3. Statistical analysis
All SERS spectra were baseline corrected using the automatic function in LabSpec 6, software (Horiba Scientifics) subtracting an 8th degree polynomial. The same algorithm with exactly the same parameters was applied to each single spectrum and no normalisation was performed.The principal component analysis (PCA) and orthogonal projection on latent structure (OPLS) analyses were performed using an in-house MATLAB (2016b) code (Mathworks, Natick, MA, USA) based on the Trygg and Wold method.36 The PCA was first used in order to detect any confounding factors (spectroscopy acquisition day), any outlier samples or any variability associated with the OTA concentration. The OPLS method was applied in order to predict the OTA concentration. The quality of the model is assessed by the correlation coefficient (RY2) and the predictive coefficient (QY2). RY2 = 1 indicates a perfect description of the data by the model, whereas QY2 = 1 indicates perfect predictability. The QY2 was computed using the (7-fold) “leave-one-out” cross-validation method. The 7-fold cross-validation technique consists of randomly dividing the set of data into 7 subsets of the same size and estimating how each subset can be correctly predicted using a PLS model calculated using the remaining 6 subsets. The quality of the subset prediction is summarized by the parameter QY2. QY2 equal to one indicates a perfect prediction of each subset. Our OPLS model was applied to predict OTA concentrations in DON and BSA samples. Score and loadings plots are used to illustrate the results.
PCA is an unsupervised multivariate statistical method that can help to identify the main sources of variability in a dataset X comprising a large number of quantitative variables.37 Each source of variability is summarized by a new variable called the principal component that is a linear combination of the dataset variables. PLS is a supervised multivariate statistical method38 aiming to predict a dataset Y (here the concentration) using a dataset X (here Raman spectra).39 As for the PCA, the PLS components have to correctly summarize the variability in the studied datasets. OPLS is an evolution of the classical PLS where the first component is built by transferring recursively the variability not correlated with Y to orthogonal components.36 PCA, PLS and OPLS results are summarized in score plots in which each individual is represented in the space generated by the first components and a loading plot that represents the weight of each variable in the component.
3. Results and discussion
The SERS spectrum of the surface functionalisation layer (aptamer + MOH) is shown in Fig. 2. For comparison the SERS spectra of aptamer alone and MOH alone are also shown. Each SERS spectrum corresponds to an average of ten measurements. We could observe the SERS band for each compound. The band assignments are given in Tables 1 and 2 for MOH and aptamer respectively.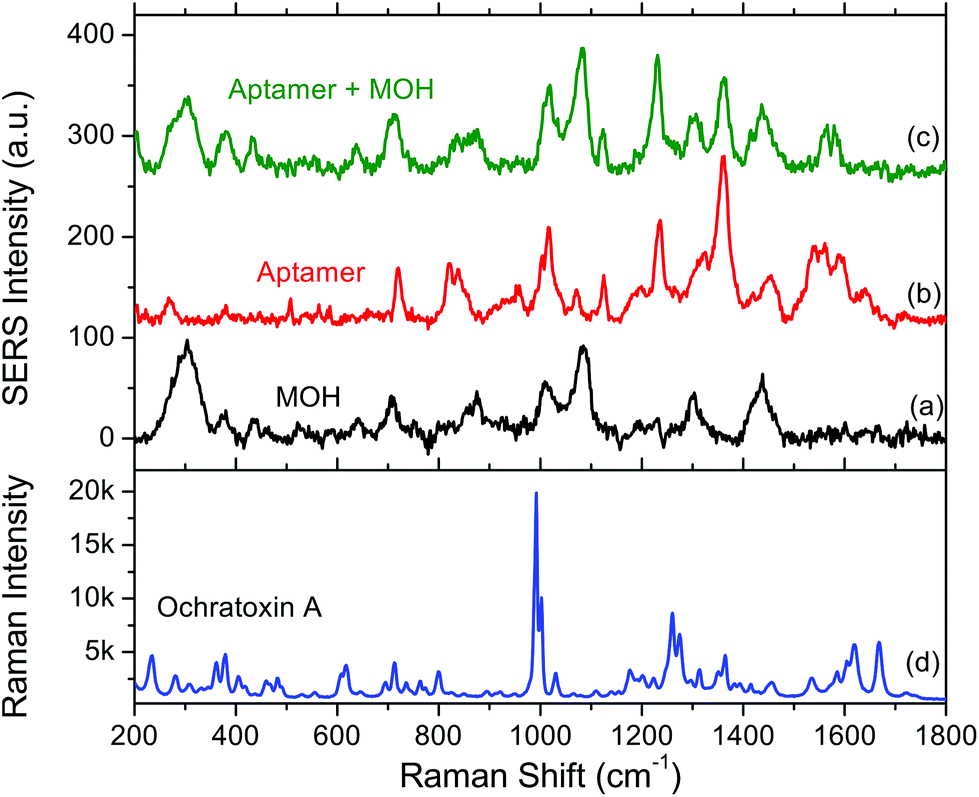 | ||
| Fig. 2 SERS spectra of (a) 6-mercaptohexanol (MOH) alone, (b) the aptamer alone and (c) the aptamer with the MOH blocking layer. (d) Raman spectrum of ochratoxin A powder. | ||
| ν (cm−1) | Vibration |
|---|---|
| 1436 | C–H bending |
| 1300 | CH2 twisting |
| 1083 | C–O stretching |
| 1011 | C–C–C stretching |
| 870 | C–C–C stretching |
| 710 | O–H out of plane bending |
| 304 | Au–S stretching |
| ν (cm−1) | Base | Vibration |
|---|---|---|
| 1663 | T/G/C | C![[double bond, length as m-dash]](https://www.rsc.org/images/entities/char_e001.gif) O stretching O stretching |
| 1590 | G | N–C–C |
| 1544 | G | N–C |
| 1443 | G | N–C |
| 1362 | T | C-Methyl |
| 1307 | A/G | N–C |
| 1236 | T | Cycle stretching |
| 1125 | A | N–C |
| 1071 | Phosphate | ν (PO2−) |
| 1015 | Phosphate | P–O–C antisym. stretching |
| 833 | T | C–C and C–N stretching |
| 718 | A | Ring stretching |
For MOH, the main bands correspond to the C–H, C–O or C–C vibrational modes of the alkane chain.
The aptamer is made of a single strand of DNA and thus exhibits strong characteristic SERS signatures of the oligonucleotides. The assignment of the bands was based on the work of C. Otto et al.40 who made the analysis of the Raman and SERS spectra of DNA bases. In particular we can see bands located in the 1500–1600 cm−1 spectral range corresponding to the vibrations of ketones and to some guanine deformations. After the addition of an MOH blocking layer, these bands disappear almost completely but the rest of the spectrum corresponds nearly to the arithmetic sum of the spectral signatures from MOH and the aptamer. The band close to 300 cm−1 (304 and 280 for MOH and aptamer respectively) could be assigned to the gold–sulphur bond ensuring the grafting of the molecule to the gold substrate. We could then conclude that both species are properly grafted on the substrate and that there is probably some conformational or orientation change for the aptamer when the surface is blocked.
Finally a Raman spectrum was acquired for OTA powder (Fig. 2d). This reference spectrum exhibits a strong and sharp band located at 992 cm−1 assigned to the deformation of the monosubstituted aromatic ring, a doublet located at 1265 cm−1 assigned to the secondary amine and the 1668 cm−1 band assigned to the vibrations of cetone.
3.1. Ochratoxin detection
A series of 10 spectra was first acquired on the substrate functionalised by the aptamer and the MOH in the absence of OTA. Then a 10 pM concentrated OTA solution was deposited on the substrate and incubated for 45 minutes. After rinsing the substrate a series of 10 spectra was again acquired. The same procedure was subsequently applied with a ten times higher concentration until reaching the concentration of 100 μM. In Fig. 3 the baseline corrected average spectra for each OTA concentration, going from zero (bottom black spectrum) to 100 μM (top dark blue spectrum) are presented.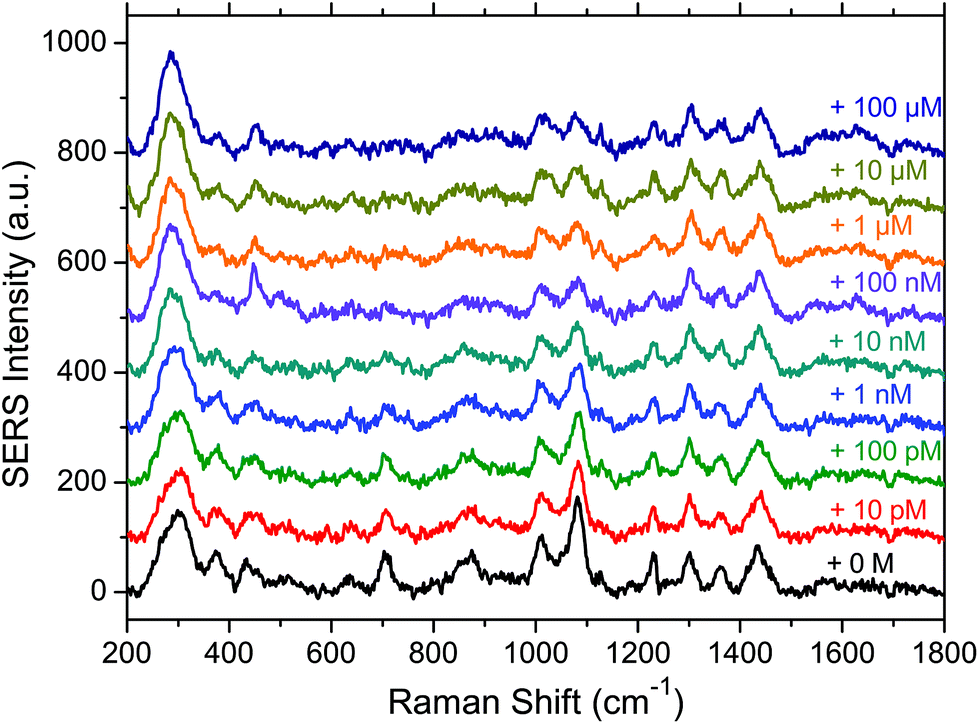 | ||
| Fig. 3 Average SERS spectra for each OTA concentration. Bottom black curve is the null concentration, and then the concentration increases for stacked spectra up to 100 μM for the top dark blue spectrum. | ||
We can see that the spectral variations are small when increasing the OTA concentration. However, we can observe that some band intensities decrease when the OTA concentration increases (1083, 833 and 710 cm−1) due to the interaction of OTA with the aptamer. In addition it also seems that a broad band appears in the 1600 cm−1 region for high OTA concentrations. This may be due to the vibrational modes of OTA itself, or due to the conformational changes of the aptamer. In this latter case, the vibrations that were not visible without the blocking layer could be observed again. In addition the interaction between the MOH blocking layer alone and the OTA was tested and no spectral variations (data not shown) were observed in the MOH SERS bands on adding OTA, indicating that we only observe a specific interaction in the presence of the aptamer.
In summary we can say that the presence of OTA has an influence on the SERS signal and makes its detection possible. However the most significant spectral features of OTA such as the 992 cm−1 band are not visible, except maybe for the 1600 cm−1 region. This non-observation of the OTA features may be due to its interaction with the aptamer which could induce drastic changes in the spectral signature of the OTA.
3.2. PCA analysis
To extract the maximum information from our spectra, we first used the principal component analysis to treat all our data. The score plot showing the values of the first two components (T1 and T2) for each spectrum is presented in Fig. 4. Each dot corresponds to one spectrum and is colored depending on the concentration of OTA. This score plot indicates that there is a clear correlation between the second component T2 represented in the x axis and the concentration (colored dots) when below 100 nM.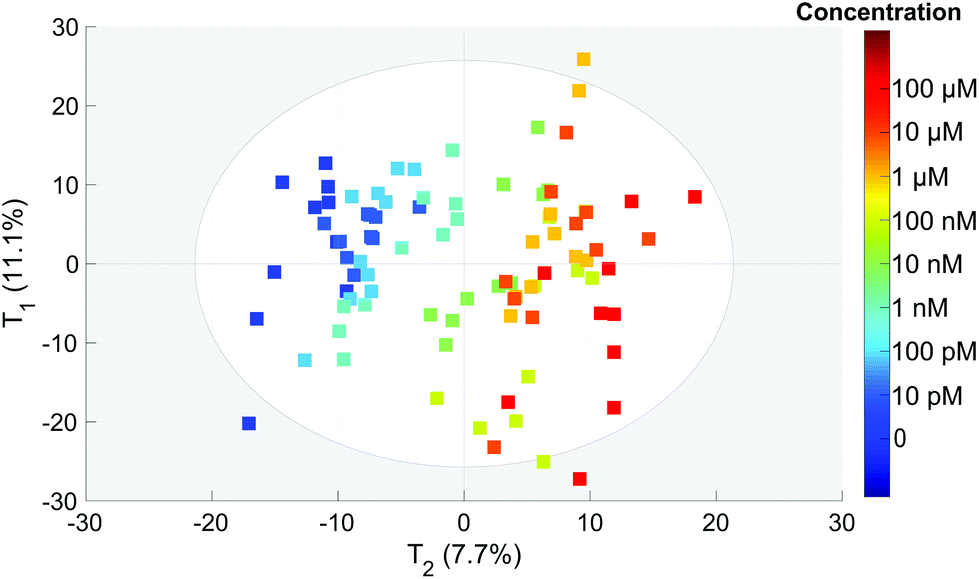 | ||
| Fig. 4 PCA score of each spectrum for the T1 and T2 components. The colors correspond to the actual OTA concentrations from 0 to 100 μM (color scale on the right). | ||
This is an indication that the concentration has an influence on the spectral features even if it is not clearly visible on the spectra (Fig. 3).
To understand the spectral sources of variability, we plotted the rescaled loadings of both principal components. They give access to the spectral ranges which vary for all the spectra.
The first component T1 is not correlated with the concentration (Fig. 5). It exhibits large oscillations of the spectral intensity. Such oscillations could be related to the baseline subtraction which leaves some smooth polynomial residues in the SERS spectra. The algorithm for the baseline subtraction probably has to be improved in the future.
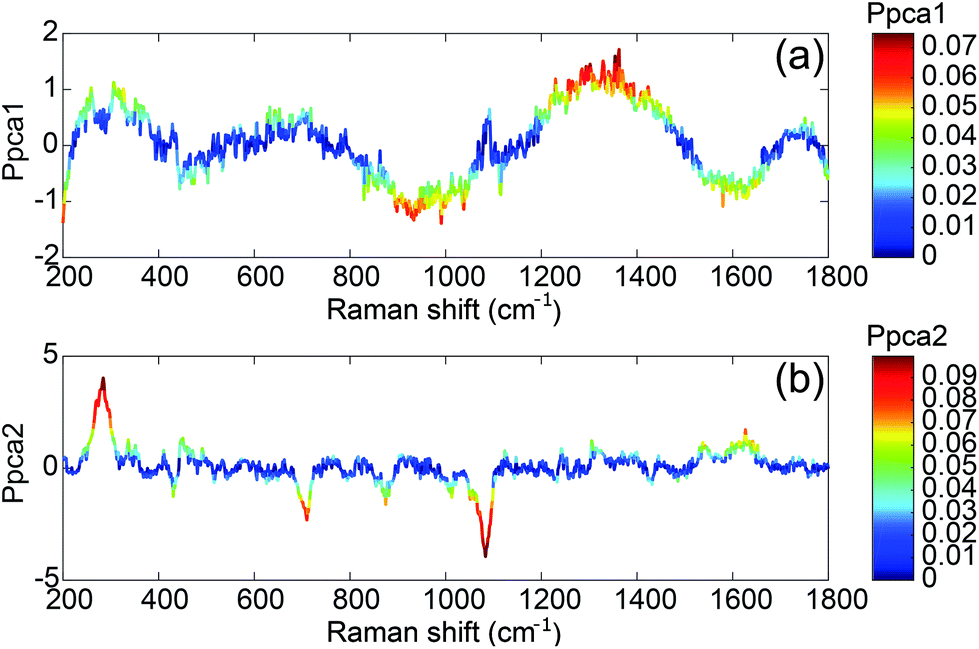 | ||
| Fig. 5 Rescaled loadings for (a) first component T1 and (b) second component T2. | ||
The second component T2 corresponds clearly to spectral variations induced by the modification of the concentration. This component is negatively correlated with the intensities of the 1083, 870 and 710 cm−1 SERS bands and positively correlated with the 1665 cm−1 band. This implies that the relative intensity of these bands is related to the concentration. Only these three bands tend to disappear when the concentration increases whereas the other aptamer band located in the 1100–1500 cm−1 range remains unchanged. Thus the observed correlation is not related to the desorption of the aptamer but to the modification of the aptamer conformation induced by its interaction with the OTA. Without any monitoring, the PCA analysis is able to find a component correlated with the concentration and we demonstrate that the presence of OTA creates significant and detectable spectral variations.
3.3. Quantitative PLS model
After the PCA analysis, we decided to create a model to predict the concentration of OTA based on the partial least squares regression method. The aim is to find a predictive component (Tpred) maximising its variation with the concentration and another linearly independent component (orthogonal one, Torth), maximising the variation that is not correlated with the concentration. The score plot of these two components is presented in Fig. 6. We can observe a very good separation of the different concentrations (coded with colors) along Tpred. We can also notice that this score plot is similar to that of PCA. The loading plots of PCA and OPLS (not shown here) are also very similar. The Torth is similar to the T1 of PCA whereas Tpred corresponds to T2. This is a good indication of the robustness of the model. Thus the fit is performed using only one significant component (Tpred) and the baseline correction does not affect the concentration prediction.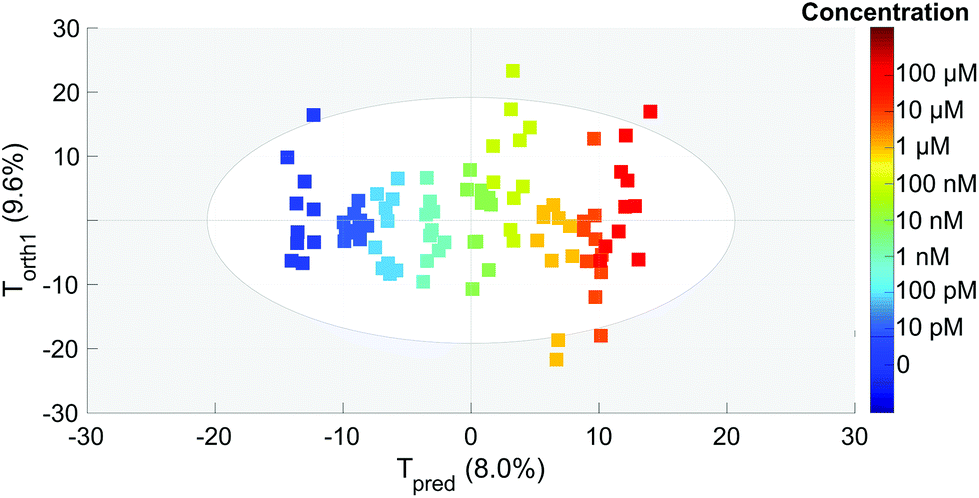 | ||
| Fig. 6 OPLS analysis score plot. Each point represents one spectrum in the subspace generated by the predictive (Tpred) and first orthogonal (Torth) components. The different concentrations are indicated with colors (color scale on the right). | ||
In Fig. 7a and b the concentrations predicted by the OPLS model are presented. All spectra are colored and sorted by their actual concentration in OTA. When all spectra are used to make the model (Fig. 7a), the fit is almost perfect (RY2 = 0.990). To validate the model, we used the 7-fold cross validation technique and predicted again the concentration for all spectra (Fig. 7b). In this case the fit is still very significant (QY2 = 0.897). This indicates that the created model is robust and does not depend on the dataset. In addition, with the cross validated model, we can see a saturation of the signal for concentrations higher than 1 μM. This is expected since the aptamer has a strong affinity to the target. Hence all aptamer sites are saturated for concentrations of OTA higher than 1 μM and the SERS signal does not increase further.
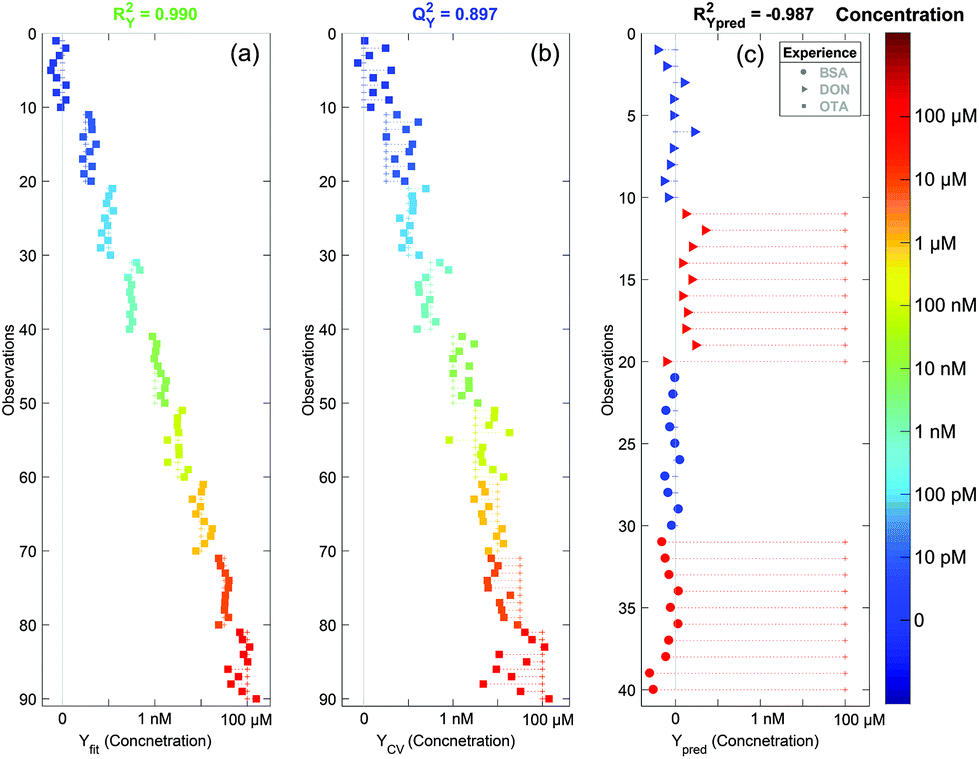 | ||
| Fig. 7 OPLS plot. (a) Fit with all spectra, (b) 7-fold cross validated model and (c) concentration prediction for the negative control (DON: triangles and BSA: circles). The dot colors correspond to the compound concentration indicated in the color bar in the right. For each dot, the horizontal dashed line indicates the difference between the predicted concentration and the actual one. | ||
Using the cross validated model, we can ascertain the concentration with an error of approximately one decade. This large uncertainty is due to the fast SERS acquisition (1 minute) which gave us noisy spectra. This means that the quantification of the OTA concentration can be easily improved if we increase the accumulation time or by using a macro Raman spectrometer that could enable the acquisition of an averaged spectrum with a higher intensity and a better signal to noise ratio. However we demonstrated that our SERS sensor is highly sensitive with a detection of OTA down to the pM range and that we can detect OTA with good accuracy on a wide concentration range from the pM to the μM.
3.4. Negative controls
To ensure the specificity of our detection, we performed a negative control using potential contaminants in the food matrices. We tried to detect two other compounds: (i) the deoxynivalenol (DON), another common mycotoxin known as vomitoxin, and (ii) the bovine serum albumin (BSA), a big protein that has strong affinity to the gold surface. The SERS substrates were still functionalised with the aptamer and the surface blocked by MOH. SERS acquisition was performed before and after adding a 100 μM concentrated solution of DON or BSA. No clear differences were observed on the raw spectra (data not shown). We analysed these spectra using our OPLS model. Since there may be small spectral variations from one batch to another, we performed a correction known as the batch correction. It consists of subtracting the average spectrum of the null concentration from all spectra from the batch and to add afterwards the average null concentration spectrum from the batch used to create the model. This method is commonly used in statistical analysis and allows an accurate analysis of the spectral variations inside a given batch. We can see in Fig. 7c that for both cases (DON and BSA) the predicted concentration of OTA using the model is zero (red triangles and red circles for DON and BSA respectively). Thus our sensor is not sensitive to non-targeted molecules even at very high concentrations. This demonstrates the high specificity of the detection.4. Conclusion
Picomolar detection of OTA was achieved using a simple and cheap SERS substrate involving a rough gold surface being functionalised with a specific aptamer. The analysis of the spectral variation of the SERS signal using powerful statistical methods (OPLS and PCA) allows sensitive, and quantitative detection over a wide concentration range from the pM to the μM level. We also demonstrated that our sensor is not sensitive to non-specific molecules (DON and BSA), indicating that our detection is selective through the use of a specific aptamer.Conflicts of interest
There are no conflicts to declare.Acknowledgements
The authors acknowledge the ANR P2N PIRANEX project (ANR-12-NANO-0016) and the ANRT Association Nationale de la Recherche et de la Technologie for financial support.References
- E. O'Brien and D. R. Dietrich, Crit. Rev. Toxicol., 2005, 35, 33–60 CrossRef.
- B. Zimmerli and R. Dick, Food Addit. Contam., 1996, 13, 655–668 CrossRef CAS PubMed.
- V. Polizzi, B. Delmulle, A. Adams, A. Moretti, A. Susca, A. Maria Picco, Y. Rosseel, R. Kindt, J. V. Bocxlaer, N. D. Kimpe, C. V. Peteghem and S. D. Saeger, J. Environ. Monit., 2009, 11, 1849–1858 RSC.
- J. L. Richard, R. D. Plattner, J. May and S. L. Liska, Mycopathologia, 1999, 146, 99 CrossRef CAS PubMed.
- P. Krogh, B. Hald and E. J. Pedersen, Acta Pathol., Microbiol. Immunol. Scand., Sect. B, 1973, 81, 689–695 CAS.
- W. E. Huff, R. D. Wyatt and P. B. Hamilton, Appl. Microbiol., 1975, 30, 48–51 CAS.
- S. Suzuki, Y. Kozuka, T. Satoh and M. Yamazaki, Toxicol. Appl. Pharmacol., 1975, 34, 479–490 CrossRef CAS PubMed.
- A. Pfohl-Leszkowicz and R. A. Manderville, Mol. Nutr. Food Res., 2007, 51, 61–99 CAS.
- M. Kanisawa, S. Suzuki, Y. Kozuka and M. Yamazaki, Toxicol. Appl. Pharmacol., 1977, 42, 55–64 CrossRef CAS PubMed.
- H. Boudra, P. Le Bars and J. Le Bars, Appl. Environ. Microbiol., 1995, 61, 1156–1158 CAS.
- P. Manda, K. M. Adanou, D. Ardjouma, A. J. B. Adepo and D. S. Dano, Mycotoxin Res., 2016, 32, 137–143 CrossRef CAS PubMed.
- M. A. Stander and P. S. Steyn, S. Afr. J. Enol. Vitic., 2017, 23, 9–13 Search PubMed.
- S. Belakova, K. Benesova, R. Mikulikova, Z. Svoboda and J. Caslavsky, Kvasny Prum., 2013, 1 Search PubMed.
- J. G. Menzies and T. K. Turkington, Can. J. Plant Pathol., 2015, 37, 40–51 CrossRef.
- I. Barna-Vetró, L. Solti, J. Téren, Á. Gyöngyösi, E. Szabó and A. Wölfling, J. Agric. Food Chem., 1996, 44, 4071–4074 CrossRef.
- B. Zimmerli and R. Dick, J. Chromatogr. B: Biomed. Sci. Appl., 1995, 666, 85–99 CrossRef CAS PubMed.
- A. Visconti, M. Pascale and G. Centonze, J. Chromatogr. A, 1999, 864, 89–101 CrossRef CAS PubMed.
- N. Guillot and M. Lamy de la Chapelle, J. Quant. Spectrosc. Radiat. Transfer, 2012, 113, 2321–2333 CrossRef CAS.
- S. Nie and S. R. Emory, Science, 1997, 275, 1102–1106 CrossRef CAS PubMed.
- K. Kneipp, Y. Wang, H. Kneipp, L. T. Perelman, I. Itzkan, R. R. Dasari and M. S. Feld, Phys. Rev. Lett., 1997, 78, 1667–1670 CrossRef CAS.
- E. C. Le Ru and P. G. Etchegoin, Annu. Rev. Phys. Chem., 2012, 63, 65–87 CrossRef CAS PubMed.
- S. Boujday, M. Lamy de la Chapelle, J. Srajer and W. Knoll, Sensors, 2015, 15, 21239–21264 CrossRef CAS PubMed.
- N. Guillot and M. Lamy de la Chapelle, J. Nanophotonics, 2012, 6, 064506 CrossRef.
- L. Xu, H. Yin, W. Ma, H. Kuang, L. Wang and C. Xu, Biosens. Bioelectron., 2015, 67, 472–476 CrossRef CAS PubMed.
- L. Song, K. Mao, X. Zhou and J. Hu, Talanta, 2016, 146, 285–290 CrossRef CAS PubMed.
- I. Tijunelyte, S. Betelu, J. Moreau, I. Ignatiadis, C. Berho, N. Lidgi-Guigui, E. Guénin, C. David, S. Vergnole, E. Rinnert and M. Lamy de la Chapelle, Sensors, 2017, 17, 1198 CrossRef PubMed.
- M. Cottat, N. Lidgi-Guigui, F. Hamouda, B. Bartenlian, D. Venkataraman, R. S. Marks, T. W. J. Steele and M. Lamy de la Chapelle, J. Opt., 2015, 17, 114019 CrossRef.
- M. Cottat, C. D'Andrea, R. Yasukuni, N. Malashikhina, R. Grinyte, N. Lidgi-Guigui, B. Fazio, A. Sutton, O. Oudar, N. Charnaux, V. Pavlov, A. Toma, E. Di Fabrizio, P. G. Gucciardi and M. Lamy de la Chapelle, J. Phys. Chem. C, 2015, 119, 15532–15540 CAS.
- M. Cottat, R. Yasukuni, Y. Homma, N. Lidgi-Guigui, N. Varin-Blank, M. L. De La Chapelle and C. Le Roy, Sci. Rep., 2017, 7, 39766 CrossRef CAS PubMed.
- L. Zhang, J. Xu, L. Mi, H. Gong, S. Jiang and Q. Yu, Biosens. Bioelectron., 2012, 31, 130–136 CrossRef CAS PubMed.
- M. Sanles-Sobrido, L. Rodríguez-Lorenzo, S. Lorenzo-Abalde, Á. González-Fernández, M. A. Correa-Duarte, R. A. Alvarez-Puebla and L. M. Liz-Marzán, Nanoscale, 2009, 1, 153–158 RSC.
- K. C. Bantz, A. F. Meyer, N. J. Wittenberg, H. Im, Ö. Kurtuluş, S. H. Lee, N. C. Lindquist, S.-H. Oh and C. L. Haynes, Phys. Chem. Chem. Phys., 2011, 13, 11551–11567 RSC.
- B. C. Galarreta, M. Tabatabaei, V. Guieu, E. Peyrin and F. Lagugné-Labarthet, Anal. Bioanal. Chem., 2013, 405, 1613–1621 CrossRef CAS PubMed.
- E.-O. Ganbold, C. M. Lee, E.-M. Cho, S. J. Son, S. Kim, S.-W. Joo and S. I. Yang, Anal. Methods, 2014, 6, 3573–3577 RSC.
- J. A. Cruz-Aguado and G. Penner, Anal. Chem., 2008, 80, 8853–8855 CrossRef CAS PubMed.
- J. Trygg and S. Wold, J. Chemom., 2002, 16, 119–128 CrossRef CAS.
- S. Wold, K. Esbensen and P. Geladi, Chemom. Intell. Lab. Syst., 1987, 2, 37–52 CrossRef CAS.
- P. Geladi and B. R. Kowalski, Anal. Chim. Acta, 1986, 185, 1–17 CrossRef CAS.
- R. Malini, K. Venkatakrishna, J. Kurien, K. M. Pai, L. Rao, V. Kartha and C. M. Krishna, Biopolymers, 2006, 81, 179–193 CrossRef CAS PubMed.
- C. Otto, T. J. J. van den Tweel, F. F. M. de Mul and J. Greve, J. Raman Spectrosc., 1986, 17, 289–298 CrossRef CAS.
| This journal is © The Royal Society of Chemistry 2018 |