A graphene oxide nanosensor enables the co-delivery of aptamer and peptide probes for fluorescence imaging of a cascade reaction in apoptotic signaling†
Chang
Liu
,
Yan-Lei
Hu
,
Wen-Jing
Deng
,
Qing-Shan
Pan
,
Jin-Tao
Yi
,
Ting-Ting
Chen
* and
Xia
Chu
 *
*
State Key Laboratory of Chemo/Bio-Sensing and Chemometrics, College of Chemistry and Chemical Engineering, Hunan University, Changsha, 410082, P. R. China. E-mail: xiachu@hnu.edu.cn; chenting1104@hnu.edu.cn; Fax: +86-731-88821916; Tel: +86-731-88821916
First published on 15th November 2017
Abstract
Cytochrome c (Cyt c) and caspase-3 are the key mediators in apoptotic signaling. As is known to all, the release of Cyt c from mitochondria is a vital caspase activation pathway and defines the point of no-return in cell apoptosis. However, it has not been reported that any fluorescence imaging tools could allow simultaneous visualization of Cyt c translocation and caspase-3 activation in apoptotic cells. Here, we develop a sensitive nanosensor that holds the capability of imaging of the released Cyt c from the mitochondria and a caspase-3 activation cascade reaction in apoptotic signaling. The nanosensor is constructed by the assembly of a fluorophore (Cy5)-tagged DNA aptamer on graphene nanosheets that have been covalently immobilized with a FAM-labeled peptide. After a spatially selective delivery into the cytoplasm, the Cy5-tagged DNA aptamer assembled on the nanosensor can bind with Cyt c released from the mitochondria to the cytoplasm and dissociate from graphene, triggering a red fluorescence signal. In addition, the caspase-3 activated by the Cyt c released to the cytoplasm can cleave the FAM-labeled peptide and result in a green fluorescence output. The nanosensor exhibits rapid response, high sensitivity and selectivity for in vitro assays, and high contrast imaging of Cyt c and caspase-3 in living cells. It also provides the method for the study of the kinetic relationship between the Cyt c translocation and caspase-3 activation through simultaneous imaging of Cyt c and caspase-3. The developed nanosensor described here will be an efficient and potential platform for apoptosis research.
Introduction
Apoptosis is a highly regulated and complex process of programmed cell death. It is of utmost significance to cell growth and proliferation, and the deregulation of cell apoptosis would result in many diseases such as neurodegenerative diseases, autoimmune disorders, and cancers.1 Therefore, it is significant for clinical theranostics and cell biology to monitor and modulate the pathways of apoptosis in living cells.2Cytochrome c (Cyt c) exists commonly in the intermembrane space and on the surface of the inner membrane in mitochondria. During the early stage of apoptosis, mitochondria show structural and biochemical changes such as depolarization, swelling, increased permeability of the outer membrane, and release of proteins from the intermembrane space, including Cyt c and caspases.3 The Cyt c released from the mitochondria to the cytoplasm will trigger the activation of caspase family proteases.4 Caspases belong to a class of cysteine aspartase and play a key role during the induction and execution phases of apoptosis.5 Therefore, simultaneous imaging of these two specific molecular metabolites in living cells is vital for apoptotic studies.
So far, techniques for the fluorescence imaging of caspase activation are mainly based on fluorescence-labeled peptide substrates, they need complicated label techniques and commonly suffer from low imaging contrast.6–9 On the other hand, technologies have rarely been explored for imaging the Cyt c release in apoptotic cells. Current techniques for live-cell tracking of Cyt c translocation are related to the subcellular localization of Cyt c with a GFP tag or a short tetracysteine label.10,11 These techniques, however, always suffer from tedious operation to obtain intracellular expressing Cyt c and indirectly complex colocalization analysis of Cyt c with the mitochondria.
Therefore, the imaging methods for direct visualization of the released Cyt c from the mitochondria remain highly desirable. In addition, the tools allowing simultaneous fluorescence imaging of Cyt c release and caspase activation have not been discovered yet.
Graphene is a novel one-atom-thick two-dimensional carbon material. It can adsorb biomolecules, such as nucleic acids and peptides, through π–π stacking on its surface. This excellent adsorption capacity combined with efficient fluorescence quenching makes it particularly suitable for constructing a robust platform for biosensors.12–19 In addition, graphene oxide (GO) can be internalized efficiently into the cytoplasm of various types of cells due to the strong hydrophobic interaction with the lipid molecules of the cell membrane. So, researchers are increasingly concerned about exploiting GO for intracellular delivery and sensing studies in recent years.20 Recently, efforts toward the construction of intracellular biosensors have been explored by using an aptamer or a nucleic acid-adsorbing GO nanocomplex for the detection of various important biomolecules in living cells.21–28 Our group has also designed a peptide–GO or an aptamer–GO nanocomplex for the intracellular delivery of a peptide probe or a nucleic acid probe to detect protease activation or Cyt c release.29,30 However, the utility of GO to deliver multi-probes for simultaneous imaging of multiple biomolecules in living cells is still largely unexploited.
Considering the high correlation between Cyt c release and caspase activation in apoptotic signaling, we designed a nanosensor that allows simultaneous imaging of Cyt c release and caspase activation by covalently conjugating a peptide substrate and adsorbing an aptamer probe on the GO surface (Scheme 1). A peptide substrate was designed including three parts: a spacer peptide not cleavable by proteases at the N terminus, a proteolytic moiety DEVD (Asp-Glu-Val-Asp) peptide sequence that could be recognized specifically by caspase-3, and fluorescein (FAM)-labeled lysine at the C terminus. The peptide substrate was covalently conjugated on the GO surface to form the peptide–GO conjugate by using the succinimide coupling (EDC-NHS). Then, a fluorophore (Cy5) tagged 40-nucleotide DNA aptamer, which could bind selectively with Cyt c, was assembled on the peptide–GO conjugate. Because of the highly efficient quenching effect of GO, the as-prepared nanosensor displayed an extremely weak fluorescence signal. The nanosensor could be internalized by various types of cells into the cytoplasm while not penetrating into the mitochondria. In the process of cell apoptosis, the released Cyt c could bind with the aptamer to form an aptamer–Cyt c complex, resulting in the dissociation of the aptamer from the GO surface and producing highly red fluorescence. This allows direct visualization of the Cyt c release in apoptotic cells. The caspase-3 activated by Cyt c in the cytoplasm could further recognize and cleave the peptide substrate conjugated on the GO surface and deliver a strong green fluorescence. So, the nanoassembly enables simultaneous imaging of Cyt c release and the caspase-3 activation cascade reaction. Here, we demonstrate that GO could be used to deliver multi-probes for simultaneous imaging of multiple biomolecules in living cells.
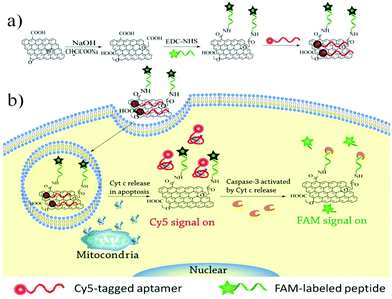 | ||
| Scheme 1 (a) Illustration of the synthesis of the GO–peptide–aptamer nanoassembly, (b) illustration of the fluorescence activation strategy for Cyt c release and caspase-3 activation imaging. | ||
Experimental
Chemicals and materials
Sodium ascorbate, cisplatin, etoposide, digitonin, bovine serum albumin (BSA), lysine (lys), cysteine (cys), glutathione (GSH), β-D-glucosidases, horse radish peroxidase (HRP), rLys-c, peptide (GKACGS), ascorbic acid (AA), carboxyfluorescein-NHS (FAM-NHS), N-hydroxysulfosuccinimide sodium salt (Sulfo-NHS), dicyclohexylcarbodiimide (EDC), cytochrome c (Cyt c), staurosporine (STS) and dimethyl sulfoxide (DMSO) were purchased from Sigma-Aldrich (St Louis, MO). Graphene oxide (GO) was obtained from Xianfeng Nanomaterials Co. Ltd (Nanjing, China). Mitochondria fluorescent trackers (Mito@tracker), hoechst 33342 and lysosome fluorescent trackers (Lyso@tracker) were supplied by Invitrogen (Carlsbad, CA). Recombinant human caspase-3 and the caspase-3 inhibitor ZDEVD-FMK were provided by R & D Systems (Minneapolis, USA). HeLa cells were purchased from the cell bank at Xiangya Hospital (Changsha, China). The caspase-3 specific peptide probe having a sequence of CALNNDEVDK-FAM was obtained from China Peptides. The DNA aptamer (5′ Cy5-CCG TGT CTG GGG CCG ACC GGC GCA TTG GGT ACG TTG TTG C-3′) and nonaptamer DNA (5′ Cy5-ATG ATG CAT CAT CTC TGA AGT AGC GCC GCC GTA TAC TCA C-3′) were synthesized at Sangon Biotech Co. (Shanghai, China). All solutions were prepared by using sterilized Milli-Q ultrapure water (18.2 MΩ).Preparation of graphene oxide (GO)–peptide–aptamer nanoassembly
1 mg mL−1 GO aqueous solution was prepared with graphene oxide. Then, the GO suspension was sonicated in an ice bath using a probe-type sonicator at a power of 40 W for 1 h and centrifuged at 12![[thin space (1/6-em)]](https://www.rsc.org/images/entities/char_2009.gif) 000 rpm for 10 min, and then the supernatant was collected. To obtain the carboxylated GO, 125 mM NaOH and 42.9 mM ClCH2COONa were added to 1.5 mL GO suspension and sonicated for 1 h. Subsequently, the mixture was purified by dialysis for 2 days.29 In the conjugation of GO with the peptide, 1 mM EDC-HCl and 5 mM Sulfo-NHS were added to the carboxylated GO suspension dispersed in 0.1 M PB and sonicated for 1 h. After the mixture was adjusted to pH 8.0 with 1 mM NaOH, 1 mM caspase-3 specific peptide probe was added and stirred vigorously at 37 °C for 2 h. Finally, the GO–peptide conjugate was dialyzed for 2 days. Subsequently, the DNA aptamer was assembled on the GO–peptide conjugate. In order to optimize the amount of the GO–peptide conjugate, we have adopted titration with varying amounts of the GO–peptide conjugate, and the optimal amount was decided by a fluorescence decrease. In consideration of the highly efficient quenching effect of GO nanosheets on the Cy5-aptamer, it was supposed that the maximum amount of 50 nM aptamer should be assembled on the 15 μg mL−1 GO–peptide conjugate (Fig. S1†). Therefore, the GO–peptide–aptamer nanosensor was obtained by incubation of the 150 μg mL−1 GO–peptide conjugate with the 500 nM Cy5-tagged aptamer for 30 min in 10× PBS buffer (10× PBS, 100 mM KH2PO4/K2HPO4, 27 mM KCl, 1370 mM NaCl, pH 7.4).
000 rpm for 10 min, and then the supernatant was collected. To obtain the carboxylated GO, 125 mM NaOH and 42.9 mM ClCH2COONa were added to 1.5 mL GO suspension and sonicated for 1 h. Subsequently, the mixture was purified by dialysis for 2 days.29 In the conjugation of GO with the peptide, 1 mM EDC-HCl and 5 mM Sulfo-NHS were added to the carboxylated GO suspension dispersed in 0.1 M PB and sonicated for 1 h. After the mixture was adjusted to pH 8.0 with 1 mM NaOH, 1 mM caspase-3 specific peptide probe was added and stirred vigorously at 37 °C for 2 h. Finally, the GO–peptide conjugate was dialyzed for 2 days. Subsequently, the DNA aptamer was assembled on the GO–peptide conjugate. In order to optimize the amount of the GO–peptide conjugate, we have adopted titration with varying amounts of the GO–peptide conjugate, and the optimal amount was decided by a fluorescence decrease. In consideration of the highly efficient quenching effect of GO nanosheets on the Cy5-aptamer, it was supposed that the maximum amount of 50 nM aptamer should be assembled on the 15 μg mL−1 GO–peptide conjugate (Fig. S1†). Therefore, the GO–peptide–aptamer nanosensor was obtained by incubation of the 150 μg mL−1 GO–peptide conjugate with the 500 nM Cy5-tagged aptamer for 30 min in 10× PBS buffer (10× PBS, 100 mM KH2PO4/K2HPO4, 27 mM KCl, 1370 mM NaCl, pH 7.4).
Characterization of the materials
The atomic force microscopy (AFM) images were recorded by using a Bruker Bioscope system (Bruker, Germany). Fourier transform infrared spectroscopy (FT-IR) spectra were recorded by using a Nicolet 5700 spectrometer by using pressed KBr tablets (Nicolet, USA). Fluorescence spectra were recorded on a Fluoromax-4 spectrofluorometer (Jobin Yvon, USA). The UV-visible (UV-vis) absorption spectra were obtained in a quartz cell at room temperature with an optical length of 1 cm using a UV-2550 spectrometer (Shimadzu, Japan). All fluorescence images of cells were recorded on a Nikon confocal laser scanning fluorescence microscope (Nikon, Japan).In vitro detection of Cyt c and caspase-3
To detect Cyt c, 10 μL of varying concentrations of Cyt c solutions in 10× PBS was added to 90 μL of the 15 μg mL−1 GO–peptide–aptamer nanoassembly prepared as mentioned above, and incubated at 37 °C for 30 min. For the assay of caspase-3, 10 μL of different concentrations of caspase-3 solutions was mixed with 90 μL of the 15 μg mL−1 GO–peptide–aptamer nanoassembly followed by incubation for 1 h at 37 °C. The fluorescence spectra were then recorded on a Fluoromax-4 spectrofluorometer.Fluorescence imaging of living cells
HeLa cells were grown in RPMI 1640 medium (Thermo Scientific HyClone) supplemented with 15% heat-inactivated fetal bovine serum (Invitrogen), 100 U mL−1 penicillin and 100 U mL−1 gentamicin at 37 °C under a humidified atmosphere containing 5% CO2. When the cells were ∼80% confluent, the cells were washed three times with PBS containing 137 mM NaCl, 2.7 mM KCl, 10 mM Na2HPO4, 1.8 mM KH2PO4, and pH 7.4. Then, for the cell uptake of the nanosensor, the cells were incubated with 1 mL of 15 μg mL−1 GO–peptide–aptamer nanoassembly for 3 h in the RPMI 1640 medium. Then, the medium was exchanged with apoptosis-inducing medium containing 0.5 μM STS, and the cells were incubated for additional 1 h. Then, the cells were washed three times with cold PBS and fluorescence images were obtained by using an oil dipping objective (100×, NA 1.2) on a Nikon confocal laser scanning fluorescence microscope (Nikon, Japan). For exploring the intracellular localization of the nanosensor, a GO–PEG–FAM conjugate was prepared. First, EDC-HCl (1 mM of the final concentration) and Sulfo-NHS (5 mM of the final concentration) were added into the carboxylated GO suspension dispersed in 0.1 M PB and bath-sonicated for 1 h. Then, NH2–PEG–NH2 (1 mM of the final concentration) and FAM-NHS (1 mM of the final concentration) were added into the above mixture and stirred vigorously at 37 °C for 2 h. The HeLa cells were incubated with 15 μg mL−1 of the GO–PEG–FAM conjugate in the RPMI 1640 medium at 37 °C for 3 h. Then, the cells were washed three times with cold PBS, and incubated with the RPMI 1640 medium containing 20 nM Mito@tracker or 20 nM Lyso@tracker for 20 min. Time-dependent fluorescence imaging of Cyt c translocation and caspase-3 activation was performed as follows: HeLa cells were incubated with 1 mL of the RPMI 1640 medium containing 15 μg mL−1 GO–peptide–aptamer nanoassembly for 3 h at 37 °C. Then, the cells were washed three times with PBS, and treated with 0.5 μM STS. On the addition of STS, fluorescence imaging was performed. Real-time fluorescence images were recorded at a faster sampling speed of 10 μs per pixel with a transmissivity of 10%.Results and discussion
Characterization of the GO–peptide–aptamer nanoassembly
To profile the morphological changes during GO–peptide–aptamer nanoassembly preparation, we collected the results by atomic force microscopy (AFM), as shown in Fig. 1. After sonication treatment, most of the GO nanosheets presented a topological height of ∼1 nm, which was typical of the single- or double-layered sheets of GO (Fig. 1a). The GO–peptide conjugate showed a topological height of 4–5 nm, implying the conjugation of the peptide on the GO surface in a lying-down conformation (Fig. 1b). As shown in Fig. 1c, the GO–peptide–aptamer nanoassembly gave an irregular height profile of ∼9 nm, proving that the DNA aptamer was assembled on the GO surface through a coiled conformation.30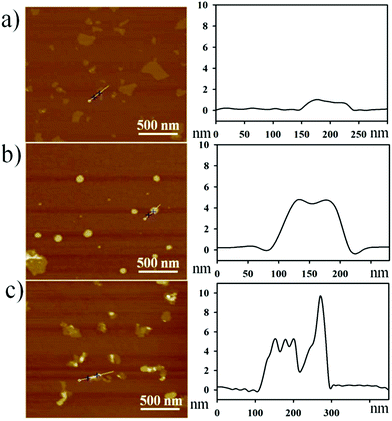 | ||
| Fig. 1 AFM images (left) and height profiles (right): (a) GO, (b) GO–peptide conjugate, and (c) GO–peptide–aptamer nanoassembly. | ||
For better demonstration of the chemical structure of the nanoassembly, infrared spectroscopy was recorded. Curve 1 in Fig. S2† shows three characteristic absorption peaks at 3400, 1710, and 1615 cm−1, evidencing the presence of –OH, C![[double bond, length as m-dash]](https://www.rsc.org/images/entities/char_e001.gif) O and C
O and C![[double bond, length as m-dash]](https://www.rsc.org/images/entities/char_e001.gif) C functional groups in the GO nanosheets. After treatment with chloroacetic acid, a strong absorption band at 1630 cm−1 appeared, which was the characteristic peak of COO−, confirming the formation of the carboxylate moieties COO− on the GO nanosheets. After conjugation with peptides, the appearance of a characteristic band at 1415 cm−1 (stretching vibration of –CO–NH–) and a small peak near 2930 cm−1 (stretching vibration of –CH2) implied the successful preparation of the GO–peptide conjugate. The characteristic absorption peak at 1045 cm−1 (stretching vibration of –C–O/–P–O) verified the aptamer assembly on the GO–peptide conjugate. Furthermore, BSA with a high concentration up to 200 g mL−1 could not displace the peptide from the GO nanosheets (Fig. S3†), which also demonstrated the covalent coupling of the peptide with the GO nanosheets.
C functional groups in the GO nanosheets. After treatment with chloroacetic acid, a strong absorption band at 1630 cm−1 appeared, which was the characteristic peak of COO−, confirming the formation of the carboxylate moieties COO− on the GO nanosheets. After conjugation with peptides, the appearance of a characteristic band at 1415 cm−1 (stretching vibration of –CO–NH–) and a small peak near 2930 cm−1 (stretching vibration of –CH2) implied the successful preparation of the GO–peptide conjugate. The characteristic absorption peak at 1045 cm−1 (stretching vibration of –C–O/–P–O) verified the aptamer assembly on the GO–peptide conjugate. Furthermore, BSA with a high concentration up to 200 g mL−1 could not displace the peptide from the GO nanosheets (Fig. S3†), which also demonstrated the covalent coupling of the peptide with the GO nanosheets.
In vitro detection of Cyt c and caspase-3
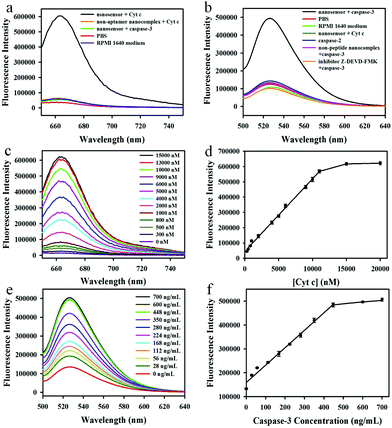
We first investigated the capability of the nanoassembly for the detection of Cyt c and caspase-3 in vitro. The GO–peptide–aptamer nanoassembly showed an extremely weak fluorescence signal because of the high fluorescence quenching efficiency of GO nanosheets for Cy5 and FAM. However, an obvious fluorescence emission peak at 664 nm could be observed when 11 μM Cyt c was added into the nanosensor solution, which corresponded to a ∼48-fold enhancement of the fluorescence signal (Fig. 2a). On the contrary, the control experiments using the non-aptamer nanosensor or incubation with other proteins such as caspase-3 showed a negligible fluorescence signal, indicating that the strong fluorescence signal was due to the specific binding of the aptamer with Cyt c, which resulted in the dissociation of the Cy5-labeled aptamer from the GO nanosheets. Furthermore, no appreciable fluorescent changes could be observed when incubating the nanosensor with the RPMI 1640 medium, implying that the nanosensor was very stable in the cell growth medium and had potential to be an intracellular sensor for the imaging of Cyt c. In addition, we also investigated the capability of the nanosensor to detect caspase-3 in vitro (Fig. 2b). A significantly enhanced fluorescence emission peak at 525 nm could be obtained when the nanosensor was incubated with 600 ng mL−1 caspase-3 at 37 °C for 1 h. In contrast, no appreciable fluorescence changes could be observed in the control experiments including the use of the non-specific peptide substrate (DEVG) or incubation with other proteins such as caspase-2 or Cyt c, implying the occurrence of fluorescence signals related to the cleavage of the specific substrate peptide (DEVD) by caspase-3. When Z-DEVD-fluoromethylketone (FMK), a caspase-3 inhibitor, was added into the reaction solution, no obvious fluorescence signal appeared, which further confirmed the high specificity of the caspase-3 cleavage reaction. Likewise, the incubation of the nanosensor with the RPMI 1640 cell growth medium gave no significant fluorescence.The time-dependent responses of the nanoassembly to Cyt c and caspase-3 were subsequently examined (Fig. S4†). The introduction of Cyt c to the nanosensor resulted in a rapidly increased fluorescence signal at the first 200 s and then gradually reached to a maximum signal at 10 min, showing the fast response for Cyt c allowing the real-time imaging of Cyt c. However, the caspase-3 mediated cleavage reaction was relatively slow, and the maximum fluorescence signal was obtained after incubation for 1 h. The control experiments using caspase-2 or the addition of the inhibitor for caspase-3 showed no obvious fluorescence changes over time.
Next, we evaluated the performance of the nanosensor for the detection of Cyt c and caspase-3 in vitro. The fluorescence activation signals increased with the increasing Cyt c concentrations (Fig. 2c), and the fluorescence intensity at 664 nm correlated linearly with the concentrations of Cyt c (Fig. 2d), implying that the nanosensor could detect the Cyt c successfully. The linear response range (300 nM–11 μM) covered the literature values of intracellular Cyt c (1–10 μM). Therefore, this nanosensor offered a highly sensitive and selective platform to quantitatively determine the Cyt c in apoptosis studies. In addition, the response of the nanosensor to caspase-3 was also investigated. The fluorescence intensity at 525 nm increased with the increasing caspase-3 concentrations (Fig. 2e), with a linear range of 28–448 ng mL−1 (Fig. 2f), proving that the nanosensor could be used to detect caspase-3 sensitively in living cells.
We also investigated the selectivity of the nanosensor. The species probably coexisting with Cyt c and caspase-3, such as AA, lys, GKACGS, β-D-glucosidase, HRP, rlys-c, cys and BSA were incubated with the nanosensor, and fluorescence signals are shown in Fig. 3. The results revealed that these species did not interfere with the detection of Cyt c or caspase-3, indicating the high selectivity of the nanosensor.
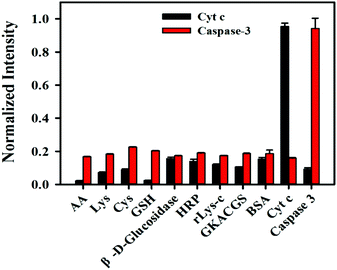 | ||
| Fig. 3 Selectivity of the nanosensor for Cyt c (10 μM) and caspase-3 (450 ng mL−1) over other species (1 mM). | ||
The cytotoxicity of the nanosensor was evaluated by performing the CCK-8 assay with HeLa cells at different nanosensor concentrations (Fig. S5†). The results showed that the nanosensor had very low toxicity, and the cell viability remained at 83% even at a high nanosensor concentration up to 200 μg mL−1, implying that this nanosensor did not result in cell apoptosis at a concentration of 15 μg mL−1 used in the work.
Imaging of Cyt c and caspase-3 in living cells
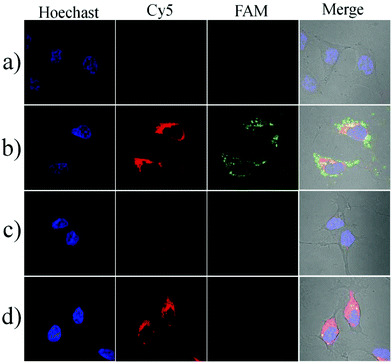
To investigate the localization of the nanosensor in cells, we prepared a nanocomplex which is conjugated with a fluorophore (FAM-NHS) on the GO nanosheets through a difunctional crosslinker (NH2–PEG–NH2). The GO–PEG–FAM conjugation could provide a green fluorescence signal without being quenched by GO because the crosslinker PEG was very long and the FAM was far away from the GO surface. The HeLa cells were first incubated with the FAM-modified conjugate at 37 °C for 3 h, and then stained with the lysosomes or mitochondrion trackers (Mito@tracker and Lyso@tracker, emission peak at 590 nm). The imaging results are shown in Fig. S6.† The GO–PEG–FAM conjugation was internalized efficiently by the HeLa cells and distributed uniformly in the cytoplasm. It could be observed that the conjugation was not colocalized with the lysosomes, indicating that the nanoassembly could escape from the endosomes or lysosomes efficiently. In addition, the nanoassembly was also not colocalized with the mitochondria, and this cytoplasmic localization separated the nanoassembly from Cyt c in the mitochondrial intermembrane space, enabling the fluorescence imaging of the translocation of Cyt c.Next, we performed the imaging of Cyt c translocation and caspase-3 activation in apoptotic cells. After incubation with the nanosensor in the serum-free RPMI-1640 medium at 37 °C for 3 h, the HeLa cells showed an extremely weak fluorescence signal either a green or a red channel, indicating the spatial isolation of the nanoassembly from Cyt c in the intermembrane space of the mitochondria (Fig. 4a). When the cells were treated for 1 h with 0.5 μM staurosporine (STS), an apoptosis inducer that triggers Cyt c during the release of mitochondria to the cytoplasm, the bright red and green fluorescence images could be obtained, implying that the nanosensor could probe the Cyt c translocation event and caspase-3 activation caused by Cyt c (Fig. 4b). In contrast, when the cells were pretreated with pepstatin A, an inhibitor that prevents Cyt c release and caspase-3 activation, no substantial fluorescence changes could be observed even when incubated with STS (Fig. 4c). In addition, the treatment with Z-DEVD-FMK, a strong caspase-3 inhibitor, resulted in a bright red fluorescence and a weak green fluorescence (Fig. 4d). These results provided sufficient evidence that the nanosensor could specifically detect the intracellular Cyt c translocation and caspase-3 activation. The corresponding flow cytometric assay was also performed (Fig. S7†). The cells induced by STS showed a significant fluorescence increase. The pretreatment of the cells with pepstatin A displayed no obvious increase in either the red fluorescence or the green fluorescence. However, upon incubation with Z-DEVD-FMK, the cells gave a bright red fluorescence but the green fluorescence was very weak. These results were consistent with those obtained in the fluorescence imaging experiment.
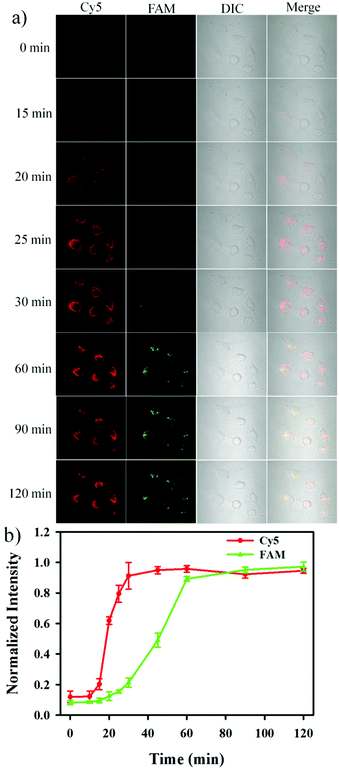
The nanosensor was subsequently utilized to monitor the release of Cyt c and the activation of caspase-3 in apoptotic cells in real-time. As shown in Fig. 5, an appreciable red fluorescence appeared at 15 min after the addition of 0.5 μM STS, and the fluorescence intensity reached a maximum value at 25 min. The result indicated that the release of Cyt c was very rapid and completed within ∼10 min. On the other hand, it could be observed that a green fluorescence signal appeared at 30 min after the addition of 0.5 μM STS, and reached a maximum signal at ∼60 min.31–33 These results provided the straightforward evidence that Cyt c release from the mitochondria to the cytoplasm was followed by the activation of caspase-3 during cell apoptosis, and it was consistent with the recognized apoptotic signaling in which cytoplasmic Cyt c was responsible for the caspase-3 activation.34
Besides the ability to elucidate the apoptotic signaling pathway in living cells, the nanosensor had the potential to screen the apoptosis-inducing compounds for drug development. To demonstrate this possibility, we investigated five candidate compounds including digitonin, sodium ascorbate, STS, cisplatin and etoposide. After incubation with the nanosensor for 3 h, the HeLa cells were treated with the individual compound (2 μM) for additional 1 h. As shown in Fig. S8a,† the cells treated with STS showed the brightest fluorescence images both in green and red channels, followed sequentially by etoposide, cisplatin and sodium ascorbate, and no fluorescence signal appeared for digitonin. The results proved STS to be the most effective apoptosis reagent. Although digitonin could destroy plasma membranes, it did not induce apoptosis and, therefore, showed no fluorescence activation. Moreover, the flow cytometric assay was also carried out to verify the results obtained by the five candidate compounds (Fig. S8b†). The results were consistent with those obtained by fluorescence imaging. These results suggested that the nanosensor provided a viable platform for cell-based screening of apoptosis-inducing drugs.
Conclusions
We provided a nanosensor that enabled imaging of Cyt c translocation and the caspase-3 activation cascade reaction in apoptotic signaling. The nanosensor was constructed by the assembly of a DNA aptamer on the GO–peptide conjugate and displayed high sensitivity, selectivity, and rapid response for the quantification assay of Cyt c and caspase-3 in vitro. The nanosensor could be internalized efficiently into the cytoplasm and this spatial separation from Cyt c in the mitochondria enabled the fluorescence imaging of Cyt c translocation from the mitochondria to the cytoplasm and subsequent caspase-3 activation. The nanosensor could image Cyt c and caspase-3 in living cells with high imaging contrast and selectivity. The real-time monitoring of Cyt c translocation and caspase-3 activation has been realized for the first time, providing the straightforward evidence that Cyt c release from the mitochondria was followed by the activation of caspase-3. Furthermore, the nanosensor was proved to be used for cell-based screening of apoptosis-inducing drugs. Taken together, the nanosensor provided a valuable platform for apoptotic studies and drug development.Conflicts of interest
There are no conflicts to declare.Acknowledgements
This work was supported by the National Natural Science Foundation of China (No. 21525522), the Foundation for Innovative Research Groups of NSFC (Grant 21521063) and the National Postdoctoral Program for Innovative Talents (BX 20160049).Notes and references
- Y. L. P. Ow, D. R. Green, Z. Hao and T. W. Mak, Nat. Rev. Mol. Cell Biol., 2008, 9, 532–542 CrossRef CAS PubMed.
- S. W. Tait and D. R. Green, Nat. Rev. Mol. Cell Biol., 2010, 11, 621–632 CrossRef CAS PubMed.
- M. Saikia, R. Jobava, M. Parisien, A. Putnam, D. Krokowski, X. H. Gao, B. J. Guan, Y. Yuan, E. Jankowsky and Z. Feng, Mol. Cell. Biol., 2014, 34, 2450–2463 CrossRef PubMed.
- J. Cai, J. Yang and D. P. Jones, Biochim. Biophys. Acta, 1998, 1366, 139–149 CrossRef CAS.
- D. R. Green and G. Kroemer, Science, 2004, 305, 626–629 CrossRef CAS PubMed.
- Y. W. Jun, S. Sheikholeslami, D. R. Hostetter, C. Tajon, C. S. Craik and A. P. Alivisatos, Proc. Natl. Acad. Sci. U. S. A., 2009, 106, 17735–17740 CrossRef CAS PubMed.
- S. Y. Lin, N. T. Chen, S. P. Sun, J. C. Chang, Y. C. Wang, C. S. Yang and L. W. Lo, J. Am. Chem. Soc., 2010, 132, 8309–8315 CrossRef CAS PubMed.
- Y. Shaulov-Rotem, E. Merquiol, T. W. Sadan, O. Moshel, S. J. Salpeter, D. Shabat, F. Kaschani, M. Kaiser and G. Blum, Chem. Sci., 2016, 7, 1322–1337 RSC.
- L. Tyas, V. A. Brophy, A. Pope, A. J. Rivett and J. M. Tavaré, EMBO Rep., 2000, 1, 266–270 CrossRef CAS PubMed.
- J. C. Goldstein, C. Muñozpinedo, J. E. Ricci, S. R. Adams, A. Kelekar, M. Schuler, R. Y. Tsien and D. R. Green, Cell Death Differ., 2005, 12, 453–462 CrossRef CAS PubMed.
- J. C. Goldstein, N. J. Waterhouse, P. Juin, G. I. Evan and D. R. Green, Nat. Cell Biol., 2000, 2, 156–162 CrossRef CAS PubMed.
- J. Liu, C. Wang, Y. Jiang, Y. Hu, J. Li, S. Yang, Y. Li, R. Yang, W. Tan and C. Z. Huang, Anal. Chem., 2013, 85, 1424–1430 CrossRef CAS PubMed.
- H. Chang, L. Tang, Y. Wang, J. Jiang and J. Li, Anal. Chem., 2010, 82, 2341–2346 CrossRef CAS PubMed.
- C. H. Lu, H. H. Y. Prof, C. L. Z. Dr and C. P. Xi, Angew. Chem., Int. Ed., 2009, 48, 4785–4787 CrossRef CAS PubMed.
- J. Balapanuru, J. X. Yang, S. Xiao, Q. Bao, M. Jahan, L. Polavarapu, J. Wei, Q. H. Xu and K. P. Loh, Angew. Chem., Int. Ed., 2010, 49, 6549–6553 CrossRef CAS PubMed.
- Y. Q. Yu, H. Y. Zhang, Y. Q. Chai, R. Yuan and Y. Zhuo, Biosens. Bioelectron., 2016, 85, 8–15 CrossRef CAS PubMed.
- X. Li, X. L. Ding and J. Fan, Analyst, 2015, 140, 7918–7925 RSC.
- X. Liu, F. Wang, R. Aizen, O. Yehezkeli and I. Willner, J. Am. Chem. Soc., 2013, 135, 11832–11839 CrossRef CAS PubMed.
- P. Liang, Q. Li, Z. Wu, J. H. Jiang and R. Q. Yu, Analyst, 2016, 141, 3989–3992 RSC.
- J. M. Yoo, J. H. Kang and B. H. Hong, Chem. Soc. Rev., 2015, 44, 4835–4852 RSC.
- Y. Wang, Z. Li, D. Hu, C. T. Lin, J. Li and Y. Lin, J. Am. Chem. Soc., 2010, 132, 9274–9276 CrossRef CAS PubMed.
- Y. Wang, L. Tang, Z. Li, Y. Lin and J. Li, Nat. Protoc., 2014, 9, 1944–1955 CrossRef CAS PubMed.
- M. Liu, J. Song, S. Shuang, C. Dong, J. D. Brennan and Y. Li, ACS Nano, 2014, 8, 5564–5573 CrossRef CAS PubMed.
- F. Wang, B. Zhang, L. Zhou, Y. Shi, Z. Li, Y. Xia and J. Tian, ACS Appl. Mater. Interfaces, 2016, 8, 9014–9021 CAS.
- C. Shao, J. Liang, S. He, T. Luan, J. Yu, H. Zhao, J. Xu and L. Tian, Anal. Chem., 2017, 89, 5445–5452 CrossRef CAS PubMed.
- Y. Yang, A. M. Asiri, Z. Tang, D. Du and Y. Lin, Mater. Today, 2013, 16, 365–373 CrossRef CAS.
- W. Li, J. Wang, J. Ren and X. Qu, Angew. Chem., Int. Ed., 2013, 52, 6726–6730 CrossRef CAS PubMed.
- M. Yi, S. Yang, Z. Peng, C. Liu, J. Li, W. Zhong, R. Yang and W. Tan, Chem. Commun., 2010, 46, 3116–3118 RSC.
- H. Wang, Q. Zhang, X. Chu, T. Chen, J. Ge and R. Yu, Angew. Chem., Int. Ed., 2011, 50, 7065–7069 CrossRef CAS PubMed.
- T. T. Chen, X. Tian, C. L. Liu, J. Ge, X. Chu and Y. Li, J. Am. Chem. Soc., 2015, 137, 982–989 CrossRef CAS PubMed.
- H. B. Shi, R. T. K. Kwok, J. Z. Liu, B. G. Xing, B. Z. Tang and B. Liu, J. Am. Chem. Soc., 2012, 134, 17972–17981 CrossRef CAS PubMed.
- Y. Y. Yuan, C. J. Zhang, R. T. K. Kwok, D. Mao, B. Z. Tang and B. Liu, Chem. Sci., 2017, 8, 2723–2728 RSC.
- H. B. Shi, N. Zhao, D. Ding, J. Liang, B. Z. Tang and B. Liu, Org. Biomol. Chem., 2013, 11, 7289–7296 CAS.
- D. E. Wood and E. W. Newcomb, J. Biol. Chem., 1999, 274, 8309–8315 CrossRef CAS PubMed.
Footnote |
| † Electronic supplementary information (ESI) available. See DOI: 10.1039/c7an01515a |
| This journal is © The Royal Society of Chemistry 2018 |

