
 Open Access Article
 This Open Access Article is licensed under a
 Creative Commons Attribution 3.0 Unported Licence
On the role of C4 and C5 products in electrochemical CO2 reduction via copper-based catalysts†
Simon D.
Rihm‡
 abc,
Mikhail K.
Kovalev‡
b,
Alexei A.
Lapkin
ab,
Joel W.
Ager
def and
Markus
Kraft
*abgh
abc,
Mikhail K.
Kovalev‡
b,
Alexei A.
Lapkin
ab,
Joel W.
Ager
def and
Markus
Kraft
*abgh
aDepartment of Chemical Engineering and Biotechnology, University of Cambridge, Cambridge CB3 0AS, UK. E-mail: mk306@cam.ac.uk
bCambridge Centre for Advanced Research and Education in Singapore, CARES Ltd., 1 Create Way, CREATE Tower #05-05, 138602, Singapore
cDepartment of Chemical and Biomolecular Engineering, National University of Singapore, 4 Engineering Drive 4, 117585, Singapore
dDepartment of Materials Science and Engineering, University of California Berkeley, Berkeley, California 94720, USA
eBerkeley Education Alliance for Research in Singapore (BEARS), Ltd., 1 CREATE Way, 138602, Singapore
fMaterials and Chemical Sciences Divisions, Lawrence Berkeley National Laboratory, Berkeley, California 94720, USA
gSchool of Chemical and Biomedical Engineering, Nanyang Technological University, 62 Nanyang Drive, 637459, Singapore
hThe Alan Turing Institute, London, UK
First published on 7th March 2023
Abstract
Utilising carbon dioxide by synthesising commodity chemicals via electrocatalysis shows potential for long-term energy storage and industry decarbonisation. The latest copper-based gas-diffusion electrodes can operate at high currents, enabling large conversion rates. However, our incomplete understanding of active reaction paths in this system hinders us from designing catalysts with improved selectivities and reduced poisoning. Here, we identify and analyse ten previously unknown minor products of electrochemical CO2 reduction. Using an ultra-sensitive GC-MS setup, we report more than 20 products, including C5 species for the first time. From the trends in selectivity, we hypothesise two distinct reaction paths: while the coupling of oxygenated intermediates begins at very small potentials and favours double bond formation in the middle of carbon chains, coupling of highly-reduced methane precursors requires a large potential and leads to double bond formation at the chain end. This contribution represents a significant step towards the holistic comprehension of the mechanism for electrocatalytic CO2 reduction and calls for further mechanistic exploration via minor products and investigation of favourable reaction conditions.
Broader contextGlobal warming driven by anthropogenic CO2 emissions currently poses one of the biggest threats to our society and therefore needs to be addressed on a global scale. To achieve this, we not only need to drastically reduce carbon emissions but even come up with carbon-negative technologies. Two of the most important challenges are CO2 utilization and efficient energy storage since renewable energy sources often vary considerably in their output across space and time. The electrochemical reduction of CO2 to hydrocarbons is a promising pathway to convert renewable energy into fuels and commodity chemicals. Copper-based electrodes can produce a wide variety of valuable products such as ethylene and immense progress has been made in engineering electrodes for high-current conversion. Increasing efficiencies for valuable products remains the critical barrier towards economic feasibility and commercialisation. For systematic improvement, a deeper understanding of the fundamental processes is needed though – especially the mechanism of dimerization remains an ongoing topic of discussion. Further study into reaction paths – especially for state-of-the-art high-current systems – will allow to enhance the efficiency of CO2 utilisation and hence is likely to provide a viable negative emissions technology which will be critical for the achievement of climate mitigation targets. |
1. Introduction
The development of true negative emission technologies is mission-critical for mitigating climate change.1 Electrochemical reduction of CO2 (eCO2R) to hydrocarbons is a promising way to convert emissions into fuels and commodity chemicals. Copper-based electrodes are particularly promising because they can produce C2+ species, including a variety of valuable products.2,3 Researchers in the field have intensely studied these electrodes,4–6 particularly to produce ethylene7 as they can reach large faradaic efficiencies of up to 75% with some setups.8 Recently, gas-diffusion electrodes (GDE) operated under alkaline conditions have been in the spotlight9–11 as they allow for large current densities and could enable economically viable applications in the long term.12 As of now, the chemical industry is hard-to-decarbonise; eCO2R could not only help to decarbonise this sector, but also ultimately make it a negative emissions sector.However, a key issue remains. Increasing and maintaining selectivities toward one or more specific products is still challenging because the products are formed in a multi-step mechanism. Synthesising ethylene via electrocatalysis requires 12 reduction steps, and C3 products require even more. These reduction steps are thought to appear as elementary proton-coupled electron-transfer reactions with similar energetics and scaling relationships that depend on active surface facets of the metal catalyst.13–15 These are hard to control or even analyse independently under relevant conditions.16 Understanding the reaction mechanism is crucial for two reasons: first, it shows what products are possible and whether they can be scaled up, and second it shows what reaction paths are responsible for these products so we can engineer systems to favour or disfavour them.
Many research studies have investigated the reaction mechanism computationally via ab initio studies15,17–19 and experimentally by identifying intermediates either via surface spectroscopy20,21 or by injecting supposed common intermediates as reactants into the system.22 However, most major advancements in understanding have occurred by detecting minor products because any complete reaction mechanism must account for them.3,4,23 Kuhl et al.'s study2 from 2012 is exemplary in this respect. It introduced NMR for sensitive detection of liquid products (detecting 16 different species) and derived the influential hypothesis of enol-like intermediates as main contributors in the mechanism.4,24
Therefore, analysing minor products enables researchers to derive practical information for the design of future reactors and catalysts. Understanding the eCO2R mechanism can help steer the reaction in the desired direction (e.g., by stabilising certain intermediates via surface ligands25) and avoid catalyst poisoning. While analytical methods for eCO2R products have improved, advances have mostly focused on time efficiency and operando capabilities.26,27 Introduced mass spectrometry methods are mostly based on “hard” ionisation that leads to a wide range of fragments and therefore have limitations in identifying unexpected products,28 but a few methods based on “soft” ionisation were used.29
In recent studies, Löffler et al. established proton-transfer reaction mass spectrometry (PTR-MS) with a time-of-flight (TOF) analyser as a way to precisely analyse the liquid products in real-time.29,30 In previous work, present authors applied PTR-TOF-MS to the gas outlet of a state-of-the-art flow cell to achieve accuracies so high that naturally occurring 13C isotopes could be measured confidently, and a kinetic isotope effect was described and quantified for the first time in such a system.31 For unambiguous product identification before the operando measurements, a gas-chromatography mass-spectrometry (GC-MS) setup was used. This experiment indicated the existence of a C4 species which warranted further investigation.
Applying GC-PTR-TOF-MS to a collected sample of eCO2R products allows product identification at unprecedented sensitivity. Using the gas outlet flow of a high-current GDE operating under high pH allows us to investigate the active mechanism under commercially relevant conditions, as prevalent reaction paths might substantially differ from those active in previously studied systems.32 Particularly the “reaction-driven changes in local environment” caused by large currents have a massive impact on cell behaviour but are missed by most fundamental kinetic studies.32 This study aims to observe and identify as many eCO2R products from the reduction of CO2via electrolysis as possible. By analysing selectivity trends across products' functional groups as well as the applied potential, we derive implications for the respective reaction paths active under significant current densities. Finally, we discuss existing and novel hypotheses regarding the eCO2R mechanism to confirm or reject them based on our observations and formulate new ones.
2. Methods
2.1 GC-PTR-TOF-MS
PTR-MS is a well-established method for monitoring volatile organic compounds in atmospheric samples.33 A PTR-MS instrument connects an ion source to a drift tube in which the primary ion (e.g., H3O+) reacts with an analyte based on its proton affinity. The analyser then detects the ions formed. This method achieves a high mass resolution (particularly in combination with a TOF detector),34 but a high concentration of analytes can deplete the primary ion resulting in clusters and fragments that lower the sensitivity and complicate identification.35 Hence, detecting low-concentration species in eCO2R product mixtures is challenging, as using strong dilution to mitigate depletion might lower concentrations under the detection limit. The combination with gas chromatography solves this, as analytes are separated and eluted one at a time. This effectively creates an ultra-sensitive GC-MS with “soft” ionisation in contrast to the typical “hard” electron impact ionisation with a less-accurate quadrupole sensor previously used for eCO2R product analysis.362.2 Electrochemical flow-cell
Our GDE is based on nanostructured copper deposited on carbon paper. Its preparation as well as the anode and electrochemical flow-cell setup has been described in detail in a previous article.37 For the gas inlet, CO2 of 99% purity was used with the flow-rate set to 50 sccm. For each experiment, electrolysis was performed at a constant potential applied vs. a Hg/HgO reference electrode. Seven runs were carried out with a controlled cell voltage with steps of 0.5 V from UHg/HgO = −2.0 V to −5.0 V. Each time, we ran the cell for 5 min before collecting a gas sample at the outlet and directing it to the measurement setup.Three additional experiments were carried out to verify the GC-MS setup and confirm our findings: one run was done with 13CO2 (99% isotope content) and one with inert gas N2, again using a copper-based GDE. A third run was done with conventional 12CO2 but using a cell without catalyst layer on the carbon paper. For these three additional experiments, current density was kept at 1.5 A cm−2, while inlet flow-rate and measurement protocol were adopted from the original experiments.
2.3 Experimental setup and measurements
Fig. 1 shows the experimental setup of this work. We directed the cell's outlet into a sampling loop of 1 ml followed by a gas chromatograph Agilent 7890 equipped with Hayesep D packed column (length of 6′). Nitrogen was used as a gas carrier. The outlet of the GC was connected to the inlet line of the PTR-TOF-MS, and the analyte was diluted with an additional 200 sccm of pure N2 before the drift chamber. The dilution prevented the MS detector from becoming saturated as some species were produced at high concentrations. The MS inlet line was heated and kept at 80 °C to avoid the memory effect observed in our previous work.31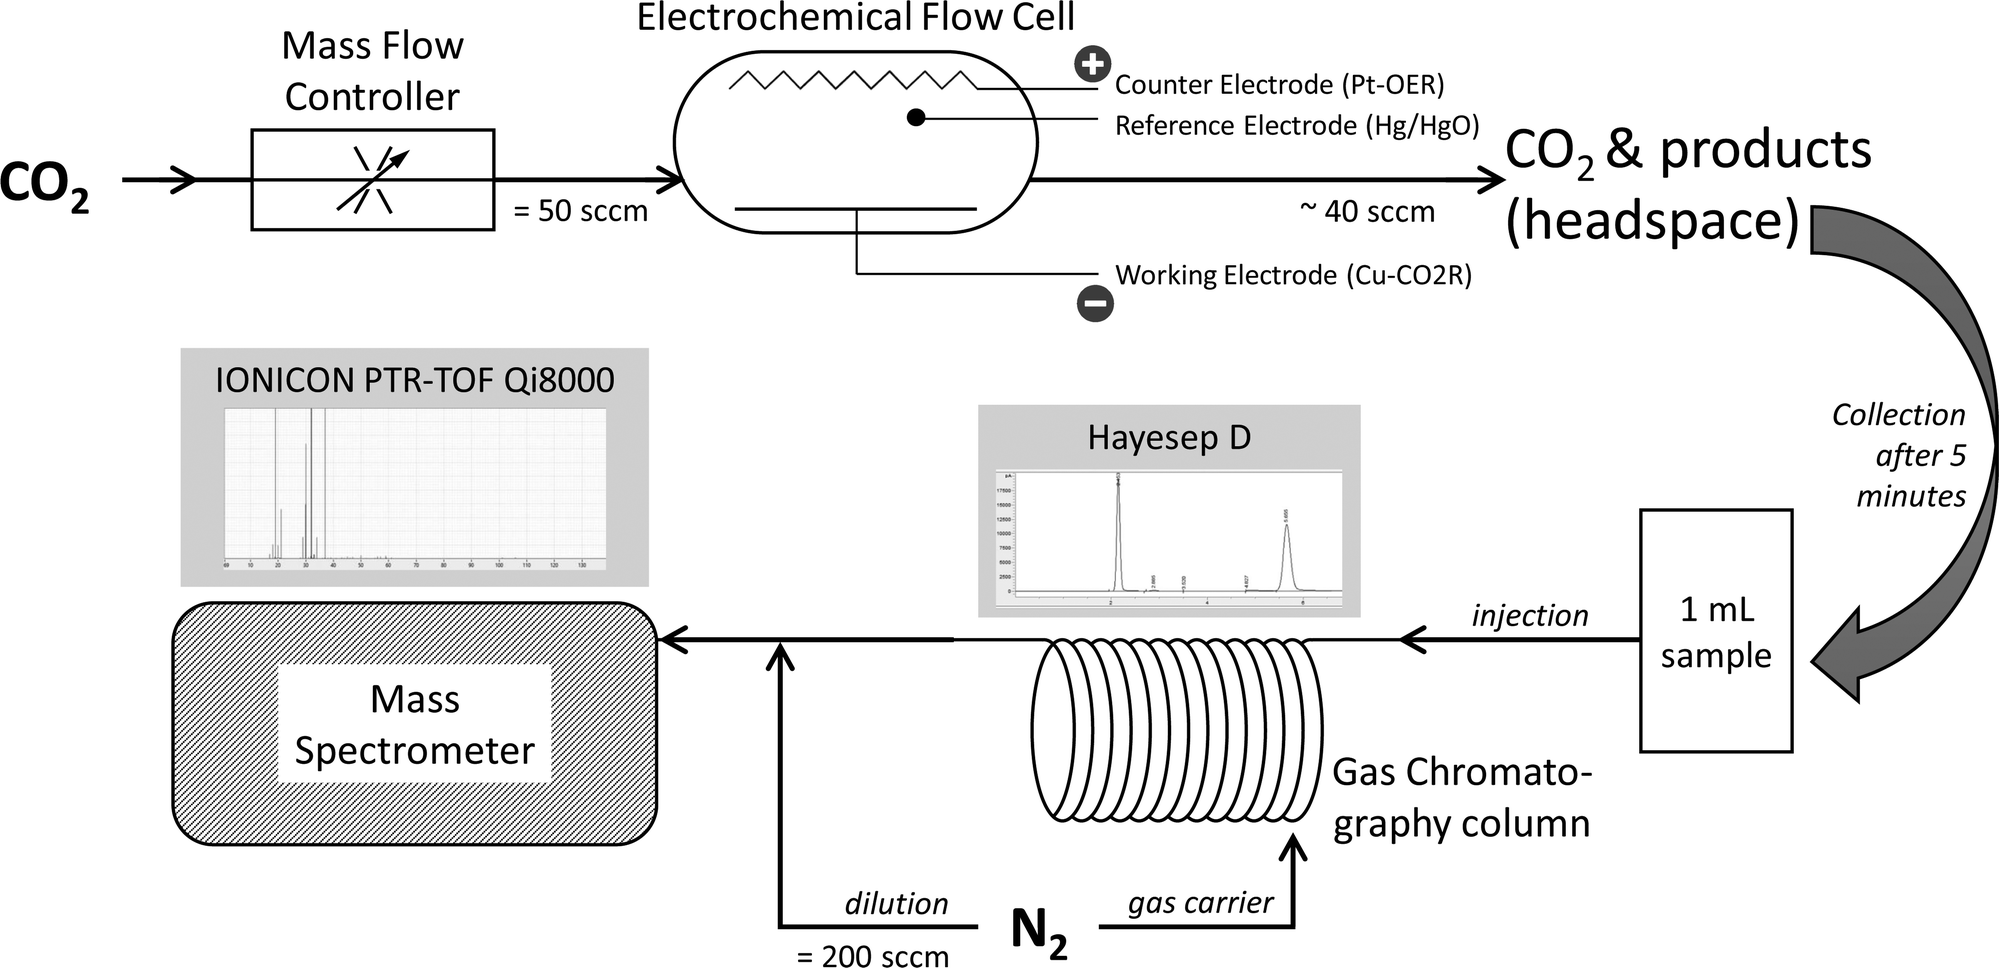 | ||
| Fig. 1 Schematic of electrochemical cell and GC-MS setup. | ||
We selected the GC conditions to maximise species separation in the selected column. The GC oven was programmed to separate light gases at a lower temperature of 80 °C, medium gaseous products at 130 °C, and the remaining species at 200 °C. The overall run was completed at t = 45 min after the injection of the sample. We utilised a PTR-TOF-MS Qi8000 from IONICON Inc (Austria) with multiple supply reactive ions tube, using H3O+ ions to ionise separated product species. The drift tube settings were found optimal at 114Td to achieve a good sensitivity and resolution of 3500 to 4100m/Δm.
2.4 Product identification and quantification
We identified eCO2R products based on retention times and ionisation spectra as shown in Fig. 2. To confirm the electrolysis of carbon dioxide as the species' origin and rule out contamination or measurement artefacts, we compared the ion chromatograms to the additional experiments with 13CO2 and N2. We used the experiment without copper catalyst as a reference to determine baseline signals. Based on these, peak areas for all resulting ions were computed as a measure of signal strength. Further product confirmation and especially discrimination between positional and stereoisomers was achieved by computing the ratios of these signals, tracking them across cell voltages, and comparing them to known values of standards. | ||
| Fig. 2 Extracted ion chromatogram for m/z = 57.070 Da (C4H9+ ion) from experiments at different applied potentials UHg/HgO compared to a reference measurement without copper-based catalyst. | ||
There is a lack of data on the precise reaction rate coefficients for proton transfer reactions with small organic compounds. As such, absolute quantification is bound to be flawed. However, as our study is focused on the mechanistic implications of minor products and their trends, and not cell performance assessments, we only need a relative measure for selectivity. Therefore, we introduce the concept of a relative faradaic efficiency as
 | (1) |
 is the integrated peak area of ion j at the retention time of species i and J is the average current density measured during electrolysis at cell voltage Uk.
Using the relative faradaic efficiency (rFE) has many advantages. First, it shifts the focus from absolute numbers, that depend on specific catalyst configuration (i.e., active surface sites), towards mechanistic information. Second, the qualitative trend across cell voltages is precise because we were able to compare the rFE of all resulting ions to verify a certain species and then pick the ion with the least uncertainty to represent that product. Finally, we can more effectively compare the curve shapes of different products as they all peak at 100%. This is especially helpful for these high-current cells as production of all species declines at a certain potential, making analysis of Tafel slopes less effective.
3. Results and discussion
3.1 Identified products
Table 1 lists the 23 different products of electrocatalytic CO2 reduction we identified via PTR-MS in the gaseous stream leaving the cell. At least ten of the products have never been reported before to the best of our knowledge. C1 and C2 products have been measured and described at length for eCO2R on copper-based catalysts. We detected no additional products of one or two carbon atoms in these experiments. Interestingly, we did not expect to observe methane as its proton affinity is much smaller than water's.38 However, the primary ion H3O+ in the drift chamber is not completely pure, and a small percentage of residual O2+ ions led to significant ionisation. The proton affinities of carbon monoxide and ethylene are also smaller than water's,38 but large concentrations led to some detectable protonation.| Species | # e− | # C | # O | Species | # e− | # C | # O | Species | # e− | # C | # O |
|---|---|---|---|---|---|---|---|---|---|---|---|
|
2 | 1 | 1 |

|
18 | 3 | 0 |
|
24 | 4 | 0 |
|
4 | 1 | 1 |

|
18 | 3 | 1 |

|
24 | 4 | 0 |

|
6 | 1 | 1 |

|
18 | 4 | 2 |

|
|||

|
8 | 1 | 0 | 24 | 4 | 0 | |||||

|
10 | 2 | 1 | ||||||||

|
12 | 2 | 0 |
|
20 | 4 | 2 |
|
24 | 5 | 2 |

|
12 | 2 | 1 | ||||||||
|
16 | 3 | 1 |

|
22 | 4 | 0 |

|
24 | 5 | 2 |

|
16 | 3 | 1 |

|
22 | 4 | 1 | ||||
|
16 | 3 | 1 |

|
22 | 4 | 1 |
|
30 | 5 | 0 |
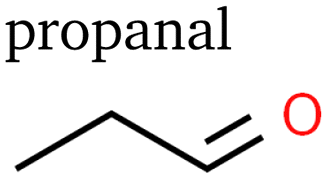
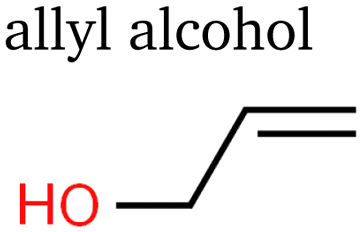
Despite Mandahl et al. previously identifying propylene as a minor product of eCO2R,39 it has only recently been reported as a minor product with a potentially significant production rate.10 In this study, we detected a relatively large signal of propylene, indicating absolute faradaic efficiencies about one order of magnitude below ethylene. Propanol has been extensively described before, as have the three detected isomers of C3H6O: propionaldehyde (propanal), acetone, and allyl alcohol.
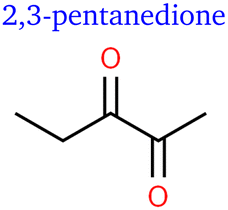
Interestingly, we also identified C4 and C5 products. While Calvinho et al. have previously formed a complex C4 product with catalysts based on transition metal phosphides,40 the mechanism for copper-based catalysts is very different and heavily favours C1 and C2 products. Apart from a small signal indicating the existence of butene in a former work of the present authors,31 none of these products have ever been reported to the best of our knowledge. The distinction of stereoisomers for butene and pentanedione is particularly novel.
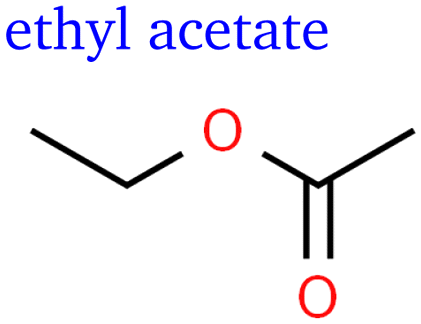
Apart from butene isomers shown in Fig. 2, we identified several oxygenated C4 species: the signals indicating C4H8O showed similar trends as the C3H6O species mentioned above. Partially based on analogy and the MS fingerprint of a standard, we identified butanal and butanone. Remarkably, we also observed two double-oxygenated species: butanedione and ethyl acetate, which is the only ester found so far. The variety of C4 products is particularly interesting considering the lack of studies on C4+ products and their potential for advancing our understanding of chain growth as pointed out in a recent perspective.16
For the first time, we report evidence of several C5 species as a product of electrocatalytic CO2 reduction. First, we identified pentene. In analogy to butene, we found a second peak, most likely representing the isomer 2-pentene. However, no quantifiable distinction of (stereo-)isomers was possible due to low concentrations. Moreover, we identified pentanedione with two well-separated and very distinct peaks differing only in intensity and fragmentation. The two isomers are thought to be 2,3- and 2,4-pentanedione respectively.
As interesting as the identified products are the ones absent in this study. Apart from methane, we detected no other hydrocarbons. This is easily explained by their very small proton affinities, which makes them detectable only at substantial concentrations by PTR-MS. In a previous study,31 Ren et al. detected ethane and propane by classic GC, and we expect them to be present also here at small concentrations. We could not detect carboxylic acids at the outlet line due to the large pH in the electrolyte, which causes them to be present as their conjugate base without entering the vapour phase. Therefore, we performed 1H NMR measurement at 60 MHz on a sample of catholyte after running the cell for 20 min and confirmed the presence of formate and acetate. Other than these, no double-oxygenated C2 and C3 species were found, in contrast to the study by Kuhl et al.2 One might attribute this to the small vapour pressure of liquid products and the focus of this study on the gas phase, but two facts speak against this: first, they were neither detected by our NMR measurements nor HPLC performed in the previous study;31 second, glyoxal has a sufficient vapour pressure and proton affinity to be detected in the gas phase by PTR-MS.41
3.2 Functional groups
The minor products we observed are mostly analogous species to more common products but with a longer carbon chain. Table 2 shows products sorted according to functional groups and thereby illustrates this for alkenes, ketones, and aldehydes. More interesting are the products that defy this trend in some way. One example is the diones (butanedione and pentanedione), which can only exist for C≥4, while most of the former studies have been focused on C≤3. There seems to be a shift away from ketones and aldehydes towards diones with growing carbon chains. This observation gives grounds for hypotheses regarding the reaction path: for example, the dimerisation of multi-carbon intermediates via preferable coupling between oxygenated carbon atoms is a sensible explanation. Butadiene falls into a similar category as the diones: it is the smallest conjugated diene possible. Since it is also the only diene reported so far, no trend can be observed - only the absence of a trend away from alkenes towards alkadienes with longer carbon chains.
|
The formation of alcohols also becomes less likely for longer carbon chains. This may be because alcohols are usually produced towards larger applied potentials compared to their ketone and aldehyde counterparts, while most products with longer carbon chains are favoured at smaller applied potentials. It also should be noted that we observe fewer species containing alcohol groups than in previous similar studies: we have not identified glycolaldehyde, hydroxyacetone, and butanol; we have not found glycols for any carbon chain length. The latter is not surprising as neither postulated double-oxygenated C2 species (glyoxal, ethylene glycol2) could be reproduced in our work. Since these products are the main reason to hypothesise enol-like intermediates as critical, this may have mechanistic implications for high-current GDEs. If we assume the initial dimerisation takes place between two oxygenated intermediates, at least one of the carbon–oxygen bonds seems to break very easily under these conditions – this could be driven by the alkaline environment as key steps have been shown to be pH-dependent,14,42 potentially causing our unique product distribution.
We will not discuss the carboxylic acids in much detail as they are not quantifiably detectable in the gas phase and seem to follow a different mechanistic logic that permits two oxygen atoms to bind to the same carbon. The simplest explanation is that there is a dimerisation before the breaking of the first C–O bond, as suggested by Shah et al.24 Alternatively, Garza et al. have proposed a ring closure mechanism that transfers oxygen between carbon atoms,4 even though it seems kinetically unlikely.43 Any species where one carbon atom is connected to two oxygen atoms faces a challenge of mechanistic explanation as either coupling occurred before the first dissociation of water (or related), external oxygen was incorporated as suggested before,44 or oxygen moved between carbon atoms via aforementioned ring closure mechanism.
The ethyl acetate detected in this study seems to also face this challenge but can be more readily explained by a coupling step of two oxygenated intermediates. The possibility of ethyl acetate production via secondary bulk reactions of eCO2R products still remains: the esterification of acetic acid and ethanol seems unlikely since it is generally catalysed by acids, but a disproportionation of acetaldehyde is possible since it is catalysed by alkoxides and acetaldehyde is abundant. However, ethyl acetate and acetaldehyde show very different behaviour in regards to potential dependence, which would be expected very similar for reactants and products of a non-electrochemical reaction. The same applies to other chemical reactions between common short-chain products that might be suspected as responsible for some of the C4 and C5 products. Furthermore, many of these reactions take place within much longer time scales under present conditions and would rather lead to double-oxygenated products that were not detected in this study. All corresponding functional groups were left out of Table 2 for the sake of simplicity. Furthermore, glycolaldehyde, as reported by Kuhl et al.,2 and acrolein, as reported by Kovalev et al.,37 are also missing.
3.3 Relative faradaic efficiencies
Fig. 3 shows the relative faradaic efficiencies of all products detected over the measured current density. Each measured point is indicated by a cross. A piecewise cubic interpolation is shown as a solid line going through the points. This is commonplace for comparison of potential dependence between products2,45,46 to guide the reader's eyes and help comprehend the selectivity trend of a single product as a whole. Nonetheless, they can introduce bias by implying trends where none exist and should be therefore studied with caution. For data points with a signal-to-noise ratio so large, it cannot be considered a peak with confidence, no measurement data is shown. Instead, the interpolation assumes zero. | ||
| Fig. 3 Relative faradaic efficiencies and empirical standard deviations of selected traces representing all detected products across the range of applied potential. From top to bottom, the different graphs show selectivity trends of (a) all pure hydrocarbons, (b) products containing alcohol groups, (c) products with end-chain carbonyl groups, and (d) products with mid-chain carbonyl groups respectively. | ||
Error bars shown for individual data points represent the empirical standard deviation based on the uncertainty of calculated peak areas used in eqn (1). For this reason, they constitute a rough estimate for lower bounds of uncertainties regarding repeatability. Uncertainties for some of the data points are considerably larger than for others. There are two reasons for this: firstly, all integrated signals are shown relative to their maximum value of 100%, which amplifies the uncertainties of signals with smaller absolute intensities. Secondly, to calculate a measure of relative faradaic efficiency, all data were normalized by current density, which pronounces uncertainties at smaller applied potentials. These effects lead to specifically large standard deviations for species detected with small absolute signals at small applied potentials, e.g. for carbon monoxide and formaldehyde.
Species were clustered into four different groups based on their functional groups. This makes it easier to track the large number of species. It also serves as a starting point for a discussion of the reaction mechanism, as similar or complementary selectivity trends can indicate common reaction paths, intermediates, and rate- or selectivity-determining steps.
Some of the trends the products exhibit are unexpected: for example, the butene isomers 1-butene and 2-butene show trends almost opposite of each other. The differences in selectivity trends between alcohols, aldehydes, and ketones are also much larger than expected, as current efficiencies reported by Kuhl et al.2 showed very similar trends and peak efficiencies across all products apart from C1 species. Another unexpected finding is the large rFE level of some products at high currents well beyond 1 A cm−2, implying ongoing competition between CO2 reduction and hydrogen evolution (HER). Some products seem to have two local maxima of faradaic efficiency for different applied potentials – this can be seen most prominently for ethanol. Moreover, a general trend exhibited by many of the products is noteworthy: similar products with different lengths of the carbon chain always show peak selectivities at smaller applied potentials for the longer chains than the shorter chains. This is especially apparent comparing aldehydes, ketones, and diketones of C3 and C4 type. It implies a larger coverage of intermediates that are responsible for coupling at smaller applied potentials, suggesting less-reduced intermediates for coupling steps. The widely accepted hypothesis of either *CO or *CHO17,18,47 intermediates as C1 coupling intermediates is in agreement with this observation. This trend is consistently observed for C2+ products.
In the top graph of Fig. 3, it becomes apparent how different the behaviours of pure hydrocarbons (mostly alkenes) are – even between positional isomers, as mentioned before. It further indicates that alkenes can be put into one of two categories for the most part regarding their trend curve of rFE. The stark differences between those two categories indicate a fundamental difference in the governing reaction mechanism – most likely already on the level of initial coupling. For the production of ethylene, the existence of two independent reaction paths has been established before19,22 – one at lower applied potentials via the coupling of an oxygenated intermediate and one at larger applied potentials sharing an intermediate with methane. The curve of ethylene's rFE hints at this behaviour by exhibiting a peak stretched from small to medium currents and still showing significant production (especially in absolute terms) for large currents. Propylene shows a qualitatively similar behaviour with less pronounced selectivity for larger currents, indicating a smaller likelihood of production via the second pathway. Meanwhile, 2-butene does not show any indication of a second high-potential pathway as its rFE curve is similar to that of carbon monoxide. In contrast, 1-butene and 1-pentene only show behaviour coinciding with methane production, therefore indicating the high-potential pathway as the exclusively governing mechanism.
Taking a closer look at the two middle graphs of Fig. 3, methanol behaves similarly to formaldehyde, indicating a common reaction path. This is expected, as Schouten et al. showed feeding CH2O produces CH3OH.22 This reaction path could also explain the small amounts of methane produced for small to medium applied potentials which is supported by formaldehyde production continuing at larger currents and methane showing a first local maximum at medium currents. Aldehydes have been suggested as precursors for alcohol (sharing a reaction path) for C2+ as well, but in Fig. 3 acetaldehyde, propanal and butanal behave quite differently than their alcohol counterparts, while the behaviour of methanol does not indicate a large activation barrier for the reduction of a carbonyl group. However, this does not disprove the aforementioned hypothesis, as this might depend on neighbouring carbon atoms and functional groups present in C2+ species.
3.4 Mechanistic implications
Based on the identified products and analysed selectivity trends, we can derive implications for the reaction paths. Combining these with the findings regarding intermediates and common pathways reported in other publications,3,22,24 we can postulate reaction mechanisms based on experimental findings alone. In this work, we limit our discussion of the mechanism to a few very clear trends of products' rFE. General trends of maximum faradaic efficiency reached at small or large applied potentials point towards major differences on the level of coupling. The more intricate variations point towards splitting pathways at a later stage.When discussing mechanism implications, we must remember that while shared markers (e.g. similar rFE curve) between two products can point towards a shared reaction path, it is not imperative. Not only can independent reaction paths show similar potential dependence, completely different (non-kinetic) effects might as well: larger current densities for example cause significant CO2 depletion close to the catalyst surface and with mass transport now limiting the reaction, reduction steps might be favoured over coupling steps. Even though this is not a kinetic cause of potential dependence in the narrow sense, it does have implications on the de facto mechanism active under commercially relevant conditions and is therefore included in this analysis.
It is also worth noting that the failure to detect a certain product which is hypothesised to be a key intermediate in its adsorbed form does not necessarily disprove the hypothesis. For example, we did not find any glyoxal, but this does not mean that **CHOCHO is not an intermediate on the main reaction path, as the desorption equilibrium might be fully on the side of the adsorbed state or the subsequent reduction step is so fast that almost no **CHOCHO exists on the surface.
Based on the general trends in functional groups and rFE stated above, we derive our first hypothesis. As we do not observe any double-oxygenated species for C<4 and generally no more than two oxygen atoms in a single species, we conclude that at least one C–O bond is rapidly broken after the first coupling, assuming the coupling happens between two single-oxygenated C1 intermediates. For C≥4 products, double-oxygenated products are present, and we observe a trend from single- to double-oxygenated products of which different structural isomers share the same selectivity trends. Therefore, we speculate that these are formed via the coupling of the same single-oxygenated C2–C3 intermediates, where position and direction determine the eventual isomer. The general trend of rFE peaks for longer carbon chains moving towards smaller voltages strengthens this hypothesis because we would expect these peaks to coincide if chain growth was driven by the continuous addition of a single C1 intermediate. Following this logic, the coverages of C2 and C3 coupling intermediates seem to peak at smaller applied potentials than that of the C1 coupling intermediate. After the coupling of these to double-oxygenated C4 or C5 intermediates, the breaking of the C–O bond seems to be less promoted than for its C2 and C3 counterparts.
Table 2 indicates the most common functional groups in the products are the double bonds in alkenes, hydroxy groups in single primary alcohols, and carbonyl groups in ketones and aldehydes. Therefore, understanding the commonalities and differences in the reaction paths leading up to these products is particularly important and discussed in detail hereafter.
As mentioned before, butene isomers seem to rely on different mechanisms. Fig. 4 elucidates the selectivity behaviour of 1-butene as similar to methane and 1-pentene, whereas 2-butene behaves similarly to butadiene and carbon monoxide. This points to different modes of achieving double bonds: via the coupling reaction of a highly-reduced intermediate (1-butene, 1-pentene) and via water dissociation after coupling of oxygenated intermediates (2-butene, butadiene). Moreover, the existence of diones and esters suggests that at least some coupling reactions take place between two oxygenated monomers. Purely based on their structure, ethylene and propylene could be produced via either of these modes; this actually seems to be the case as their rFE curves exhibit a hybrid behaviour: peak selectivity is reached at small currents similar to the curves in the bottom graph of Fig. 4, but does not decline as rapidly. Instead, we can see a plateau around J ≈ 0.8 A cm−2 coinciding with the first increase of methane and 1-butene, before decreasing to a constant value even for large currents.
 | ||
| Fig. 4 Comparing selectivity trends of different alkenes with C1 products that might share common intermediates. The top graph (a) compares rFE of all identified alk-1-enes with methane, the bottom graph (b) compares rFE of specific C4 alkenes with carbon monoxide. | ||
This hypothesis corresponds with the two-pathway theory put forward by Luo et al.19 and recently assessed within a microkinetic model43 for Cu(100) surfaces: towards ethylene production, *CHO–*CHO coupling is dominant for smaller applied potentials (leading to aldehydes as well as alk-2-enes), while *CH2–*CH2 coupling is dominant for larger applied potentials (leading to alk-1-enes). We extend this theory to include all produced alkenes and discriminate between positional isomers: while a low-potential pathway of successive coupling of oxygenated intermediates leads to the formation of alk-2-enes, a high-potential pathway leads to alk-1-enes by addition of a highly-reduced intermediate. In contrast to the purely kinetic effect of shifted reaction equilibria and lowered activation barriers that has been observed for ethylene production in low-current cells, elevated potentials in high-current GDEs have a second effect: lowered CO2 availability at the catalyst surface intensifies formation of highly-reduced C1 intermediates as the probability of early coupling decreases with surface coverage of eCO2R intermediates. In fact, the aforementioned plateaus of rFE around J ≈ 0.8 A cm−2 might indicate that shift from a high- to a low-coverage regime in regard to carbon-based surface intermediates. While mass transport is already limiting, surface coverages seem to reach a point after which no oxygenated product shows any increase in rFE.
Within 2-butene, we can distinguish the cis and trans form, and the selectivity trends even differ slightly, as shown in the bottom graph of Fig. 4, yet not as fundamentally as the positional isomers. This could be the result of very similar reaction paths that only branch at the very end, as proposed in Fig. 5. Based on the homogeneous coupling of a C2 intermediate that might be an acetaldehyde or ethylene precursor, the two stereoisomers are produced based on the order the carbon atoms are hydrogenated. Based on the respective selectivity trends, the initial hydrogenation of a *CH2 group seems to be preferred over hydrogenation of less-reduced mid-chain carbon atoms only at an increased voltage (leading to cis-2-butene). This 2-butene pathway relies on the prior hydrogenation of a carbonyl group to a hydroxy group and finally dissociates water in such a fashion that the freed electron initiates a double bond with the neighbouring carbon atom towards the middle. Even if this neighbouring carbon atom is also oxygenated, its hydrogenation will most likely not lead to a second double bond as allenes are unstable.
 | ||
| Fig. 5 Suggested mechanism from common intermediate towards butadiene and 2-butene stereoisomers. | ||
This hypothesised mechanism could also explain the relative faradaic efficiency curve of butanedione, which is shifted to significantly higher currents as it would require –CH2 hydrogenation at both ends of the first intermediate after the coupling step shown in Fig. 5. Similar subsequent hydrogenation steps would be necessary to form ethyl acetate if the coupling occurs between carbon and oxygen rather than carbon and carbon. This would explain the similar selectivity trends of ethyl acetate and butanedione shown in Fig. 3 and is a much more likely mechanistic explanation than the disproportionation of acetaldehyde as peak rFE would be expected at substantially smaller currents. At this point, the reader needs to be reminded that the suggested mechanism shown in Fig. 5 is solely based on observed selectivity trends, prior mechanistic studies, and combinatorial analysis. The intermediates shown represent one possible manifestation of more general hypotheses derived in this work as individual structures cannot be verified in isolation from the remaining mechanism.
Butadiene behaves similarly to 2-butene, seemingly contradicting the hypothesis around the formation of mid-chain and end-chain double bonds. It can be explained along similar lines: if the reduction of a double-oxygenated C4 intermediate leads to the formation of a double bond towards the end rather than the middle of the chain, the second oxygen splitting is free to also lead to a double bond at the other end of the chain. This is not possible if the first oxygen splitting leads to double bond formation in the middle of the chain, as allenes are sterically improbable. While the order of hydrogenation matters for the 2-butene stereoisomers, the butadiene structure does not depend on it.
This analysis now provides further insights into the coupling mechanism for the production of all alkenes – including ethylene and propylene. For smaller applied potentials, symmetrical coupling of oxygenated intermediates leads to the formation of double bonds in the middle of the carbon chain. The trends of aldehydes' faradaic efficiencies largely coincide with those of the formerly discussed alk-2-enes which supports this hypothesis. For larger applied potentials, asymmetrical coupling of a highly-reduced intermediate forms a double bond at the end of a carbon chain. Based on the experimental findings of Schouten et al.7 on single-crystal electrodes, the coupling of oxygenated intermediates takes place on (100) and (111) facets while the addition of a highly-reduced intermediate is almost exclusive to (100). This means that catalyst nanomaterials could be engineered to prefer either alk-1-enes or alk-2-enes based on the ratios of active facets. This proposed asymmetric coupling mechanism does neither imply a Fischer–Tropsch style chain growth nor an analogous CO insertion mechanism as suggested by Hori et al.48
According to the hypothesis for alk-2-ene production illustrated in Fig. 5, we suspect double bonds in alk-2-enes form via mid-chain carbonyl groups. If the intermediate preceding the splitting of reaction paths would be hydrogenated at one of the –CH2 groups instead of the carbonyl group first, it would form a ketone. As mentioned before, we suspect these hydrogenation steps to be preferred at more elevated applied potentials. Indeed, relative faradaic efficiencies of ketones appear generally shifted towards larger currents in Fig. 6. Note that the selectivity trends shown are not just two different curves with deviating peaks, they appear complementary as a decrease of the alk-2-ene's rFE coincides with an increase of ketone's rFE and a plateau coincides with a plateau.
 | ||
| Fig. 6 Relative faradaic efficiencies of alk-2-enes and ketones in comparison. The top graph (a) shows selectivity trends of corresponding C3 products and the bottom graph (b) of C4 products. | ||
A similar observation can be made for aldehydes and primary alcohols in Fig. 7, which we suspect share a common reaction path as well. This is a common hypothesis for C2 (acetaldehyde and ethanol respectively), confirmed by multiple observations.22,30,49 As relative faradaic efficiencies for alcohols appear generally more shifted towards larger currents, we speculate it follows a pathway with a larger reaction barrier starting at the same intermediate. This makes logical sense as alcohols need additional reduction steps before desorbing – mainly the hydrogenation of the end-chain carbonyl group.
 | ||
| Fig. 7 Relative faradaic efficiencies of aldehydes and primary alcohols in comparison. The top graph (a) shows selectivity trends of corresponding C2 products and the bottom graph (b) of C3 products. | ||
It needs to be pointed out that many of the described trends and their hypothesised causes (purely kinetic or other) overlap. Pentanedione, for example, contains two ketone groups that are formed at slightly elevated potentials according to one of our hypotheses. This is only evident in contrast to the formation of double bonds as shown in Fig. 5 though and no C5 diene was observed for such comparison. At the same time, the formation of longer carbon chains being disfavoured at heightened potentials comes into play. For this reason, we can observe pentanedione's rFE peak at similar current densities as acetaldehyde in Fig. 3 and still attribute its formation to a general reaction pathway of ‘elevated potential’.
3.5 Full mechanism schema
We formulated different hypotheses to account for the identified products and synthesized them to form a coherent reaction schema which is illustrated in Fig. 8. Products are ordered by their level of reduction because coupling must occur “before” the least-reduced product of a common path. Furthermore, we expect coupling after the first oxygen dissociation3 – for this, no incorporation of outside oxygen needs to be assumed, notwithstanding recent challenges to that notion.44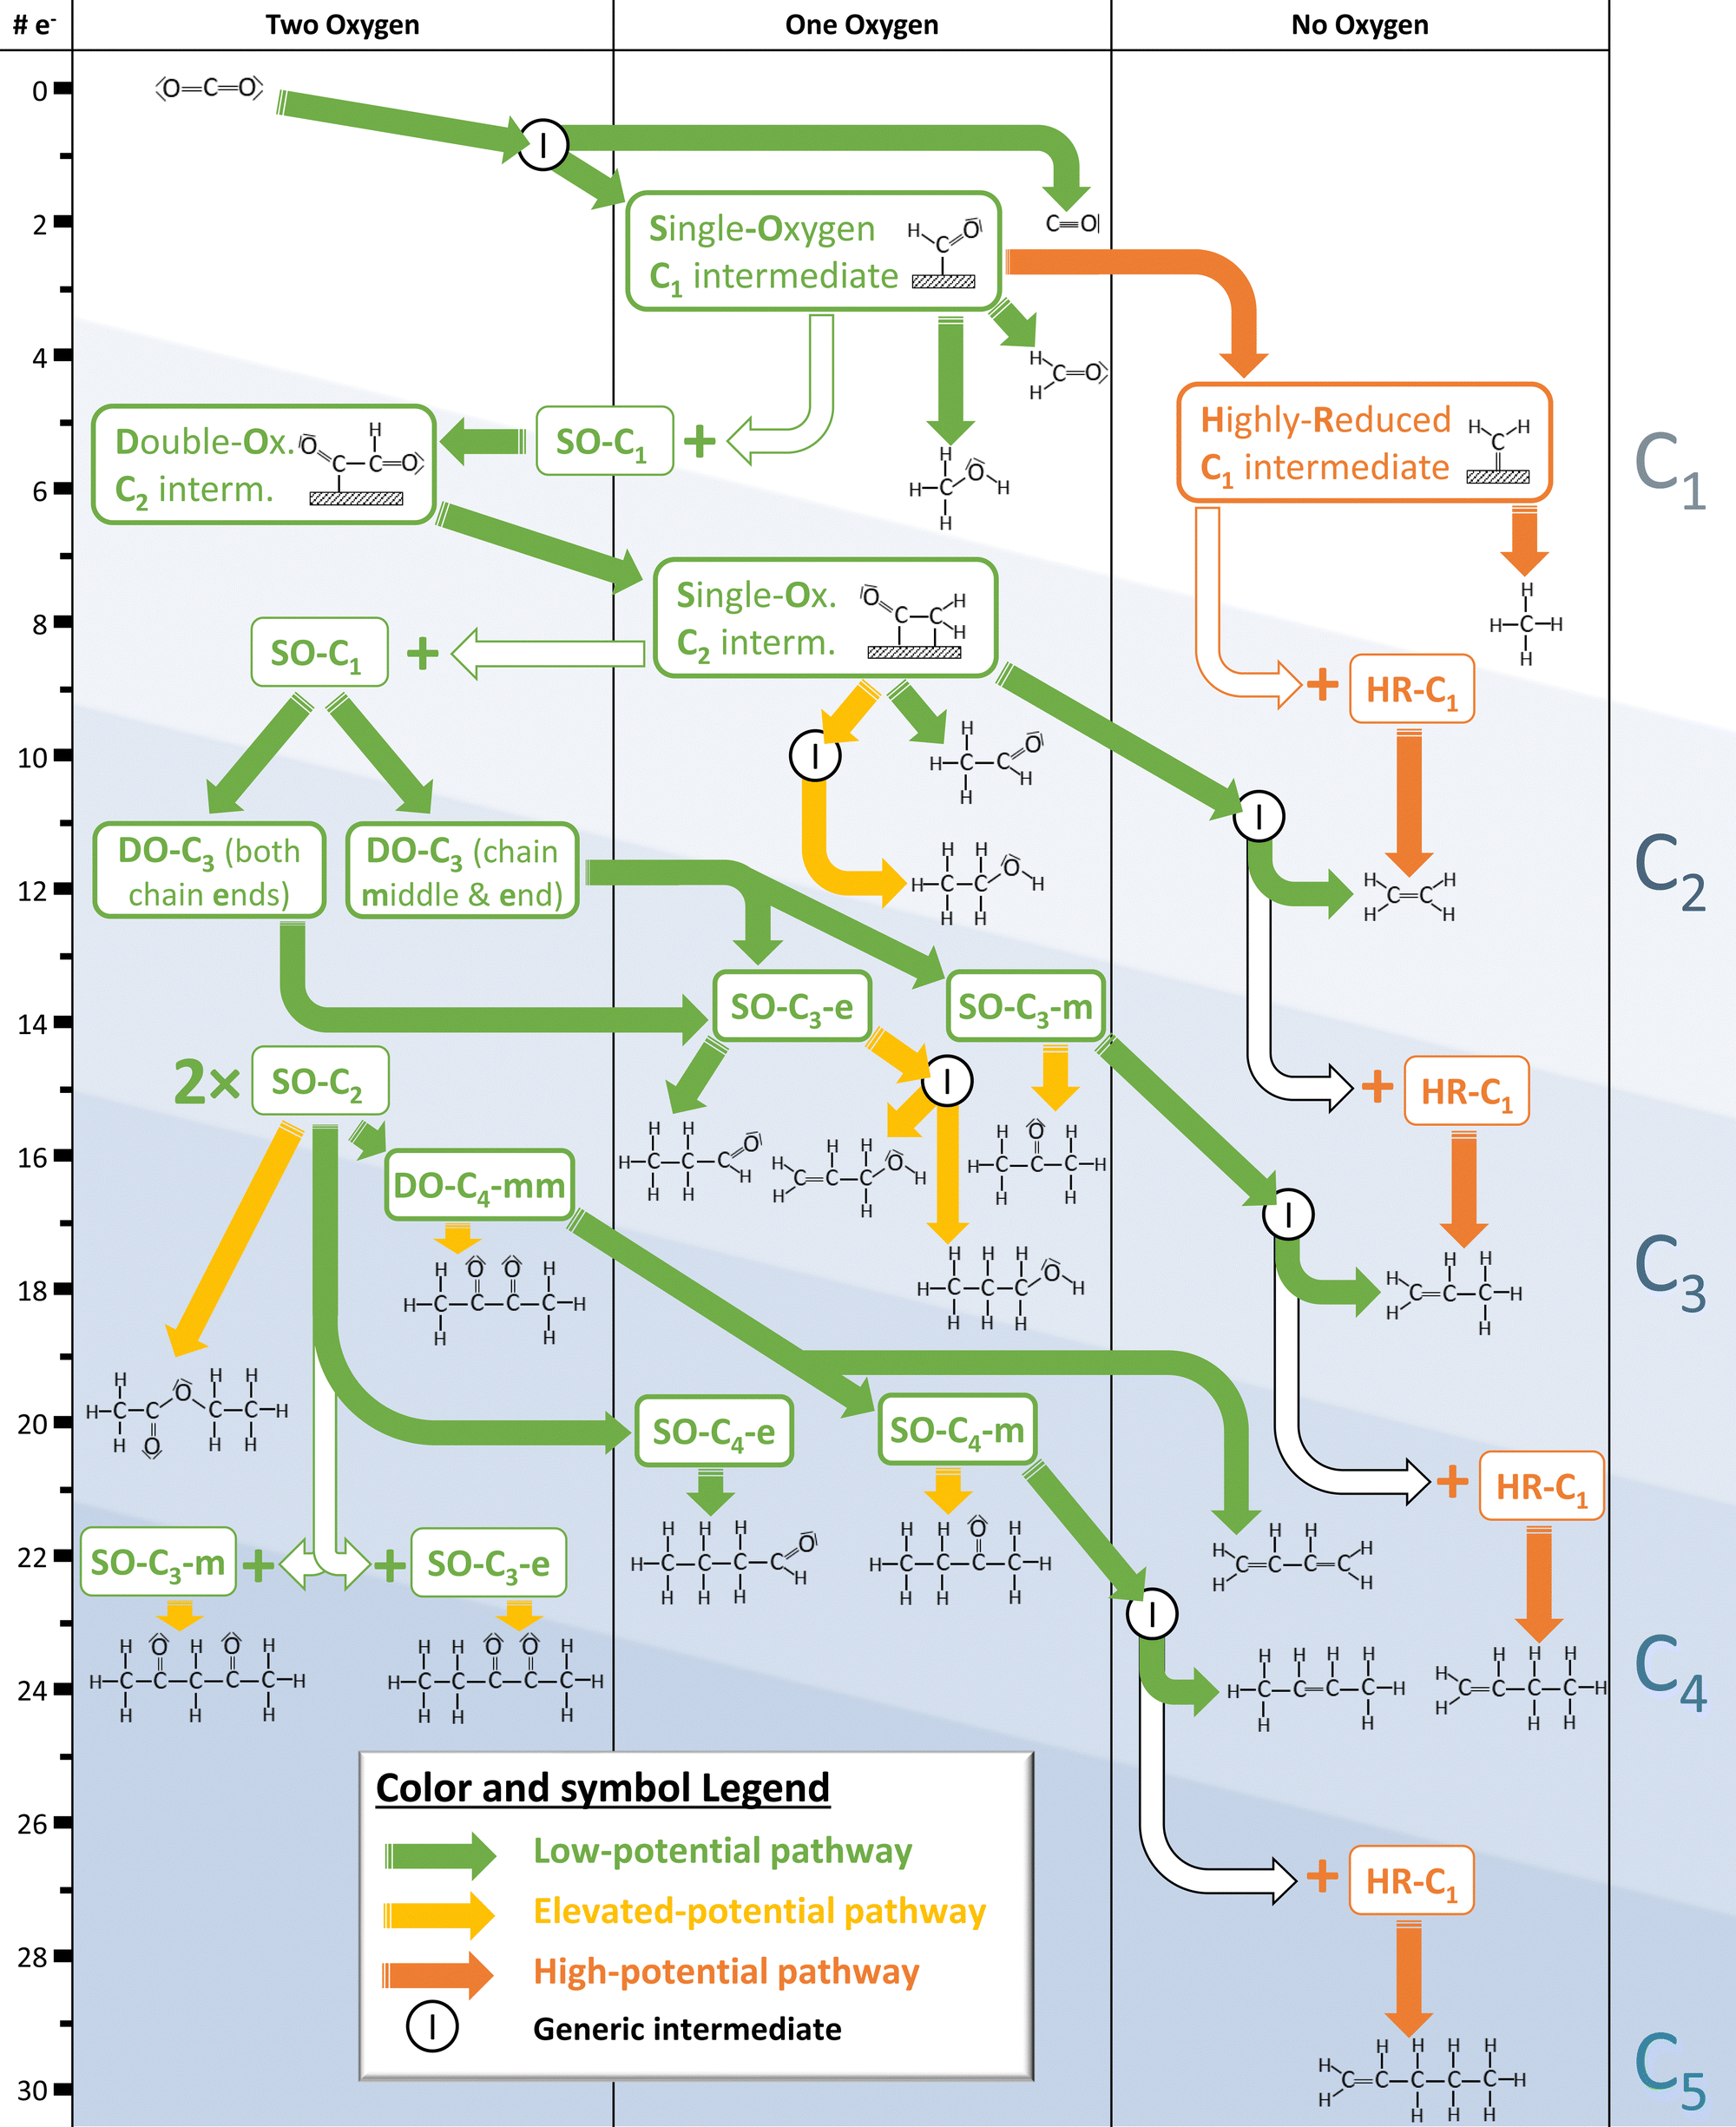 | ||
| Fig. 8 Overview of identified electrocatalytic CO2 reduction products, supplemented by the reaction mechanism hypothesized in this study and likely key intermediates. Names given for suspected intermediates are based on reduction state (highly-reduced vs. single- or double-oxygenated), chain length (C1–C5), and position of oxygen if applicable (mid-chain vs. end-chain). The separation by number of carbon and oxygen as well as number of electrons transferred makes this graph a useful template for further mechanism discussion in the form established by Nitopi et al.3 | ||
This depicted mechanism is intentionally kept abstract for several reasons. As mentioned before, we do not make statements about the actual structure of intermediates but more generally their chain length and possible functional groups. Moreover, this work is supposed to provide a holistic picture and the opportunity to extend it, as some effects cannot be reasonably deconvoluted; for example, surface morphology is known to affect kinetics significantly.13–15 The same applies to the entangled potential dependence effects via mass transport and via kinetics of electrochemistry. Finally, the classification into three types of general mechanistic pathways are not to be taken as absolute because transitions are fluid (e.g., pentanedione as discussed above).
Most of the proposed eCO2R mechanisms rely on the assumption of coupling steps being rate- and selectivity-determining4,18,23,50 as do the hypotheses formulated in this study. We find the degree of reduction of C1 intermediates before coupling to be key. While there is an ongoing discussion around the C1 intermediate responsible for dimerisation at small applied potentials,42,51,52 our proposed reaction paths are satisfied by postulating any single-oxygenated C1 intermediate. As a second main contributor for larger applied potentials, we also postulate a non-oxygenated, highly-reduced C1 intermediate (most likely *CH2) in agreement with recent studies.19,43
We hypothesise most products are formed by initial coupling via the low-potential pathway. We believe the double-oxygenated C2 intermediate resulting from the coupling is quickly reduced to break at least one of the C–O bonds as no double-oxygenated products for C<4 are detected. The resulting single-oxygenated C2 intermediate can couple again with other single-oxygenated intermediates or be further reduced via respective paths with different activation barriers. This way, a pattern emerges for ever-longer carbon chains. For C4+ formation, we speculate the coupling takes place between two of these single-oxygenated multi-carbon intermediates followed by less immediate C–O bond breaking and concurrent production of double-oxygenated species. We speculate the coupling reactions are driven by interactions between more oxidised carbon atoms, explaining the higher prevalence of mid-chain oxygen for C4 and C5.
According to our hypothesis, further reduction of single-oxygenated intermediates depends mostly on the position of the oxygen: While mid-chain oxygen leads to the formation of alk-2-enes or alkadienes as illustrated in Fig. 5, end-chain oxygen leads to aldehydes if the electrochemical cell is operated at low currents. Increasing potentials favour different reaction paths of these single-oxygenated intermediates, further reduction of end-chain oxygen leading to alcohols and a different sequence of hydrogenating mid-chain oxygen leading to ketones.
Chain-end oxygen generally seems to lead to a wider variety of less-reduced products. For example, the double-oxygenated C3 intermediate with oxygen on both chain ends can be assumed a precursor also to acrolein, following the established framework. Polymerizing acrolein has been demonstrated as a failure mechanism of copper-based GDEs37 so stabilizing mid-chain oxygen over end-chain oxygen could be a way to increase longevity of GDEs. This might be achieved by topological engineering as selectivities and overall activity of eCO2R are significantly determined by surface facets and respective binding energies.36,53 If the applied potential is increased beyond a certain point, the coverage of oxygenated intermediates declines as highly-reduced intermediates begin to dominate. The coupling of abundant highly-reduced C1 intermediates with another multi-carbon intermediate explains the increased production of alk-1-enes. At this point, HER is expected to start dominating eCO2R.
4. Conclusions
In summary, we analysed the hydrocarbons produced via electrocatalytic CO2 reduction on copper within a gas-diffusion electrode using a GC-MS with a high-resolution PTR-TOF-MS. We identified more than 20 distinct products – confirming 10 hitherto unknown ones, including multiple C5 species. The product separation in the GC column allowed us to identify minor products and closely related isomers that are hard to distinguish with conventional mass spectrometry. Meanwhile, the proton-transfer reactions led to a large number of different secondary ions and fragments that could be analysed by the high-resolution time-of-flight sensor with high accuracy. This helped us to identify and quantify products.By carefully post-processing and integrating the measured intensities, we were able to compare signals across different experiments within the same ion and species. We established a relative measure for faradaic efficiency and verified the trends between different secondary ions of the same species. Developing these relative faradaic efficiencies across different applied potentials revealed selectivity trends of the different species that can be grouped by the shape of their curves. This helped investigate the complex eCO2R mechanism that accounts for the map of identified products, considering reduction levels and the number of carbon as well as oxygen atoms.
We derived three key hypotheses based on careful observations and a few largely accepted assumptions. These extend our partial understanding of the eCO2R mechanism for high-current GDEs at high pH as constructed in Fig. 8. In addition, Fig. 9 summarises and illustrates the main hypotheses in a more abstract manner. The herein described potential dependence of the mechanism does not only include its effect on reaction rates and equilibria, but also its second-order effect on CO2 availability at high currents.
 | ||
| Fig. 9 General hypotheses regarding the eCO2R mechanism. | ||
The first and most important hypothesis details the mechanism of the two distinct pathways towards ethylene which have been acknowledged in many previous studies. We postulate reaction steps for forming double bonds either on the ends or the middle of the carbon chain depending on applied potentials. The low-potential pathway is based on the coupling reaction between oxygenated intermediates (e.g., *CHO) and the subsequent formation of double bonds towards the centre of the molecule via the dissociation of water. The high-potential pathway is based on the addition of a highly-reduced, non-oxygenated intermediate (e.g., *CH2) to the end of a molecule, immediately forming a double bond. This hypothesis is firstly supported by selectivity trends of 1-butene and 1-pentene coinciding with that of methane, as the highly-reduced intermediate would be its precursor, and only C4+ species develop pure alk-1-enes. Secondly, the selectivity trend of trans-2-butene coincides with that of carbon monoxide and formaldehyde, as the initial oxygenated intermediate would be its precursor. The selectivity trends of the well-known products ethylene and propylene exhibit a mixture of both trends as they can form by either of the two mechanisms – reaching peak faradaic efficiency at small applied potentials that are not decreasing sharply with larger potentials but rather converging to a constant production level even for large currents.
The second hypothesis states that all other oxygen-containing products likely form by a similar mechanism of initial coupling via an oxygenated C1 intermediate but are not fully reduced to pure hydrocarbons. The dissociation of the first oxygen is rapid for the C2 and also the C3 intermediate, which is thought to be formed by iterative coupling with the same oxygenated C1 intermediate. These single-oxygenated intermediates can now couple again, forming C4 and C5 products. The orientation of coupling intermediates and the sequence of subsequent reduction steps are critical as they decide the position of oxygen. Based on mid- or end-chain oxygen intermediates, ketones, aldehydes, and alcohols are produced. The third hypothesis concerns the potential-dependence of different product types with a common oxygenated multi-carbon intermediate. While mid-chain oxygen leads to the formation of mostly alk-2-enes at very small voltages, as stated in the first hypothesis, elevated potentials lead to increased ketone production. This is most likely caused by a different sequence of hydrogenation steps. Intermediates with end-chain oxygen mostly form aldehydes at small voltages, but the further reduction to primary alcohols becomes more prevalent with elevated potentials. It is unclear if further-reduced multi-carbon intermediates similar to the methane precursor play a role in forming these (especially unsaturated) alcohols.
In conclusion, we monitored minor C3–C5 products to reveal significant and generalisable insights into the eCO2R mechanism. We found that positional isomerism in intermediates is particularly important for product selectivity. This is most apparent for alkenes but also for aldehydes and ketones. As most of consequential isomerisms only start to exist for C3–4 species, longer-chain products play a critical role as mechanistic indicators.
The presented data is by no means exhausted with the discussion in this work. Further utilisation of the results by other researchers is possible and encouraged. Especially the mechanism discussion, which is an ongoing and disputable subject, can be complemented by the comprehensive map provided in Fig. 8. Further studies investigating some of the more obscure species and trends found in this work are needed. Understanding the underlying mechanism of eCO2R on a first-principle basis is critical for the design and optimisation of CO2 utilisation processes. These processes are in turn essential to mitigate climate change as negative emission technologies will be necessary to achieve the goals set out in the Paris climate agreement.1 Moreover, they could convert the hard-to-decarbonise sector of chemicals into a negative emissions sector, because CO2 would be captured and effectively stored in a variety of products that are at present produced from fossil resources.
Author contributions
S. D. Rihm conceptualized the analytical part of the study, developed methodology and software for data analysis, wrote the original draft of manuscript, and revised manuscript. M. K. Kovalev developed measurement methodology, performed experiments, and validated data. A. A. Lapkin acquired funding and administered project. J. W. Ager acquired funding, helped conceptualize the study, administered project, and reviewed manuscript. M. Kraft acquired funding, provided resources, supervised the mechanistic study, and revised the manuscript.Conflicts of interest
There are no conflicts to declare.Acknowledgements
This work was supported by the National Research Foundation (NRF), Prime Ministers Office, Singapore under its Campus for Research Excellence and Technological Enterprise (CREATE) programme through the eCO2EP project operated by Cambridge Centre for Advanced Research and Education in Singapore (CARES) and the Berkeley Education Alliance for Research in Singapore (BEARS). S. D. Rihm acknowledges financial support from Fitzwilliam College, Cambridge, and the Cambridge Trust. Part of this work was supported by Towards Turing 2.0 under the EPSRC Grant EP/W037211/1 and The Alan Turing Institute. M. Kraft gratefully acknowledges the support of the Alexander von Humboldt Foundation.Notes and references
- S. E. Tanzer and A. Ramírez, Energy Environ. Sci., 2019, 12, 1210–1218 RSC.
- K. P. Kuhl, E. R. Cave, D. N. Abram and T. F. Jaramillo, Energy Environ. Sci., 2012, 5, 7050–7059 RSC.
- S. Nitopi, E. Bertheussen, S. B. Scott, X. Liu, A. K. Engstfeld, S. Horch, B. Seger, I. E. Stephens, K. Chan, C. Hahn, J. K. Nørskov, T. F. Jaramillo and I. Chorkendorff, Chem. Rev., 2019, 119, 7610–7672 CrossRef CAS PubMed.
- A. J. Garza, A. T. Bell and M. Head-Gordon, ACS Catal., 2018, 8, 1490–1499 CrossRef CAS.
- Y. Kwon, Y. Lum, E. L. Clark, J. W. Ager and A. T. Bell, ChemElectroChem, 2016, 3, 1012–1019 CrossRef CAS.
- R. Kas, R. Kortlever, H. Yilmaz, M. T. Koper and G. Mul, ChemElectroChem, 2015, 2, 354–358 CrossRef CAS.
- K. J. P. Schouten, Z. Qin, E. P. Gallent and M. T. Koper, J. Am. Chem. Soc., 2012, 134, 9864–9867 CrossRef CAS PubMed.
- F. P. García de Arquer, C. T. Dinh, A. Ozden, J. Wicks, C. McCallum, A. R. Kirmani, D. H. Nam, C. Gabardo, A. Seifitokaldani, X. Wang, Y. C. Li, F. Li, J. Edwards, L. J. Richter, S. J. Thorpe, D. Sinton and E. H. Sargent, Science, 2020, 367, 661–666 CrossRef PubMed.
- C. T. Dinh, T. Burdyny, G. Kibria, A. Seifitokaldani, C. M. Gabardo, F. Pelayo García De Arquer, A. Kiani, J. P. Edwards, P. De Luna, O. S. Bushuyev, C. Zou, R. Quintero-Bermudez, Y. Pang, D. Sinton and E. H. Sargent, Science, 2018, 360, 783–787 CrossRef CAS PubMed.
- G. O. Larrazábal, V. Okatenko, I. Chorkendorff, R. Buonsanti and B. Seger, ACS Appl. Mater. Interfaces, 2022, 14, 7779–7787 CrossRef PubMed.
- Z. Z. Niu, L. P. Chi, R. Liu, Z. Chen and M. R. Gao, Energy Environ. Sci., 2021, 14, 4169–4176 RSC.
- M. H. Barecka, J. W. Ager and A. A. Lapkin, Energy Environ. Sci., 2021, 14, 1530–1543 RSC.
- X. Liu, J. Xiao, H. Peng, X. Hong, K. Chan and J. K. Nørskov, Nat. Commun., 2017, 8, 1–7 CrossRef PubMed.
- R. Kortlever, J. Shen, K. J. P. Schouten, F. Calle-Vallejo and M. T. Koper, J. Phys. Chem. Lett., 2015, 6, 4073–4082 CrossRef CAS PubMed.
- X. Nie, W. Luo, M. J. Janik and A. Asthagiri, J. Catal., 2014, 312, 108–122 CrossRef CAS.
- I. E. L. Stephens, et al. , J. Phys. Energy, 2022, 4, 042003 CrossRef.
- X. Liu, P. Schlexer, J. Xiao, Y. Ji, L. Wang, R. B. Sandberg, M. Tang, K. S. Brown, H. Peng, S. Ringe, C. Hahn, T. F. Jaramillo, J. K. Nørskov and K. Chan, Nat. Commun., 2019, 10, 1–10 CrossRef PubMed.
- J. D. Goodpaster, A. T. Bell and M. Head-Gordon, J. Phys. Chem. Lett., 2016, 7, 1471–1477 CrossRef CAS PubMed.
- W. Luo, X. Nie, M. J. Janik and A. Asthagiri, ACS Catal., 2016, 6, 219–229 CrossRef CAS.
- A. Wuttig, C. Liu, Q. Peng, M. Yaguchi, C. H. Hendon, K. Motobayashi, S. Ye, M. Osawa and Y. Surendranath, ACS Cent. Sci., 2016, 2, 522–528 CrossRef CAS PubMed.
- E. Pérez-Gallent, M. C. Figueiredo, F. Calle-Vallejo and M. T. Koper, Angew. Chem., Int. Ed., 2017, 56, 3621–3624 CrossRef PubMed.
- K. J. P. Schouten, Y. Kwon, C. J. Van Der Ham, Z. Qin and M. T. Koper, Chem. Sci., 2011, 2, 1902–1909 RSC.
- T. Cheng, H. Xiao and W. A. Goddard, Proc. Natl. Acad. Sci. U. S. A., 2017, 114, 1795–1800 CrossRef CAS PubMed.
- A. H. Shah, Y. Wang, A. R. Woldu, L. Lin, M. Iqbal, D. Cahen and T. He, J. Phys. Chem. C, 2018, 122, 18528–18536 CrossRef CAS.
- Z. Wang, L. Wu, K. Sun, T. Chen, Z. Jiang, T. Cheng and W. A. Goddard, J. Phys. Chem. Lett., 2018, 9, 3057–3061 CrossRef CAS PubMed.
- J. P. Grote, A. R. Zeradjanin, S. Cherevko and K. J. Mayrhofer, Rev. Sci. Instrum., 2014, 85, 104101 CrossRef PubMed.
- E. L. Clark, M. R. Singh, Y. Kwon and A. T. Bell, Anal. Chem., 2015, 87, 8013–8020 CrossRef CAS PubMed.
- T. De Vijlder, D. Valkenborg, F. Lemière, E. P. Romijn, K. Laukens and F. Cuyckens, Mass Spectrom. Rev., 2018, 37, 607–629 CrossRef CAS PubMed.
- M. Löffler, K. J. Mayrhofer and I. Katsounaros, J. Phys. Chem. C, 2021, 1833–1838 CrossRef.
- M. Löffler, P. Khanipour, N. Kulyk, K. J. Mayrhofer and I. Katsounaros, ACS Catal., 2020, 10, 6735–6740 CrossRef.
- H. Ren, M. Kovalev, Z. Weng, M. Z. Muhamad, H. Ma, Y. Sheng, L. Sun, J. Wang, S. D. Rihm, W. Yang, A. A. Lapkin and J. W. Ager, Nat. Catal., 2022, 5, 1169–1179 CrossRef CAS.
- T. Burdyny and W. A. Smith, Energy Environ. Sci., 2019, 12, 1442–1453 RSC.
- D. Smith and P. Španěl, TrAC, Trends Anal. Chem., 2011, 30, 945–959 CrossRef CAS.
- A. Jordan, S. Haidacher, G. Hanel, E. Hartungen, J. Herbig, L. Märk, R. Schottkowsky, H. Seehauser, P. Sulzer and T. D. Märk, Int. J. Mass Spectrom., 2009, 286, 32–38 CrossRef CAS.
- E. Sémon, G. Arvisenet, E. Guichard and J. L. Le Quéré, J. Mass Spectrom., 2018, 53, 65–77 CrossRef PubMed.
- Y. Hori, I. Takahashi, O. Koga and N. Hoshi, J. Mol. Catal. A: Chem., 2003, 199, 39–47 CrossRef CAS.
- M. K. Kovalev, H. Ren, M. Zakir Muhamad, J. W. Ager and A. A. Lapkin, ACS Energy Lett., 2022, 7, 599–601 CrossRef CAS.
- S. G. Lias, J. F. Liebman and R. D. Levin, J. Phys. Chem. Ref. Data, 1984, 13, 695–808 CrossRef CAS.
- L. Mandal, K. R. Yang, M. R. Motapothula, D. Ren, P. Lobaccaro, A. Patra, M. Sherburne, V. S. Batista, B. S. Yeo, J. W. Ager, J. Martin and T. Venkatesan, ACS Appl. Mater. Interfaces, 2018, 10, 8574–8584 CrossRef CAS PubMed.
- K. U. Calvinho, A. B. Laursen, K. M. Yap, T. A. Goetjen, S. Hwang, N. Murali, B. Mejia-Sosa, A. Lubarski, K. M. Teeluck, E. S. Hall, E. Garfunkel, M. Greenblatt and G. C. Dismukes, Energy Environ. Sci., 2018, 11, 2550–2559 RSC.
- C. Stönner, B. Derstroff, T. Klüpfel, J. N. Crowley and J. Williams, J. Mass Spectrom., 2017, 52, 30–35 CrossRef PubMed.
- H. Xiao, T. Cheng, W. A. Goddard and R. Sundararaman, J. Am. Chem. Soc., 2016, 138, 483–486 CrossRef CAS PubMed.
- S. D. Rihm, J. Akroyd and M. Kraft, Proc. Combust. Inst., 2022 DOI:10.1016/j.proci.2022.07.096.
- Y. Lum, T. Cheng, W. A. Goddard and J. W. Ager, J. Am. Chem. Soc., 2018, 140, 9337–9340 CrossRef CAS PubMed.
- Y. Hori, A. Murata and R. Takahashi, J. Chem. Soc., Faraday Trans. 1, 1989, 85, 2309–2326 RSC.
- L. Wang, S. A. Nitopi, E. Bertheussen, M. Orazov, C. G. Morales-Guio, X. Liu, D. C. Higgins, K. Chan, J. K. Nørskov, C. Hahn and T. F. Jaramillo, ACS Catal., 2018, 8, 7445–7454 CrossRef CAS.
- A. A. Peterson, F. Abild-Pedersen, F. Studt, J. Rossmeisl and J. K. Nørskov, Energy Environ. Sci., 2010, 3, 1311–1315 RSC.
- Y. Hori, R. Takahashi, Y. Yoshinami and A. Murata, J. Phys. Chem. B, 1997, 101, 7075–7081 CrossRef CAS.
- E. Bertheussen, A. Verdaguer-Casadevall, D. Ravasio, J. H. Montoya, D. B. Trimarco, C. Roy, S. Meier, J. Wendland, J. K. Nørskov, I. E. Stephens and I. Chorkendorff, Angew. Chem., Int. Ed., 2016, 55, 1450–1454 CrossRef CAS PubMed.
- F. Calle-Vallejo and M. T. Koper, Angew. Chem., Int. Ed., 2013, 52, 7282–7285 CrossRef CAS PubMed.
- X. Nie, M. R. Esopi, M. J. Janik and A. Asthagiri, Angew. Chem., 2013, 125, 2519–2522 CrossRef.
- Y. Y. Birdja, E. Pérez-Gallent, M. C. Figueiredo, A. J. Göttle, F. Calle-Vallejo and M. T. Koper, Nat. Energy, 2019, 4, 732–745 CrossRef CAS.
- W. J. Durand, A. A. Peterson, F. Studt, F. Abild-Pedersen and J. K. Nørskov, Surf. Sci., 2011, 605, 1354–1359 CrossRef CAS.
Footnotes |
| † Electronic supplementary information (ESI) available. See DOI: https://doi.org/10.1039/d2ee03752a |
| ‡ These authors contributed equally to this work. |
| This journal is © The Royal Society of Chemistry 2023 |